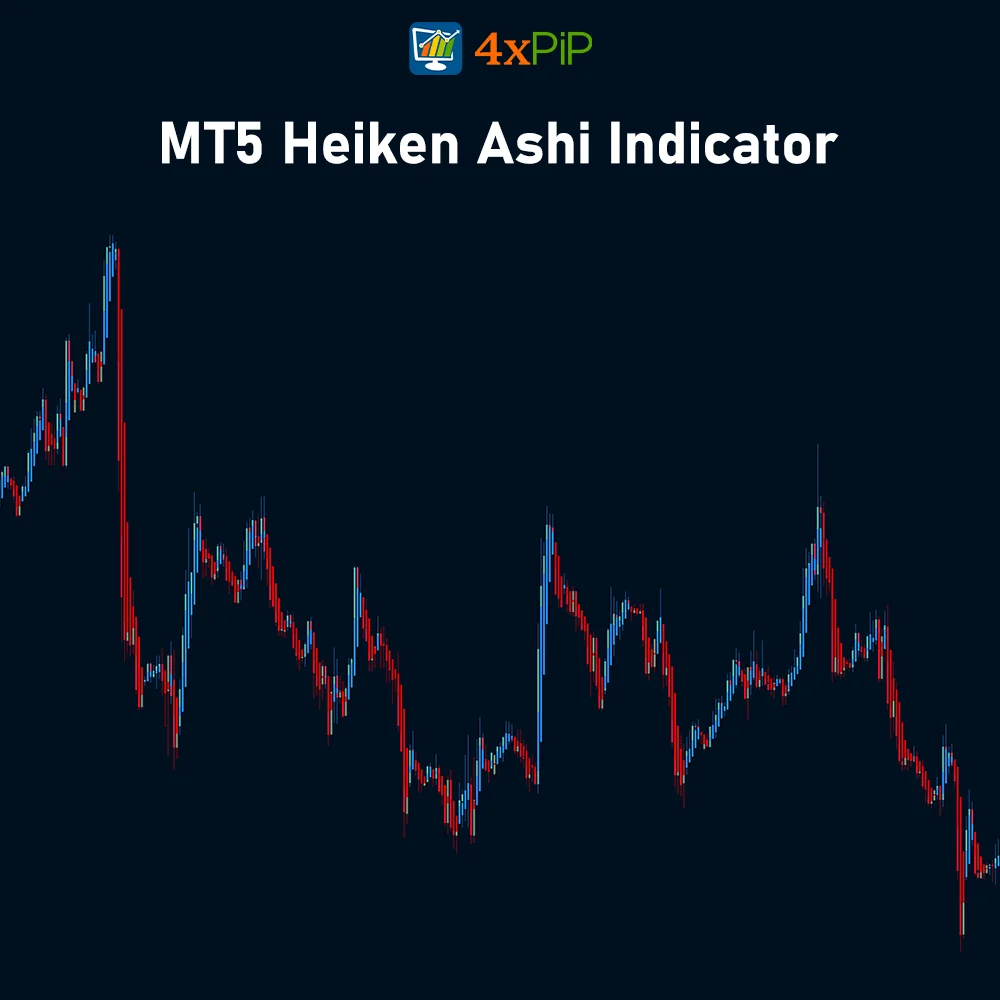

Heiken Ashi Indicator for MetaTrader 5 – Free Download
$0.00
Description
What is the Heiken Ashi Indicator? The Heiken Ashi indicator, derived from the Japanese “average bar” term, is a candlestick chart used in financial trading analysis. Heiken Ashi candles modify traditional Japanese candlesticks developed by Munehisa Homma, a 17th-century Japanese rice trader. They retain the open and close prices, but adjust the high and low based on previous price action, creating a smoother visual representation of the trend.
Formula for MT5 Heiken Ashi Indicator
Heiken Ashi uses a modified formula to calculate each candle’s open, close, high, and low prices. This modification results in a more visually appealing chart that helps traders identify trends and potential reversals more effectively.
Open = (open of previous bar + close of previous bar) / 2
Close = (open + close + high + low of current bar) / 4
High = the maximum value from the current period’s high, open, or close.
Low = the minimum value from the current period’s low, open, or close.
How to Trade with the Heiken Ashi Indicator?
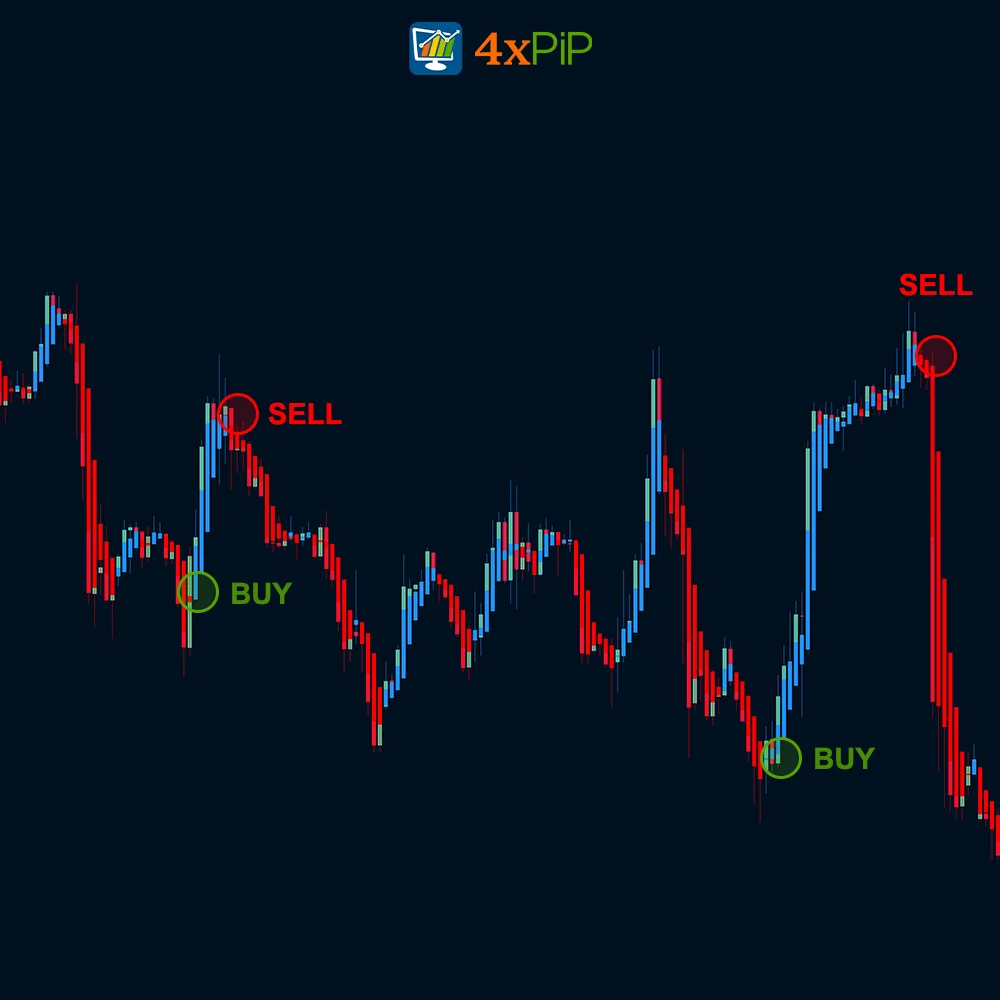
When the Heikin Ashi candle changes from a bearish (red) to a bullish (blue) color, it signals a potential upward reversal in price. If you currently hold a short or sell position, consider closing the position. If you currently hold a long or buy position, consider adding to your position.
Conversely, When the Heikin Ashi candle shifts from a bullish (blue) to a bearish (red) color, it indicates a potential downward reversal in price. Consider closing the position if you are presently holding a long or buy position. If you currently hold a short or sell position, it might be an opportune time to contemplate increasing your position.
Best Strategy for Heiken Ashi Indicator
The effectiveness of a Heiken Ashi strategy depends on various factors, including market conditions, timeframe, and individual trading preferences. Here’s a popular and widely used Heiken Ashi trading strategy:
Strong Bullish or Bearish Pattern
Inside and Engulfing Bars
Look for a Heiken Ashi candle within the previous one’s body (an inside bar). This may signal a trend reversal, especially if accompanied by diverging indicators. When a large Heiken Ashi candle completely engulfs the previous one’s body, it might indicate a strong trend reversal.
Moving Average Crossover
Combine Heiken Ashi with moving averages. Enter long or buy when a shorter moving average crosses above a longer one and vice versa for short or sell. Look for Heiken Ashi’s color confirmation for added confidence.
Features:
Key Features of Heiken Ashi:
- Trend Identification: Heiken Ashi candles are excellent for trend analysis. Blue candles typically indicate an uptrend or bullish pattern, while red candles suggest a downtrend or bearish pattern. The color changes are based on the relationship between the current and previous candle’s close and open prices.
- Reduced Market Noise: The indicator is designed to smooth out price fluctuations, making it easier for traders to focus on the overall trend rather than getting distracted by short-term volatility. Heiken Ashi candles make trends more obvious by filtering out minor fluctuations, potentially reducing false signals and confusion.
- Spotting Reversals: Heiken Ashi can assist traders in identifying potential trend reversals by recognizing changes in candle color patterns.
- Smoothed Price Movements: Compared to standard candlestick charts, the Heiken Ashi bars provide a smoother image of price movements based on average prices. Traders may find it easier to recognize trends and possible reversals because of this smoothing effect.
- Support and Resistance Levels: Traders can use the Heiken Ashi Indicator to identify potential support and resistance levels. The placement of Heiken Ashi bars in relation to these levels allows traders to determine the strength of the market and potential reversal points.
- Flexible Timeframe: Any time frame, including hourly, daily, monthly, and so on, can be used with this technique. Longer time frames are more reliable.
- Entry and Exit Signals: Furthermore, the indicator can produce signals for potential market entry and exit points signals. To determine whether to open or close a trade, traders may watch for color shifts, patterns in bars, or certain bar formations.
- Reliability: Also, he Heikin-Ashi indicator yields accurate data and is highly reliable. It utilizes historical data, which is also entirely trustworthy.
- Customization: The Heiken Ashi Indicator’s visual representation on the chart, color scheme, and bar style are among the many factors traders can customize.
- Alerts: The indicator can produce visual and audio alerts when specific signals or conditions are fulfilled. Without requiring ongoing manual monitoring, this function assists traders in staying informed about possible trading opportunities or trend reversals.
- Psychological Edge: Lastly, Heiken Ashi’s unique appearance can provide a distinct psychological advantage, helping traders avoid emotional responses to volatile markets.
Conclusion
The 4xPip Heiken Ashi Indicator for MetaTrader 5 can be valuable in your trading toolkit, offering visual clarity and enhancing trend identification. Moreover, you can potentially improve your trading performance by downloading and integrating this indicator into MetaTrader 5. Get your hands on a free Heiken Ashi indicator for MT5 now!
DOWNLOAD NOW Reach Us on WhatsApp
 Fly Over to Telegram
 Drop Us an Email
Q & A
The Heikin-Ashi technique can be employed alongside candlestick charts to identify market trends and forecast future prices when trading securities. It enhances the readability of candlestick charts and facilitates a more straightforward analysis of trends.
Heikin Ashi charts are classified as lagging indicators since they rely on historical price data. Traders must recognize the potential delay in identifying new trends or reversals.
It varies based on your preference; if your goal is to identify trends with a preference for a smoother price presentation and reduced noise, then the Heikin-Ashi chart is suitable for you. On the other hand, if you seek comprehensive and detailed information, including all patterns, opt for the standard candlestick chart.
To optimize the use of Heiken Ashi candlesticks, experts recommend employing the 5- and 15-minute time frames.
An alternative method of applying Heikin-Ashi involves incorporating technical indicators such as moving averages, Bollinger bands, and the Relative Strength Index (RSI). The concept behind using these indicators parallels their utilization in traditional candlestick patterns.
Related products
-
 Premium
Forex News (EA) Expert Advisor for MT5 | Economic Calendar
Original price was: $199.00.$99.00Current price is: $99.00. Select options -
 Free
FreeMT5 EA Rsi
Original price was: $100.00.$20.00Current price is: $20.00. Select options -
 Free
FreeMT5 EA Drawdown Limiter
Original price was: $100.00.$10.00Current price is: $10.00. Select options -
 Premium
FOREX TRADE MANAGER MT5 EA
Original price was: $249.00.$49.00Current price is: $49.00. Select options
Reviews
There are no reviews yet