Best MTF Support and Resistance indicator – MT4 Download Free
$0.00
MTF Support and Resistance Indicator is a unique and powerful tool that allows you to select multiple timeframes in order to simplify your trading analysis across multiple timeframes. It helps in better trend analysis and predictions by drawing various lines according to the timeframes. You can easily open buy and sell trades at the right time using this technical analysis.
Description
What is MTF Support and Resistance? Multi-Time Frame (MTF) Support and Resistance is like looking at support and resistance levels on a price chart from different angles. These levels are where a lot of buying or selling happens, possibly causing the price to change direction. With MTF analysis, we don’t just look at these levels on main chart; we also check on longer/shorter timeframe charts. For example, if we’re trading on daily chart, we might also look at support and resistance on weekly/hourly charts. This helps us get an overall picture of the market and find important levels that matter across different time periods. MTF Support and Resistance analysis helps traders make smarter decisions by giving broader view. It makes it easier to decide when to enter or exit trades based on these key levels.
Using Multi-Time Frame (MTF) Support and Resistance in trading has some cool advantages. First off, it gives us complete picture of market by looking at support and resistance levels from different time perspectives. This means we can spot strong levels that matter more because they show up on various charts. Secondly, it helps us make smarter decisions about when to buy or sell by giving a wider view of market. So, with MTF analysis, we’re not just guessing; we’re getting a clearer picture of where the market might be headed. It’s like having a better map for navigating our trades!
Formula:
Pivot Point (PP) = (High + Low + Close) / 3
First Resistance (R1) = (2 x PP) – Low.
First Support (S1) = (2 x PP) – High.
Second Resistance (R2) = PP + (High – Low)
Second Support (S2) = PP – (High – Low)
Third Resistance (R3) = High + 2 x (PP – Low)
Third Support (S3) = Low – 2 x (High – PP)
How to Trade with MTF Support and Resistance Indicator:
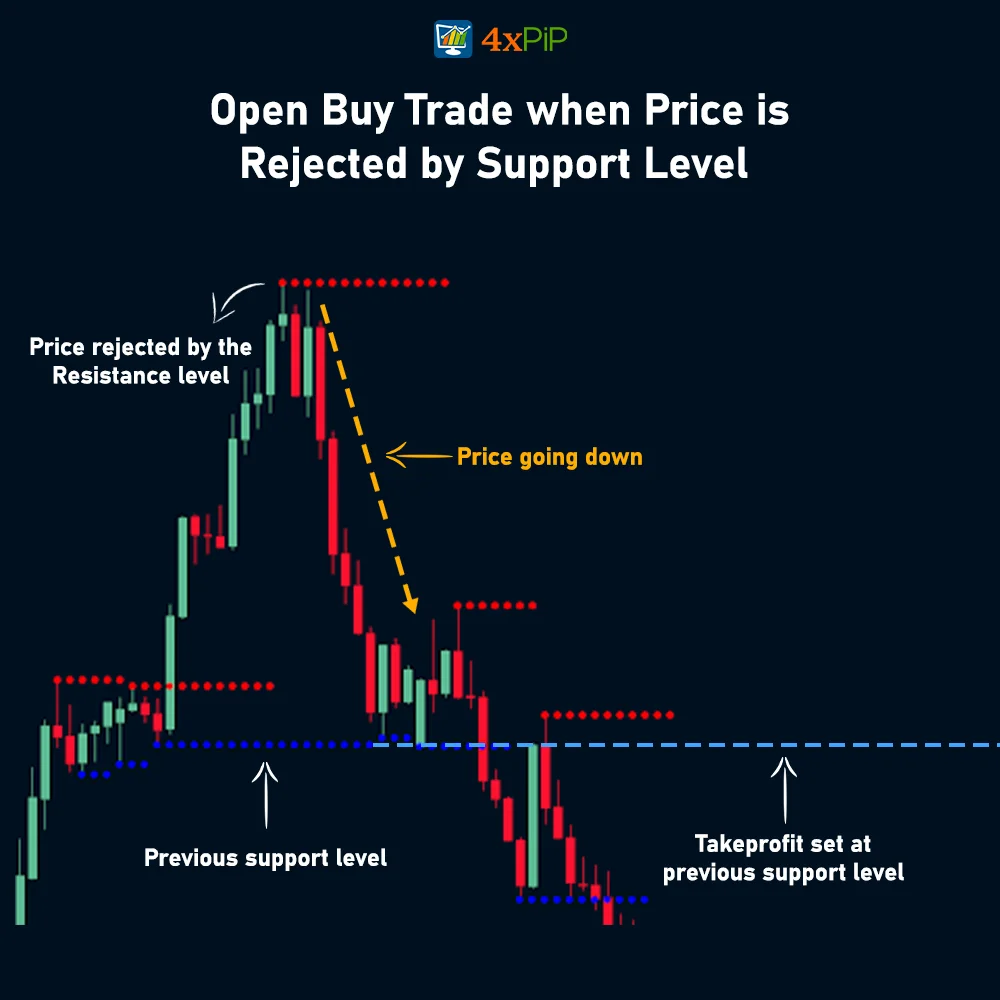
Open a buy trade when there’s a support level below and the price rejects it. Its takeprofit will be at the previous resistance level while the stoploss will be according to the risk-to-reward ratio.
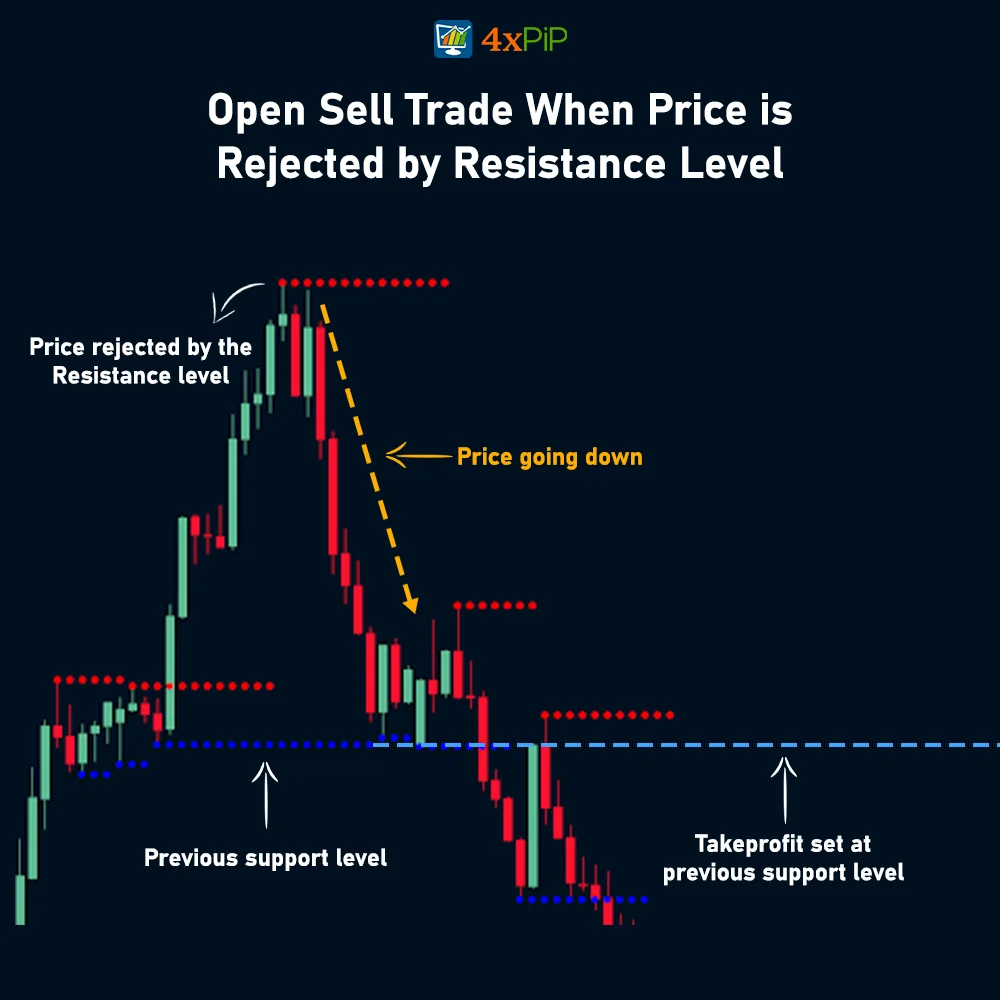
For sell trade, open a trade when there’s a resistance level above and the price rejects it. Its takeprofit will be at the previous support level while the stoploss will be according to the risk-to-reward ratio.
Features:
The features of a Multi-Time Frame (MTF) Support and Resistance Indicator include:
- Simultaneous Analysis: It allows traders to analyze support and resistance levels across multiple timeframes simultaneously, providing comprehensive view of market.
- Enhanced Perspective: By incorporating various time intervals, the indicator offers a broader perspective on the strength and significance of support and resistance levels, helping traders make more informed decisions.
- Buy/Sell Trades: With this Indicator, buy when price bounces off support level below, setting take-profit at the previous resistance, and stop-loss based on risk-to-reward. For sell trades, sell when price rejects resistance level above, aiming for take-profit at previous support, and set stop-loss using chosen risk-to-reward ratio. This strategy simplifies trading decisions using clear entry and exit points provided by the indicator.
- Decision Support: Assists in decision-making on when to enter/exit trades by highlighting significant support and resistance zones across multiple timeframes.
- User-Friendly Interface: The indicator often comes with a user-friendly interface, making it accessible for traders of varying experience levels.
- Customization Options: Traders can often customize indicator’s settings, allowing to adapt it to their specific trading preferences and objectives.
- Timeframes: Traders can specify the timeframes they want the indicator to consider. For example, they might choose to analyze support and resistance levels on daily, 4-hour, and 1-hour charts simultaneously.
- Support and Resistance Calculation Method: This input allows users to select the method used to calculate support and resistance levels. Common methods include horizontal lines, trendlines, or other technical analysis tools.
- Lookback Period: Determines the number of previous bars or candles the indicator considers when identifying support and resistance levels. A longer lookback period may capture more historical data but could be less responsive to recent price movements.
- Color Settings: Enables users to customize the colors of the support and resistance lines for better visibility on the chart.
- Alerts: Some MTF Support and Resistance Indicators include alert functionalities, allowing traders to receive notifications when a certain level is reached. This input lets users enable or disable these alerts.
- Line Style/Thickness: Allows customization of visual appearance of support and resistance lines, such as line style(solid, dashed) and thickness.
These features collectively make the MTF Support and Resistance Indicator a valuable tool for traders seeking a holistic and detailed analysis of market dynamics across different timeframes.
Benefits of MTF Support and Resistance Indicator:
The MTF (Multi-Timeframe) Support and Resistance Indicator brings valuable benefits to traders. By offering a clear identification of trends, it enables users to make more informed decisions. Indicator focuses on multiple timeframes for pinpointing support and resistance levels, aiding traders in choosing optimal entry/exit points for trades. Notably, it reduces market noise, allowing traders to concentrate on significant price levels. Its versatility is another advantage, making it adaptable to various trading styles and preferences. Additionally, the indicator promotes better risk management by highlighting levels where the market is likely to react, assisting traders in setting appropriate stop-loss and take-profit points. Its simplicity and time efficiency further contribute to its effectiveness, providing a straightforward visual representation of support and resistance levels across different timeframes.
Conclusion
The MTF Support and Resistance Indicator is a robust tool for simplified trading analysis across multiple timeframes, offering features like simultaneous analysis, versatile customization, and clear visual representation. It aids in identifying key levels, providing an enhanced perspective on market strength. With real-time updates, decision support, and integration with trading strategies, this user-friendly indicator is valuable for traders, allowing them to make informed decisions and navigate the market effectively. Whether opening buy trades at rejected support levels or sell trades at rejected resistance levels, the indicator aligns with the risk-to-reward ratio for successful trading strategies.
DOWNLOAD NOW Reach Us on WhatsApp
 Fly Over to Telegram
 Drop Us an Email
Settings
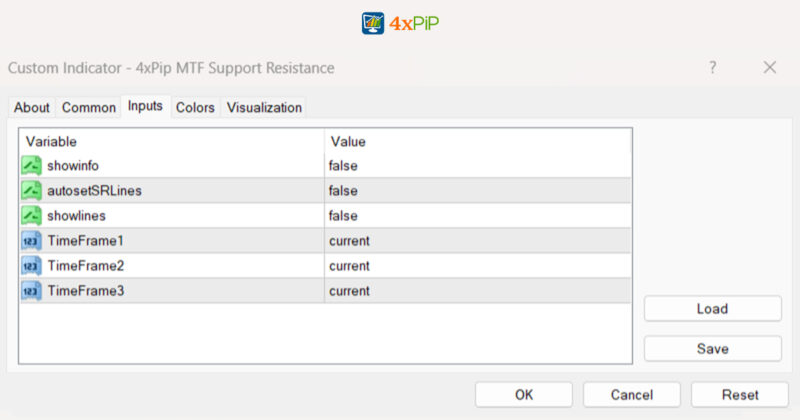
- Show information: True => Indicator MTF Support and Resistance will show the information on the chart. False => Indicator will Not show any information on the chart.
- Auto Set SR Lines: True => Indicator will automatically adjust the support and resistance lines according to your current timeframe. False => indicator will use the user-specified timeframes.
- Show lines: True => Indicator will display the Support and Resistance lines. False => Indicator will Not display the Support and Resistance lines.
- Timeframe 1: Adjust timeframe 1 for Support Resistance lines. You can select any timeframe such as 1 Min, 5 Min, 15 Min, 30 Min, 1 Hour, 4 Hour, 1 Day, 1 Week and 1 month
- Timeframe 2: Adjust timeframe 2 for Support Resistance lines. You can select any timeframe such as 1 Min, 5 Min, 15 Min, 30 Min, 1 Hour, 4 Hour, 1 Day, 1 Week and 1 month
- Timeframe 3: Adjust timeframe 3 for Support Resistance lines. You can select any timeframe such as 1 Min, 5 Min, 15 Min, 30 Min, 1 Hour, 4 Hour, 1 Day, 1 Week and 1 month
20 reviews for Best MTF Support and Resistance indicator – MT4 Download Free
| 5 star | 65% | |
| 4 star | 35% | |
| 3 star | 0% | |
| 2 star | 0% | |
| 1 star | 0% |
Q & A
Yes, the indicator is designed with a user-friendly interface, making it accessible for traders of different experience levels, ensuring both beginners and experienced traders can benefit from its features.
Yes, traders can customize the settings of the indicator to adapt it to their specific trading preferences and objectives, providing flexibility in analyzing support and resistance levels.
The MTF Support and Resistance Indicator assists in decision-making by highlighting significant support and resistance zones across multiple timeframes, aiding traders in determining when to enter or exit trades.
The key features include simultaneous analysis across timeframes, enhanced perspective, identification of crucial levels, versatility, clear visual representation, decision support, integration with trading strategies, a user-friendly interface, customization options, and real-time updates.
MTF analysis provides a more complete picture of the market, allowing traders to spot strong levels that matter across various charts. It helps in making smarter decisions about when to buy or sell by offering a wider view of the market.
Related products
-
 Premium
MT4 BreakEven EA
Original price was: $99.00.$10.00Current price is: $10.00. Select options -
 Free
FreeMT4 Heiken Ashi Indicator
$0.00 Select options -
 Premium
MT4 EA to send Signal Alerts to Telegram channel
Original price was: $100.00.$30.00Current price is: $30.00. Select options -
 Free
FreeMT4 Waddah Attar Explosion Indicator
$0.00 Select options
Martingale EA is effective, but it’s not a foolproof strategy. The 100% winning rate claim is a bit ambitious. Use it cautiously, and it can be a valuable asset in your trading arsenal.
Martingale Forex EA is a powerful tool, especially for navigating volatile markets. The 100% winning rate is a bit optimistic, but with proper risk management, it can be a game-changer.
Martingale Forex EA turned my trading game around. The 100% winning rate claim is no joke. I’ve experienced consistent profits, and the counter trades are a lifesaver. Highly recommended!
Martingale Forex EA is effective, but the 100% winning rate claim should be taken with caution. It’s a valuable tool, but like any strategy, it requires careful consideration and risk management.
Martingale EA is a brilliant creation. The 100% winning rate is not an exaggeration. It has significantly improved my trading success, and the counter trades are a genius addition.