Traders Dynamic Index indicator for MetaTrader 4
$0.00
4xPip Traders Dynamic Index indicator MT4 is a comprehensive tool that combines RSI, Moving Averages, and Bollinger Bands. This hybrid indicator is developed to assist traders in their ability to analyze and track market conditions related to trend direction, market strength, and market volatility.
Description
What is Traders Dynamic Index (TDI) indicator? The TDI indicator, widely used in technical analysis, correlates market volatility with market strength by combining three key indicators. Moreover, the TDI indicator incorporates RSI for momentum analysis, aiding in identifying overbought or oversold conditions. Also, Bollinger Bands within the TDI assist in assessing market volatility and guiding traders in adapting their strategies. Essentially, it suggests that an ideal market scenario combines volatility and strength.
What is the Traders Dynamic Index Strategy?
TDI Cross strategy entails observing potential crossovers between the RSI Price Line and the Trade Signal Line. A buy signal is generated when the Price Line crosses above the Trade Signal Line, signaling a potential upward trend.
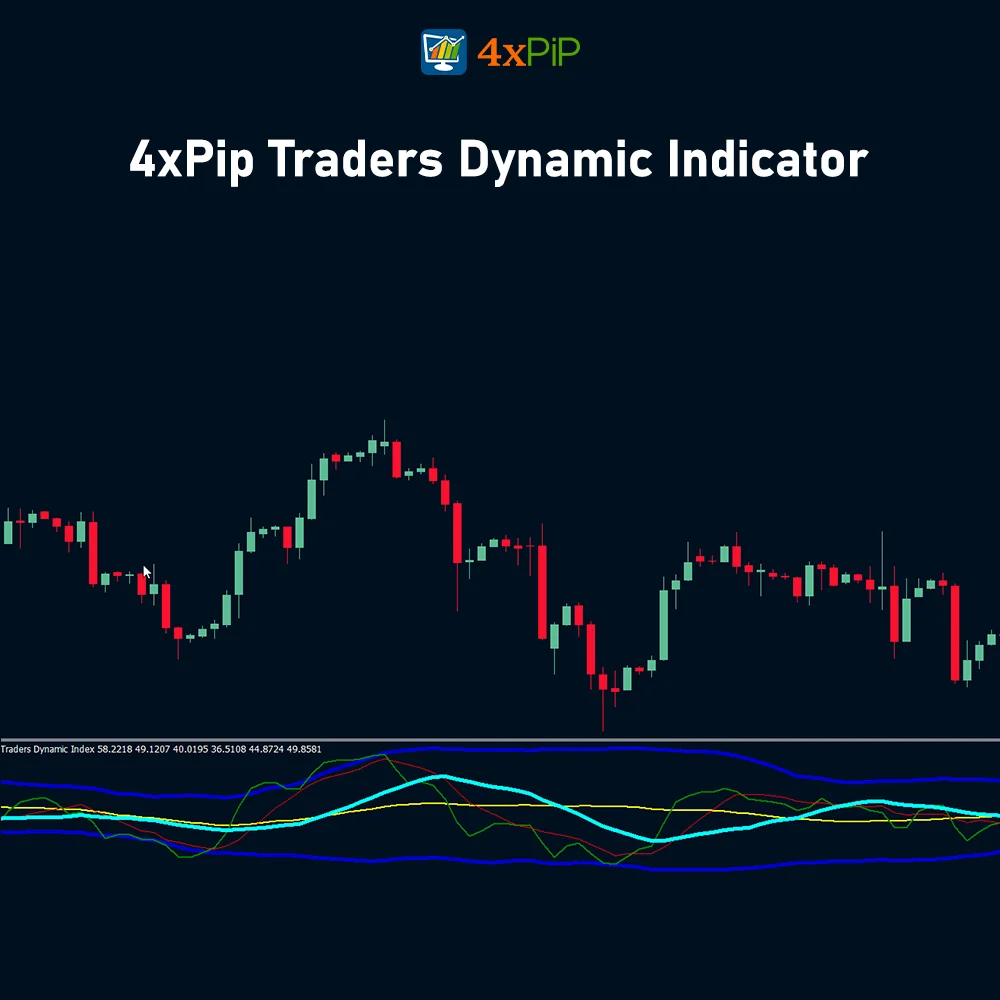
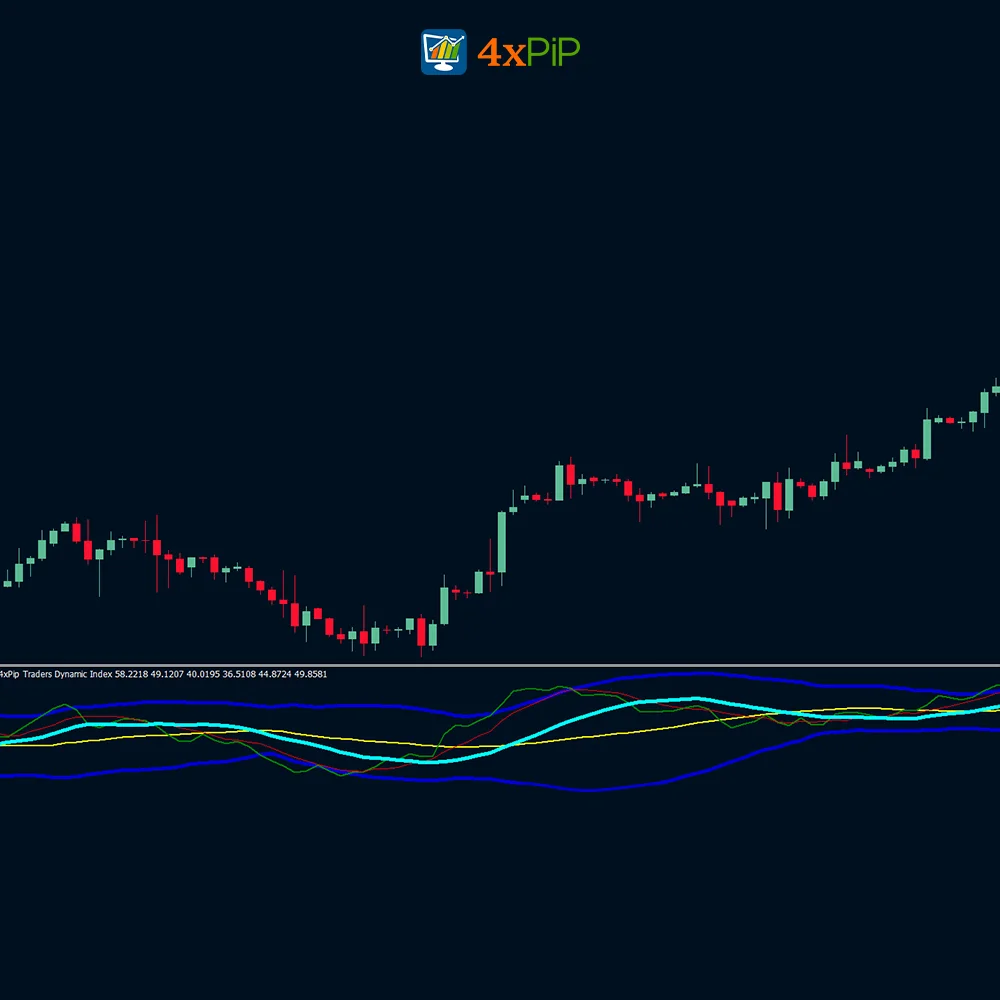
Furthermore, the 4xPip Traders Dynamic Index indicator for MT4 combines RSI, moving averages, and Bollinger bands. Moreover, with its established track record in the forex market, the TDI is adept at recognizing bullish and bearish price trends and offering traders optimal buy and sell signals. Also, it opens in a new chart and shows 4 lines with different colors for visual identification.
- Green line = RSI Price line
- Red line = Trade Signal line
- Blue lines = Volatility Band
- Lastly, Yellow line = Market Base Line
It is effective across various intraday timeframes as well as daily, weekly, and monthly charts, catering to both beginners and experienced forex traders. Despite its comprehensive nature, it’s readily accessible as a free download, simple to install, read, and use in trading strategies.
How to Trade with MT4 Traders Dynamic Index Indicator?
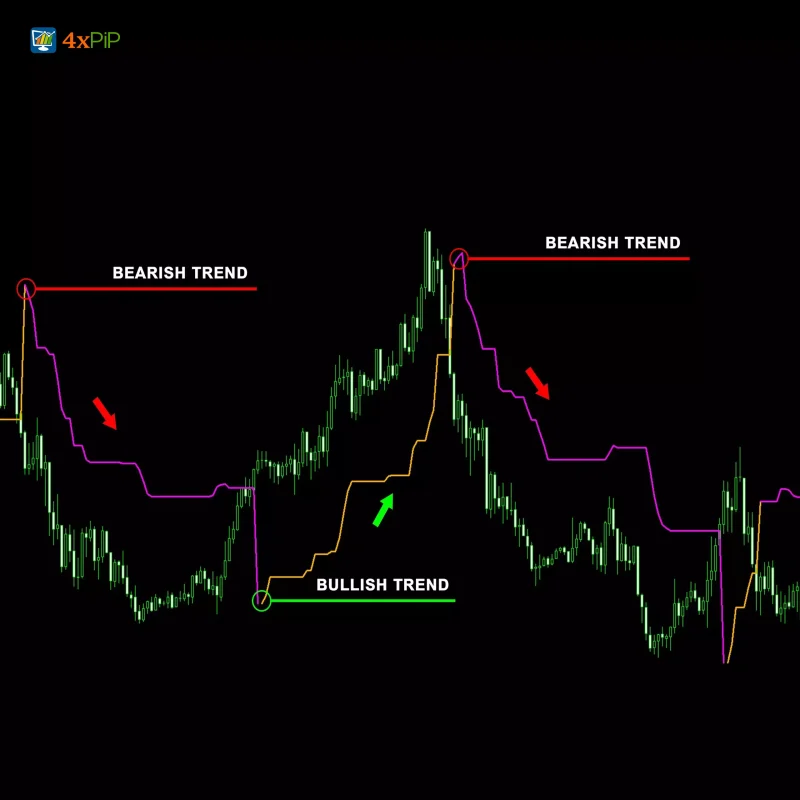
Trading with the MT4 Traders Dynamic Index indicator involves assessing trend direction, market strength, and volatility for entry and exit points.
Trend Direction:
- Immediate: Green over Red indicates an upward price movement, while Red over Green suggests a downward trend.
- Overall: The Yellow line fluctuates between lines 32 and 68. Look for reversals when it bounces off these lines. Trade long above the Yellow line and short below it.
Market Strength & Volatility:
Market strength is determined by the slope of the green line, while volatility is indicated by the expansion or contraction of the blue lines.
- Immediate: A steep slope of the Green line signifies strong market strength, while a moderate to flat slope suggests weakness.
- Overall: Expanding Blue lines indicate a strong, trending market, while constricting lines suggest weakness or consolidation. Tight Blue lines may precede market spikes due to economic announcements or other conditions.
Entry Conditions:
Entry conditions vary based on trading style, from scalping to moderate trading, with specific criteria for long and short positions.
- Scalping:
- Long: Green over Red
- Short: Red over Green
- Active:
- Long: Green over Red & Yellow lines
- Short: Red over Green & Yellow lines
- Moderate:
- Long: Green over Red, Yellow, & 50 lines
- Short: Red over Green, Green below Yellow & 50 lines
Exit Conditions:
Exit conditions involve monitoring crosses between the green and red lines, with consideration given to crosses with the blue lines.
-
- Long: Green crosses below Red
- Short: Green crosses above Red
Lastly, consider exiting if Green crosses either Blue line and re-enters later.
Features:
Below are Traders Dynamic Index indicator for MetaTrader 4’s key features, illustrating how it works, its capabilities, and its advantages:
- Multi-Indicator Integration: The TDI indicator integrates multiple technical indicators, including Moving Averages, RSI (Relative Strength Index), and Bollinger Bands. This integration provides traders with a holistic view of market dynamics.
- Dynamic Trend Identification: Also, by analyzing multiple indicators simultaneously, the TDI indicator dynamically identifies market trends, helping traders to spot potential trend reversals or continuations.
- RSI-Based Momentum Analysis: The inclusion of RSI in the TDI indicator allows traders to gauge the strength of price movements and identify overbought or oversold conditions, enhancing decision-making in volatile market environments.
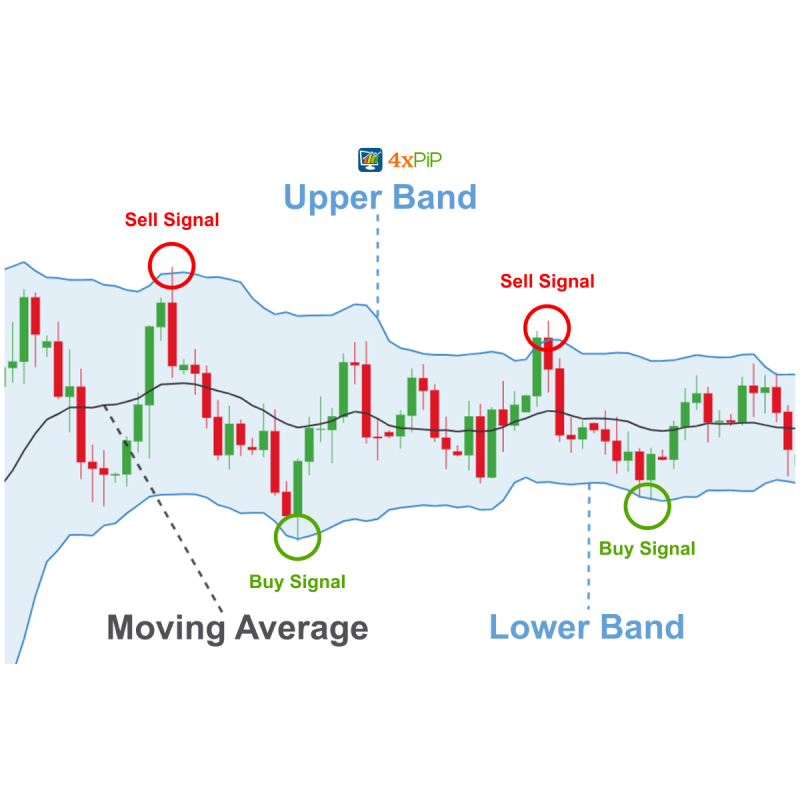
- Volatility Assessment with Bollinger Bands: Furthermore, the utilization of Bollinger Bands within the TDI indicator helps traders assess market volatility. Expansion or contraction of the bands indicates changes in volatility levels, assisting traders in adjusting their strategies accordingly.
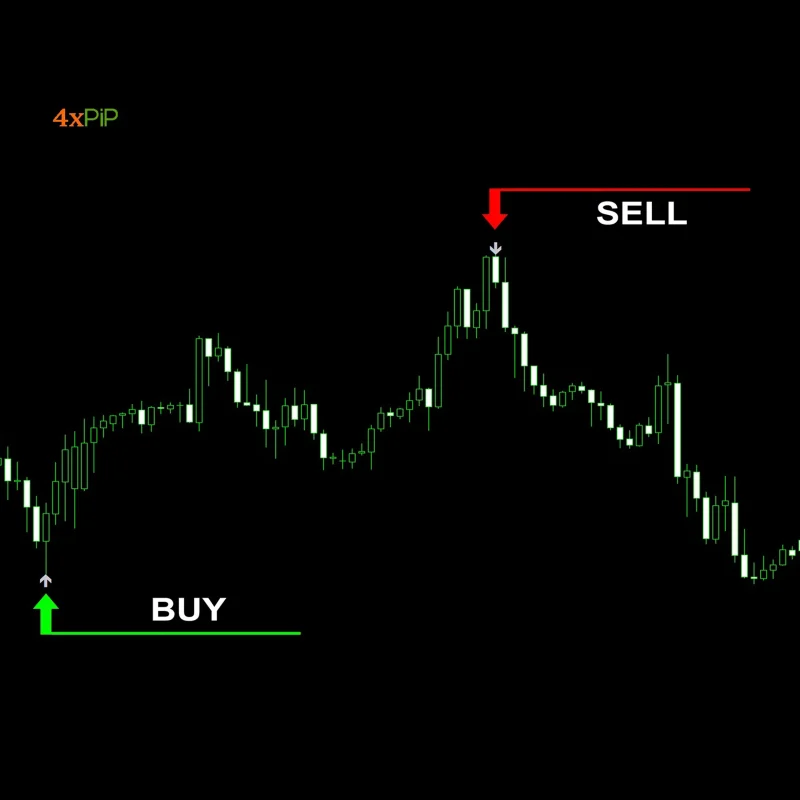
- Signal Generation: The TDI indicator generates clear visual signals on price charts, indicating potential entry or exit points based on its integrated analysis of various indicators. These signals help traders make informed trading decisions.
- Buy and Sell signals: TDI generates buy and sell signals based on the interaction of its component lines, Price Line (Green) Represents a smoothed RSI value, Trade Signal Line (Red) A slower-smoothed RSI moving average. Volatility Band (Yellow) A center line with upper and lower bands.
- Customization: Also, TDI offers various parameters to adjust its behavior to your trading style:
- RSI Period: Controls the smoothing of the RSI calculation.
- Volatility Band Period: Sets the timeframe for volatility calculations.
- Standard Deviations: Defines the width of the volatility bands.
- Compatibility and Accessibility: The TDI indicator is compatible with MetaTrader 4, one of the most widely used trading platforms in the forex market. Its availability for free download makes it accessible to traders of all experience levels.
- Real-Time Market Insights: Moreover, by providing real-time analysis of market trends and momentum, the TDI indicator equips traders with valuable insights into current market conditions, enabling them to adapt their strategies effectively.
- User-Friendly Interface: Despite its advanced analytical capabilities, the TDI indicator features a user-friendly interface that allows traders to easily interpret its signals and integrate them into their trading decisions.
- Enhanced Risk Management: Lastly, with its integrated analysis of multiple indicators, the TDI indicator assists traders in implementing effective risk management strategies by identifying potential entry and exit points with improved accuracy.
Conclusion
In short, the 4xPip Traders Dynamic Index (TDI) indicator for MT4 is a versatile tool designed by combining multiple technical indicators, including RSI, moving averages, and Bollinger Bands. It provides a comprehensive view of market trends, momentum, and volatility. Whether used as part of a larger trading strategy or on its own, the TDI indicator offers valuable insights and helps traders identify optimal entry and exit points, ultimately contributing to improved trading outcomes and increased profitability in the Forex market. Finally, download the 4xPip Traders Dynamic Index (TDI) indicator for free today and get the benefits.
DOWNLOAD NOW Reach Us on WhatsApp
 Fly Over to Telegram
 Drop Us an Email
Settings
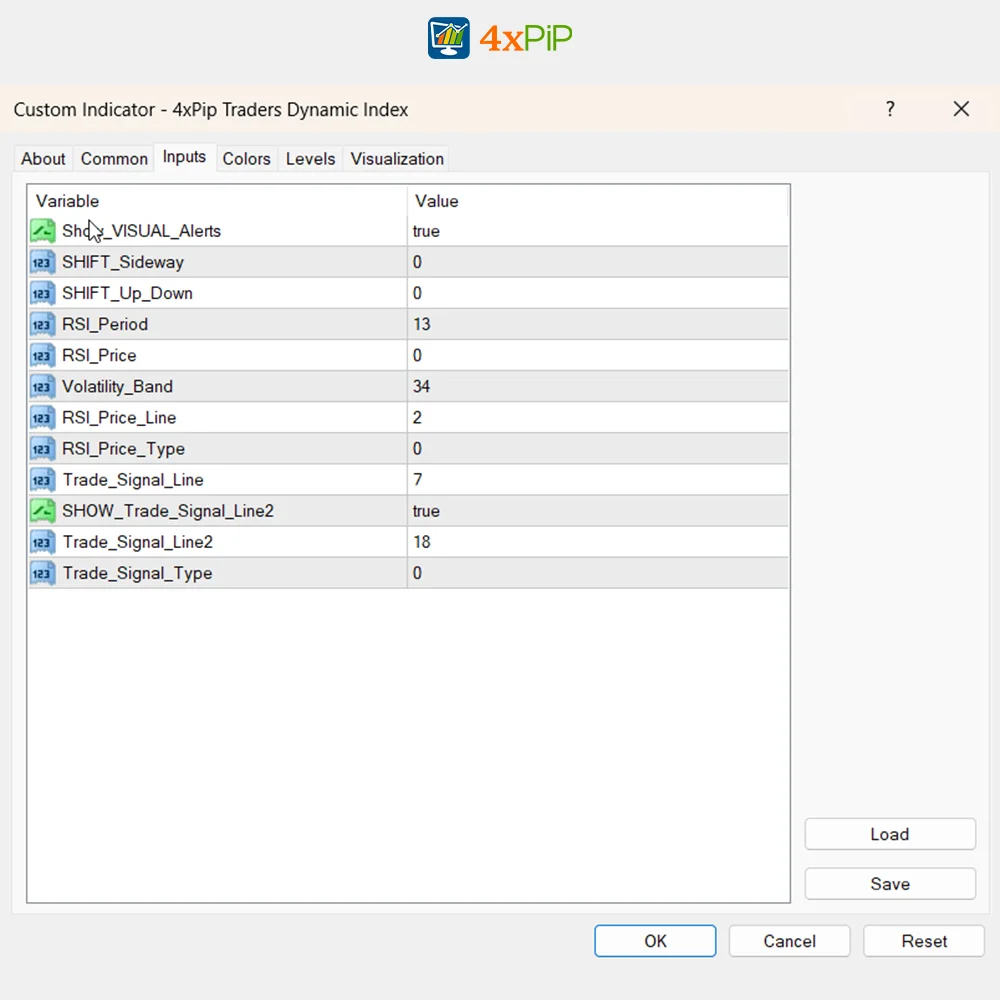
IMPORTANT: The default settings are well-tested and proven. But, you can change the settings to fit your trading style.
- Show_VISUAL_Alerts: True => shows the visual alerts, False => does not show the visual alerts
- SHIFT_Sideway: Adjusts SHIFT sideway for indicator
- SHIFT_Up_Down: Adjusts SHIFT Up Down for indicator
- RSI_Period: Adjusts Period for RSI.
- RSI_Price: Adjusts Price for RSI.
- Volatility_Band: Adjusts volatility band according to your need. The higher value increases the size of the band.
- RSI_Price_Line: Sets RSI Price line that is the period of the fast-moving average of RSI.
- RSI_Price_Type: Sets RSI Price type that is the type of the fast-moving average used for indicator
- Trade_Signal_Line: Sets trade signal line that is the period of the slow-moving average.
- SHOW_Trade_Signal_Line2: True => shows the trade signal line2, False => does not show the trade signal line2
- Trade_Signal_Line2: Sets the trade signal line2
- Trade_Signal_Type: Sets the trade signal type that is the type of the slow-moving average.
- Price & Line Type settings:
RSI Price settings
- 0 = Close price [DEFAULT]
- 1 = Open price.
- 2 = High price.
- 3 = Low price.
- 4 = Median price, (high+low)/2.
- 5 = Typical price, (high+low+close)/3.
- 6 = Weighted close price, (high+low+close+close)/4.
RSI Price Line & Signal Line Type settings
- 0 = Simple moving average [DEFAULT]
- 1 = Exponential moving average
- 2 = Smoothed moving average
- 3 = Linear weighted moving average
41 reviews for Traders Dynamic Index indicator for MetaTrader 4
| 5 star | 56% | |
| 4 star | 43% | |
| 3 star | 0% | |
| 2 star | 0% | |
| 1 star | 0% |
Q & A
Yes, TDI allows you to adjust parameters like RSI period, volatility band period, and standard deviations to tailor it to your preferences.
After you download the file, extract it. Then, go to the "File" menu in your MT4 platform and select "Open Data Folder." Find the "Mql4" folder and open the "Indicators" folder. Copy and paste the extracted files into this folder. Finally, restart MetaTrader 4.
You can download your Traders Dynamic Index indicator for MT4 free from the 4xPip website. Also, you can contact [email protected] now to get your indicator and make your life easier.
To initiate a buy trade, look for the green line to cross above the red line, preferably above the balance line at 50. Additionally, ensure that the yellow line confirms the uptrend. Conversely, for a sell trade, wait for the green line to cross below the red line.
The TDI Indicator Trading Strategy can be executed in four simple steps:
1. Install the Traders Dynamic Index Indicator on your chart.
2. Determine the overall market trend using the Market Baseline (MBL).
3. Look for the RSI Line to cross below the MBL, but ensure it does not fall below the Lower Volatility Band.
4. Set your Stop Loss and Take Profit levels accordingly.

Martingale EA delivers as promised. The Takeprofit feature works like magic, and it adapts well to market conditions. My trading success has seen a noticeable boost since I started using it.
Martingale EA is a brilliant creation. The 100% winning rate is not an exaggeration. It has significantly improved my trading success, and the counter trades are a genius addition.
As a beginner, Martingale EA has been a game-changer for me. The automatic trading and counter trades make it easy to navigate the market. My confidence in trading has soared.
Martingale EA is a brilliant creation. The 100% winning rate is not an exaggeration. It has significantly improved my trading success, and the counter trades are a genius addition.
Martingale EA delivers as promised. The Takeprofit feature works like magic, and it adapts well to market conditions. My trading success has seen a noticeable boost since I started using it.