Moving Average Dot Indicator for MetaTrader 4 – Download Now!
$0.00
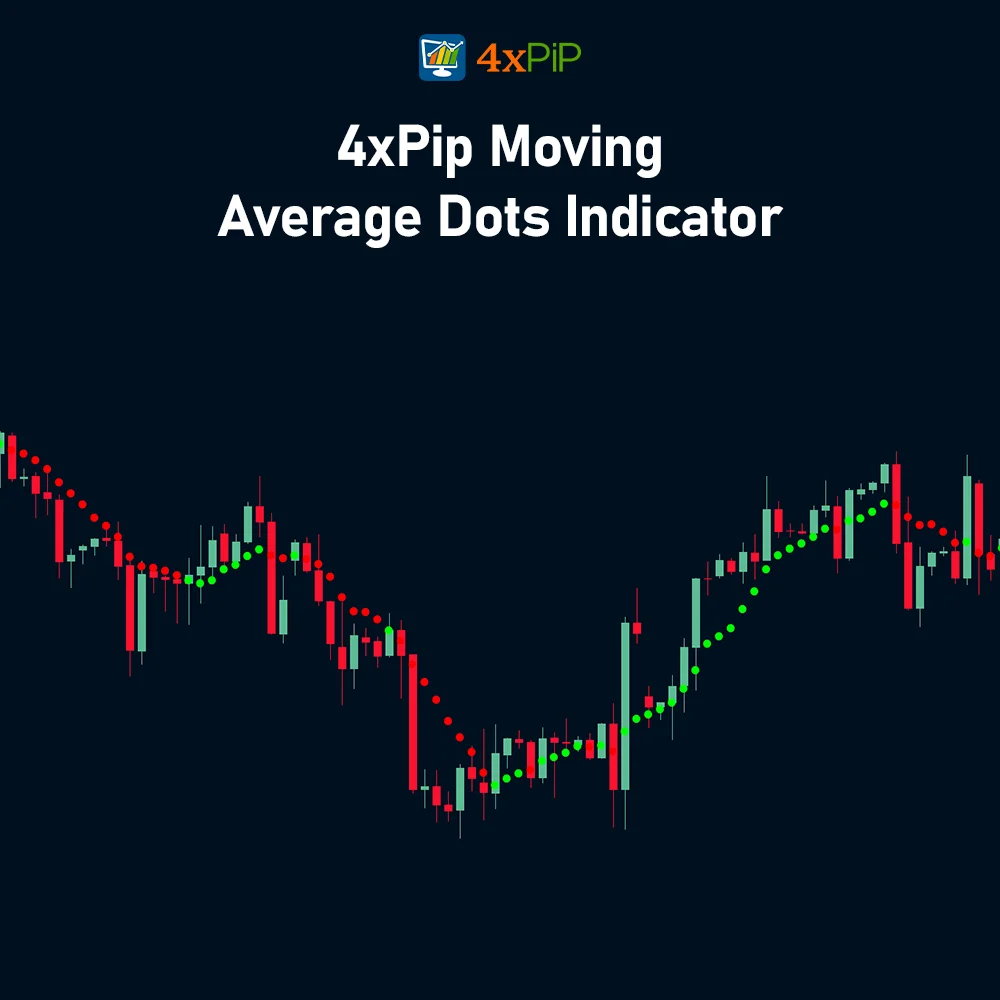
Moving Average Dot Indicator is an amazing indicator as it uses green and red dots to show traders market trends. The indicator’s dotted chart representation offers a straightforward visual of market trends, allowing Traders to make quick and informed decisions.
Description
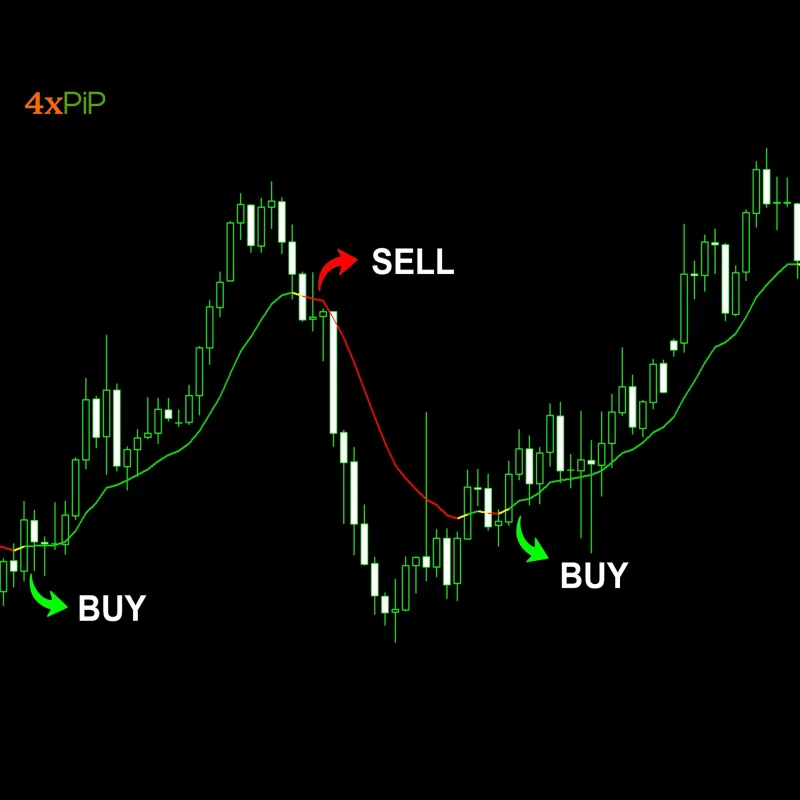
What is MA Dot Indicator? Moving Average Dot Indicator is a useful tool for traders. Instead of using lines on charts like traditional moving averages, this indicator uses dots directly on chart to show trends. Green dots mean an upward trend, indicating a positive momentum in price, while red dots mean a downward trend, suggesting a negative pressure. Moreover, color-coded system makes it easy to identify trends. Green is good for buying, and red is a signal to consider selling. When dots change from red to green, it’s a potential buying opportunity, and when they change from green to red, it’s a potential selling opportunity. This indicator not only helps identify trends but also gives signals for making trades. When dots shift from red to green, it suggests a good time to buy, and when they shift from green to red, it suggests a good time to sell.
Identifying Market Trends Using Moving Average Dot Indicator:
To figure out market trends with the Moving Average Dot Indicator, you look at how prices are moving. This tool helps traders by showing visual cues to analyze price changes. It’s meant to make it easier for traders to see and understand trends in the market, giving a different view compared to regular moving averages.
Visual Representation of Trends: Utilizing a distinctive color scheme, the indicator employs green dots to signify uptrends and red dots to indicate downtrends, enhancing the clarity of trend identification.
Real-time Dynamics: The indicator provides a real-time depiction of trend shifts through transitions between green and red dots, empowering traders with timely insights into market sentiment changes.
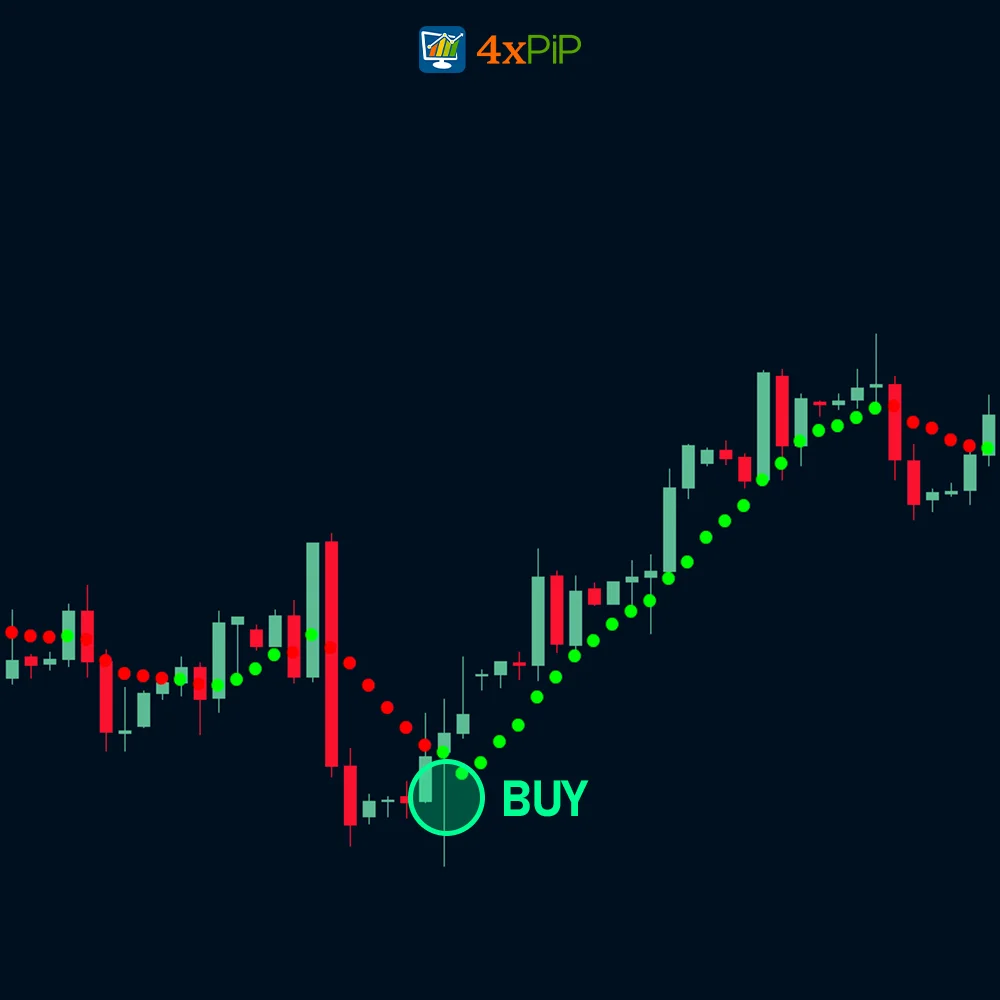
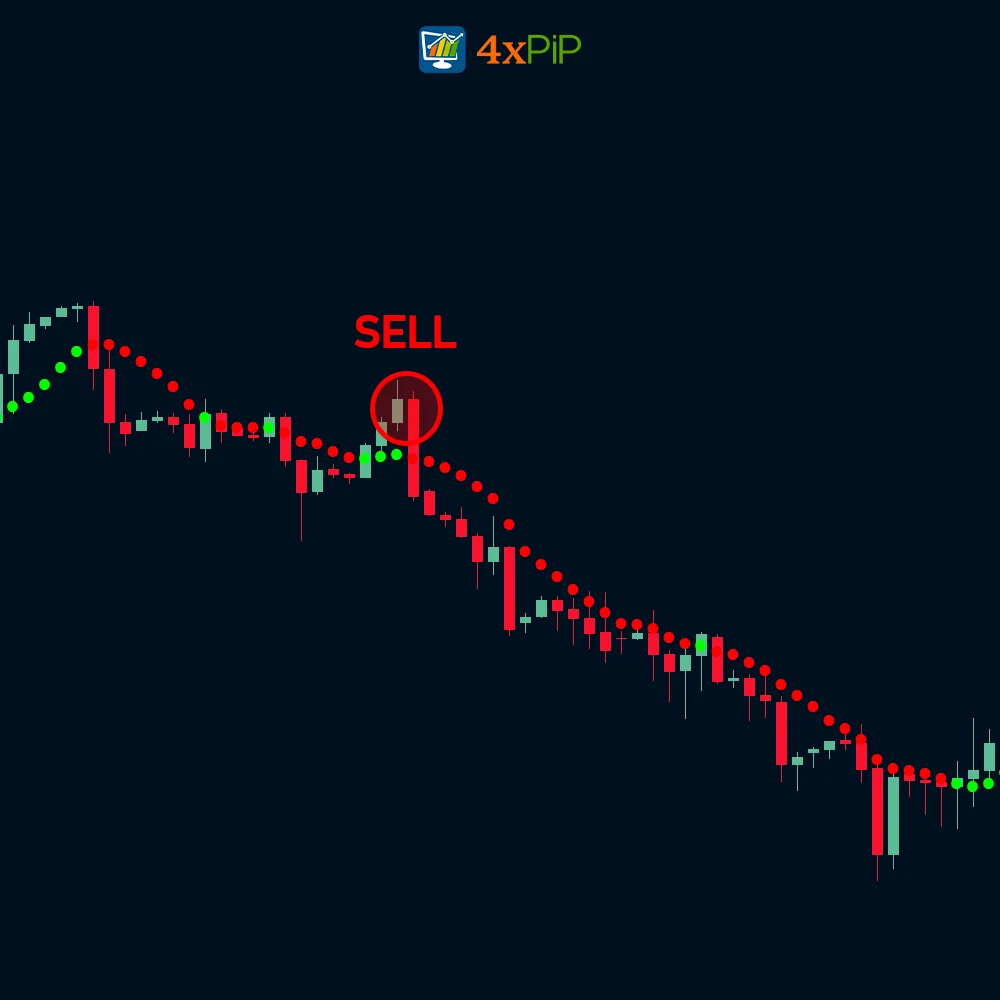
Identifying Trading Opportunities: Transitions from red to green dots present potential opportunities for initiating buy trades, signaling a shift from a bearish to a bullish trend. Conversely, transitions from green to red dots indicate potential opportunities for sell trades, highlighting a shift from a bullish to a bearish trend.
Managing Trades with the Indicator: The Moving Average Dot Indicator not only aids in trade initiation but also guides traders in managing positions. For buy trades, entering when dots turn red to green and exiting when they shift from green to red is optimal.
Versatility in Trade Management: The indicator’s adaptability extends to various aspects of trading strategies, including “order close and opposite signal” phenomenon, providing a solution for trade management.
Application in Different Market Phases: Traders can seamlessly integrate the indicator into their approach, making it a valuable tool for navigating different market phases and making well-informed decisions.
Formula:
Dot Above Price if SMA > Price
Dot Below Price if SMA < Price
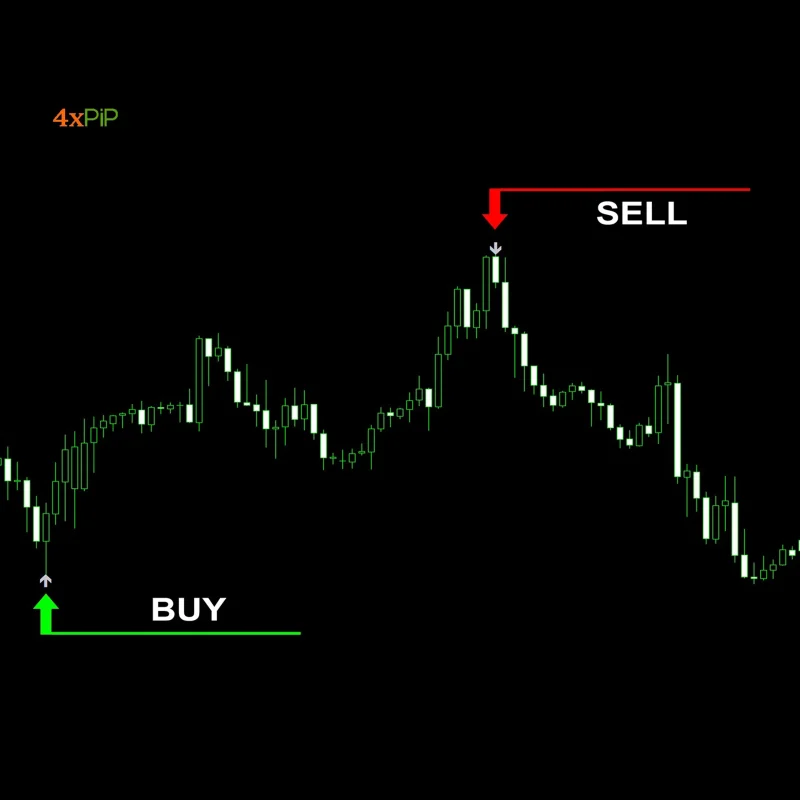
How to Trade with Moving Average Dot Indicator?
Using the Moving Average Dot Indicator in trading requires a clear plan. Understand that the green dots mean an uptrend (good for buying), while red dots mean a downtrend (consider selling). Install and set up the indicator on your trading platform. Pay attention to changes from red to green dots or vice versa—they signal potential buying or selling opportunities. For Instance, When the dots turn green from red it is a potential opportunity for a buy trade and when the dots turn red from green it is an opportunity for a sell trade. Lastly, manage risks by setting stop-loss and take-profit levels.
Features:
Moving Average Dot Indicator is helpful for traders to understand market trends easily. It uses green dots for upward trends and red dots for downward trends. This visual approach makes it simple to decide when to make trades. Green dots mean prices are going up(good time for buy), while red dots mean prices are going down(time to sell).
- Visual Trend Representation: It utilizes green and red dots for clear visual representation of market trends directly on chart.
- Color-Coded System: Green dots indicate uptrend, signaling positive momentum for potential buying opportunities, while red dots signify downtrend, suggesting negative pressure for potential selling opportunities.
- Real-Time Dynamics: It provides real-time insights into market sentiment changes through immediate transition between green and red dots.
- Timely Trading Signals: Transitions from red to green dots present opportunities for initiating buy trades, indicating shift from bearish to bullish trend. Conversely, transitions from green to red dots indicate potential opportunities for sell trades.
- Trade Management Guidance: It not only helps in initiating trades but also guides traders in managing positions effectively. For buy trades, entering when dots turn from red to green and exiting when they shift from green to red.
- Versatility in Trade Management: It‘s adaptability extends to various aspects of trading strategies, including “order close and opposite signal” phenomenon, offering flexible solution for trade management.
- Application in Different Market Phases: Traders can integrate indicator into their approach, making it valuable tool for navigating different market phases and making well-informed decisions.
- Identification of Trend Phases: Distinctive color scheme, with green/red dots for uptrends/downtrends, enhances identification of different trend phases.
- SMA-Based Calculation: The formula is based on SMA, providing effective method for trend analysis.
- User-Friendly Implementation: Easy installation and configuration on trading platforms make this Indicator accessible for traders.
Conclusion
In short, the Moving Average Dot Indicator is a great tool for traders in financial markets. Moreover, it uses color-coded dots to show trends, making it easy for users to understand what’s happening in the market. Also, the indicator gives real-time information, works well in different market situations, and is useful for traders of all levels. Furthermore, it helps identify trend changes quickly and gives clear signals, making trading decisions more informed and confident.
DOWNLOAD NOW Reach Us on WhatsApp
 Fly Over to Telegram
 Drop Us an Email
Settings
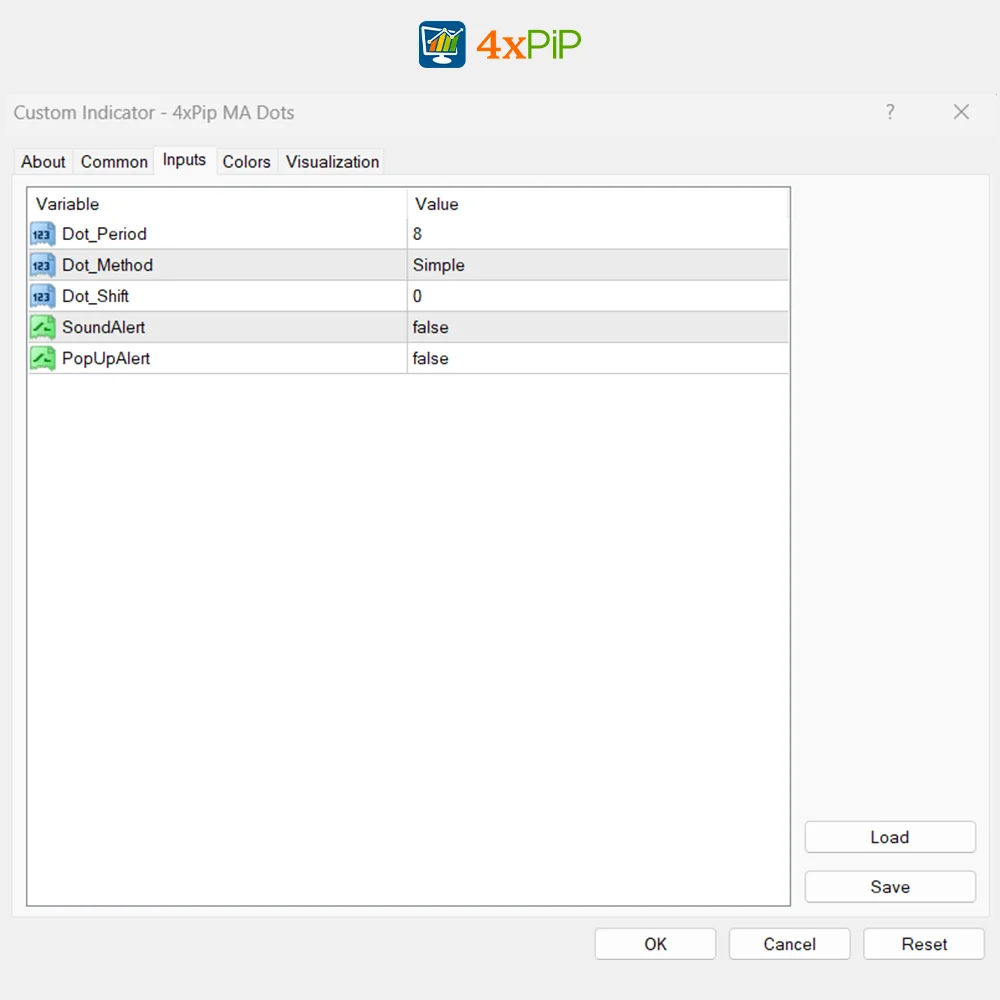
- Dot Period (value = 8) The period of the indicator. The higher is the value the more it lags but less false signals appear.
- Dot Method ( value = simple) Determines the methods for the indicator
- Dot Shift (value = 0) shifts indicator display horizontally.
- MA Price (default = PRICE_CLOSE) price type to use in calculations.
- SoundAlert (value = False) This is a sound notification
- PopUpAlert (value = False) A popup notification
41 reviews for Moving Average Dot Indicator for MetaTrader 4 – Download Now!
| 5 star | 48% | |
| 4 star | 51% | |
| 3 star | 0% | |
| 2 star | 0% | |
| 1 star | 0% |
Q & A
It's formula is based on Simple Moving Average(SMA), providing straightforward method for trend analysis on the price charts.
Yes, traders have the flexibility to customize the indicator, including adjusting sensitivity, selecting specific types of patterns, and more.
The Moving Average Dot Indicator provides real-time insights into market sentiment changes, allowing traders to adapt to evolving market conditions.
Yes, the user-friendly implementation and clear visual representation make it accessible for traders at all levels of experience.
It's adaptability extends to various trading strategies, including "order close and opposite signal" phenomenon, offering flexibility in trade management.


Martingale EA is effective, but the emphasis on a 100% winning rate may mislead some traders. Use it cautiously, and it can be a valuable tool in your trading strategy.
Impressive EA with a solid strategy. The intelligent forex calculator is a game-changer. My drawdown issues have significantly reduced. Still, remember to use it wisely and manage your risks.
Martingale EA can be effective, but it’s not a one-size-fits-all solution. It requires careful risk management. The 100% winning rate claim should be taken with a grain of salt.
The EA is effective, but caution is key. The 100% winning rate claim might be a bit exaggerated. Nonetheless, it’s a valuable tool if used with a solid risk management plan.
Martingale Forex EA is effective, but the 100% winning rate claim is a bit too optimistic. It’s crucial to manage expectations and use the EA as a part of a comprehensive trading strategy.