
Keltner Channel for Beginners by William210 – Best Keltner Channel MT5 Indicator FREE
$0.00
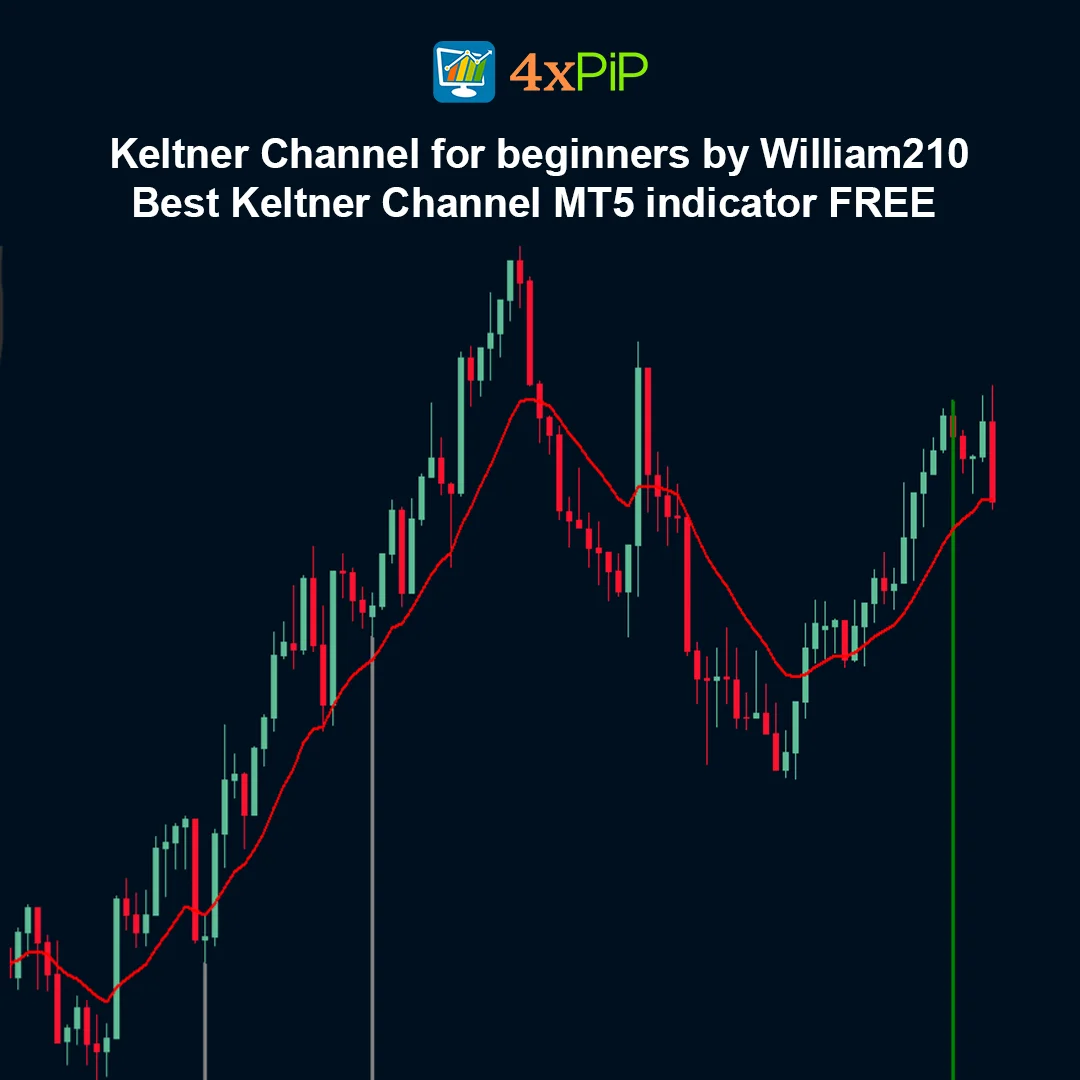
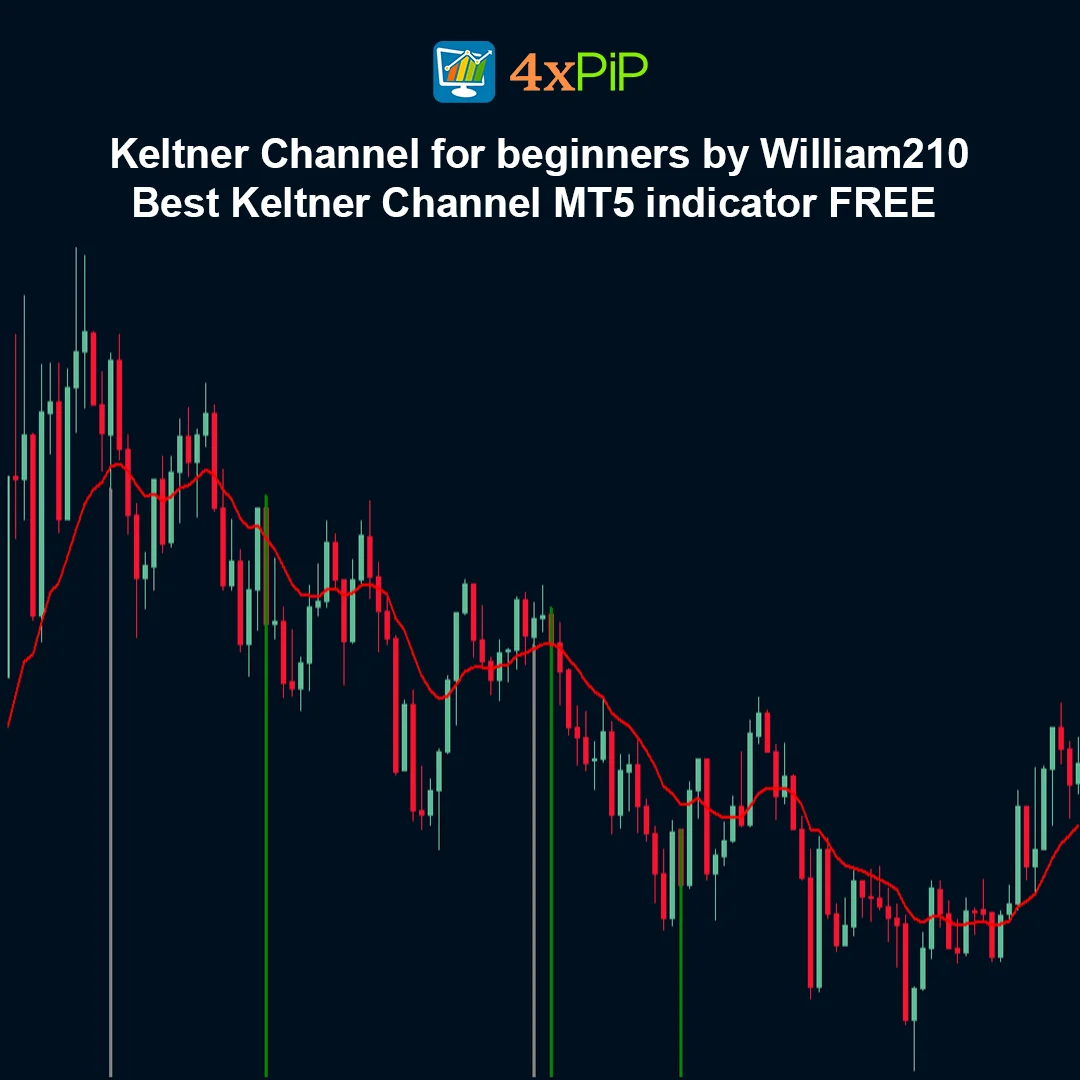
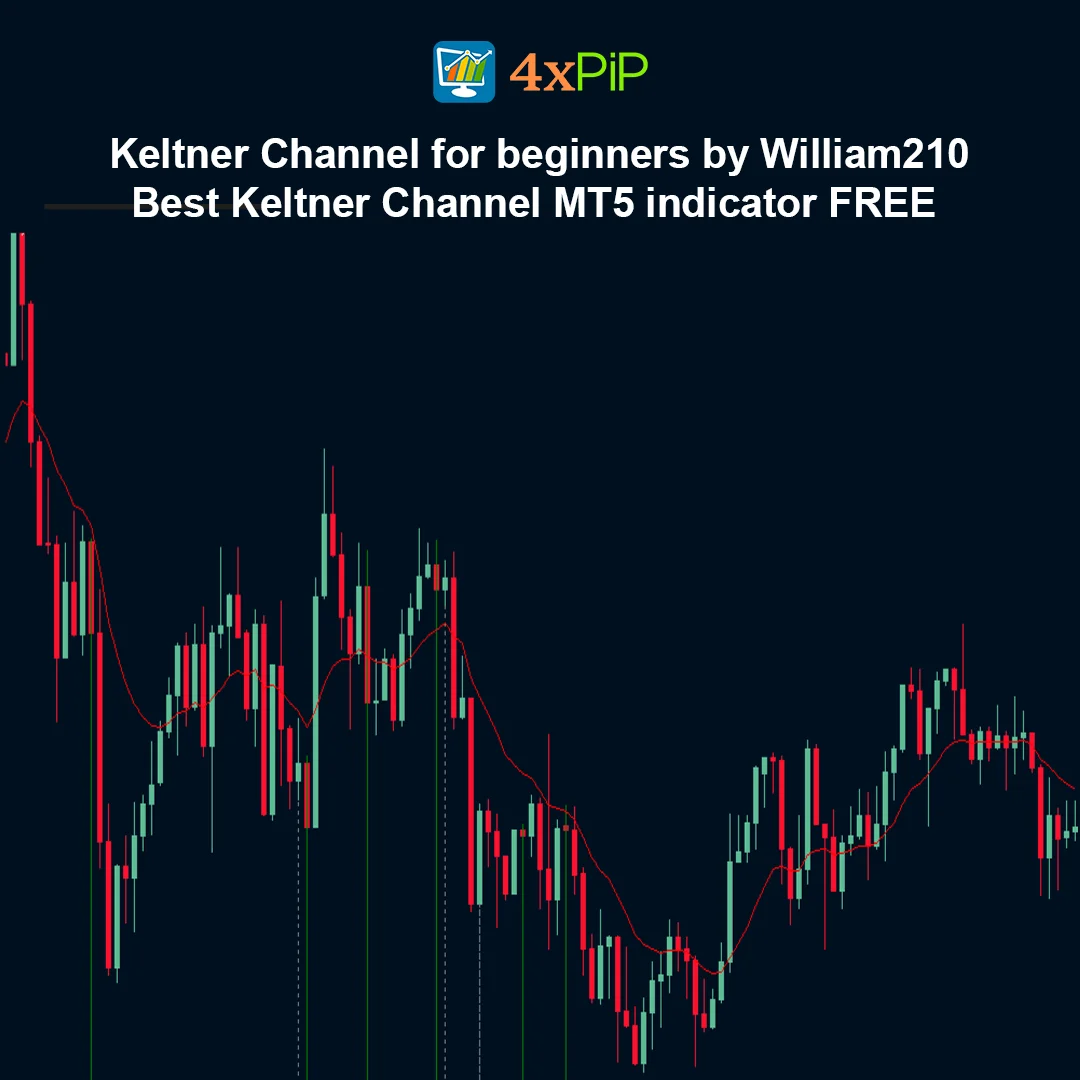
The Keltner Channel for Beginners by William210 is a simple and effective volatility-based indicator designed for the MetaTrader 5 platform. Based on the classic Keltner Channel concept, this indicator helps traders identify market trends, price volatility, and potential breakout opportunities.
The Keltner Channel consists of three lines: an upper band, a lower band, and a middle line. The middle line is typically calculated using a moving average, while the upper and lower bands are derived from volatility measurements such as the Average True Range (ATR). These bands create a channel around price action, helping traders identify dynamic support and resistance levels.
This beginner-friendly version created by William210 is designed to make the Keltner Channel easier to understand and apply in trading strategies, making it suitable for both new traders and experienced market participants.
Description
What is the Keltner Channel for Beginners indicator?
The Keltner Channel for Beginners indicator is a technical analysis tool that plots a volatility-based channel around price movements. It helps traders visualize market trends and identify potential breakout or reversal zones.
Who created the Keltner Channel?
The Keltner Channel was originally introduced by Chester W. Keltner. The modern version of the indicator was later refined by technical analysts using moving averages and the Average True Range to measure volatility.
How does the indicator work?
The indicator calculates a moving average as the center line and adds upper and lower bands based on market volatility. These bands expand during high volatility and contract when the market is calm.
What do the channel bands represent?
The upper band represents potential resistance levels where price may face selling pressure, while the lower band represents potential support levels where buying pressure may appear.
Why is the Keltner Channel useful?
The Keltner Channel helps traders identify trends, measure volatility, and locate possible breakout areas. It provides a clear visual framework for analyzing price movements.
Who can use this indicator?
The indicator is suitable for both beginner and experienced traders who want to incorporate volatility analysis into their trading strategies.
Advantages
- Simple and easy-to-understand channel indicator.
- Helps identify market trends clearly.
- Measures price volatility effectively.
- Provides dynamic support and resistance levels.
- Useful for breakout and trend-following strategies.
- Works across multiple financial markets.
- Compatible with all MetaTrader 5 timeframes.
- Beginner-friendly design.
- Can be combined with other technical indicators.
- Completely free indicator for MetaTrader 5 users.
Features
- Classic Keltner Channel calculation method.
- Displays upper, lower, and middle channel lines.
- Uses moving averages and volatility calculations.
- Helps identify breakout opportunities.
- Works on all chart timeframes.
- Compatible with all instruments available in MetaTrader 5.
- Lightweight and optimized for platform performance.
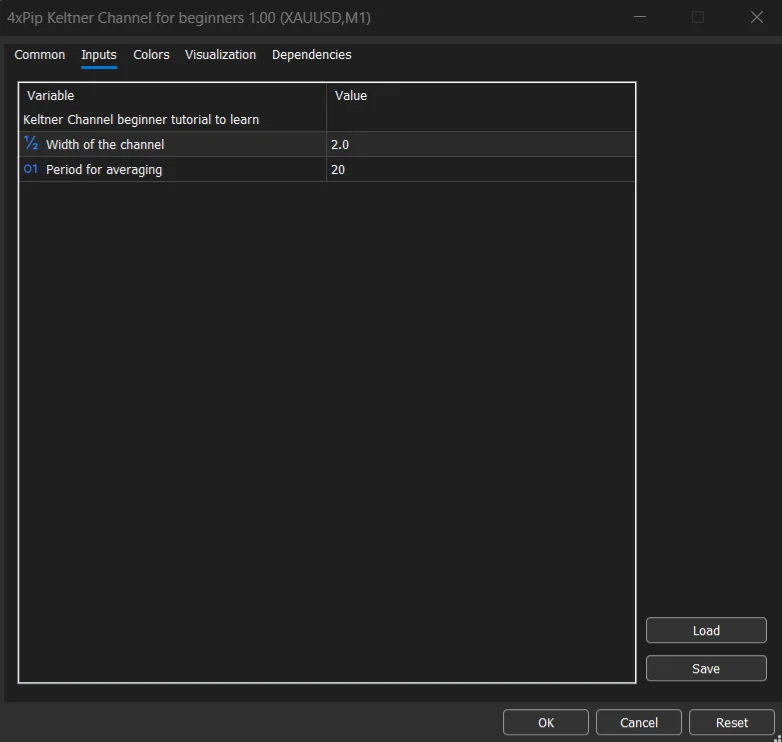
- Customizable channel settings.
- Clear visual representation of price volatility.
- Suitable for trend and volatility-based trading strategies.
How to Trade
The Keltner Channel indicator is commonly used to analyze trends and identify breakout opportunities. When the price moves near or above the upper channel band, it may indicate strong bullish momentum, and traders may consider buying opportunities during pullbacks. When the price approaches the lower band, it may signal bearish momentum and traders may look for selling opportunities. Breakouts outside the channel bands can also indicate strong market moves, especially when supported by increasing volatility. Traders often combine the Keltner Channel with momentum indicators, moving averages, or support and resistance analysis to confirm trading signals.
Formula
The Keltner Channel is calculated using the following structure:
Middle Line = Exponential Moving Average (EMA)
Upper Band = EMA + (ATR × Multiplier)
Lower Band = EMA − (ATR × Multiplier)
Where:
- EMA — Exponential Moving Average of price
- ATR — Average True Range used to measure volatility
- Multiplier — Adjustable factor that controls the channel width
Conclusion
The Keltner Channel for Beginners by William210 is a practical and easy-to-use indicator that helps traders analyze trends and market volatility. By displaying a dynamic channel around price movements, it allows traders to identify potential breakout levels and trading opportunities more effectively. Its simple design and clear visualization make it a valuable tool for traders using the MetaTrader 5 platform.
DOWNLOAD NOW Reach Us on WhatsApp
 Fly Over to Telegram
 Drop Us an Email
FAQ's
Q & A
Related products
-
 Free
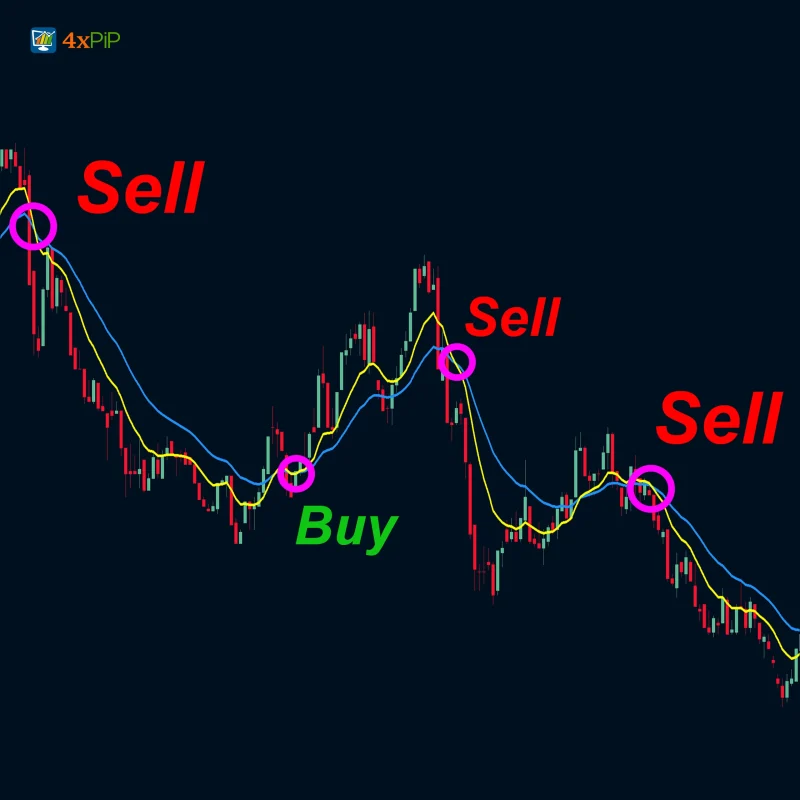
FreeMT5 EA Moving Average Crossover
Original price was: $100.00.$20.00Current price is: $20.00. Select options -
 Free
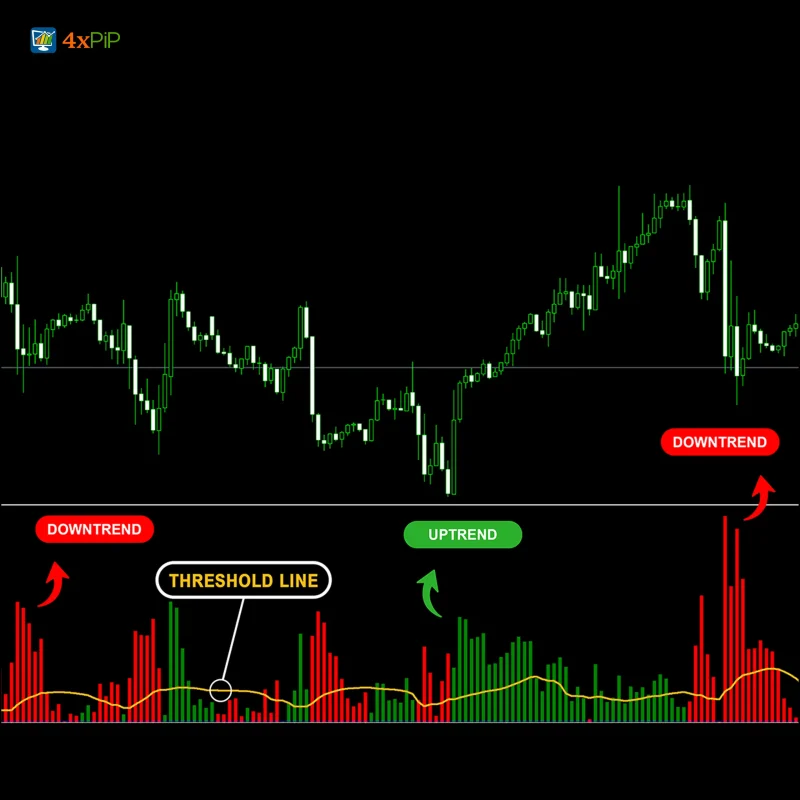
FreeMT5 Waddah Attar Explosion Indicator
$0.00 Select options -
 Free
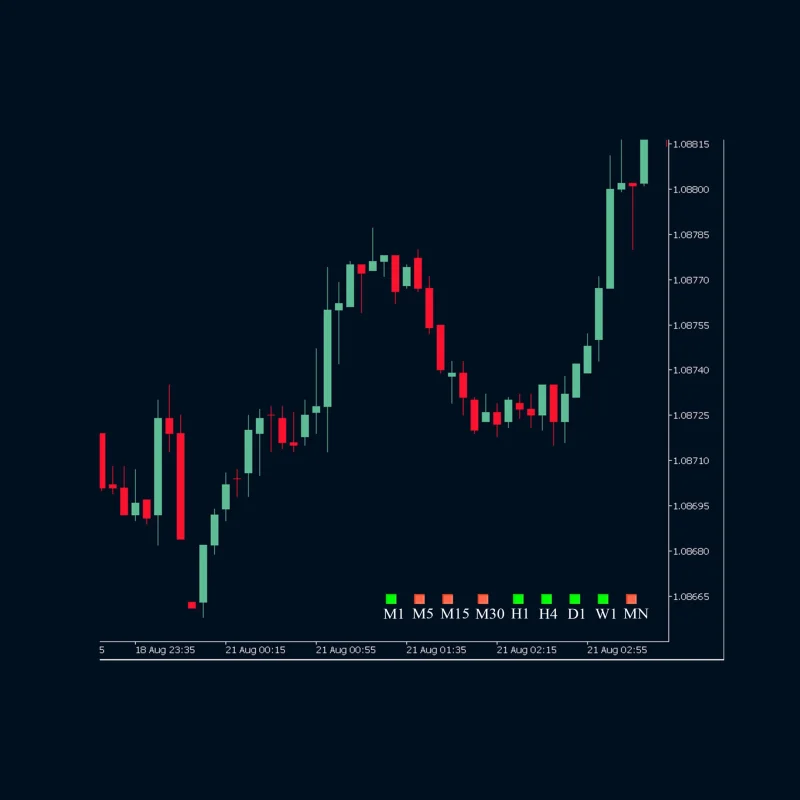
FreeMT5 Indicator MTF bar detector
$0.00 Select options -
 Premium
MT5 License System for Trading bots EA
Original price was: $199.00.$99.00Current price is: $99.00. Select options
Reviews
There are no reviews yet