
Accurate Swing High Low Indicator for MetaTrader 4 – Free Download
$0.00
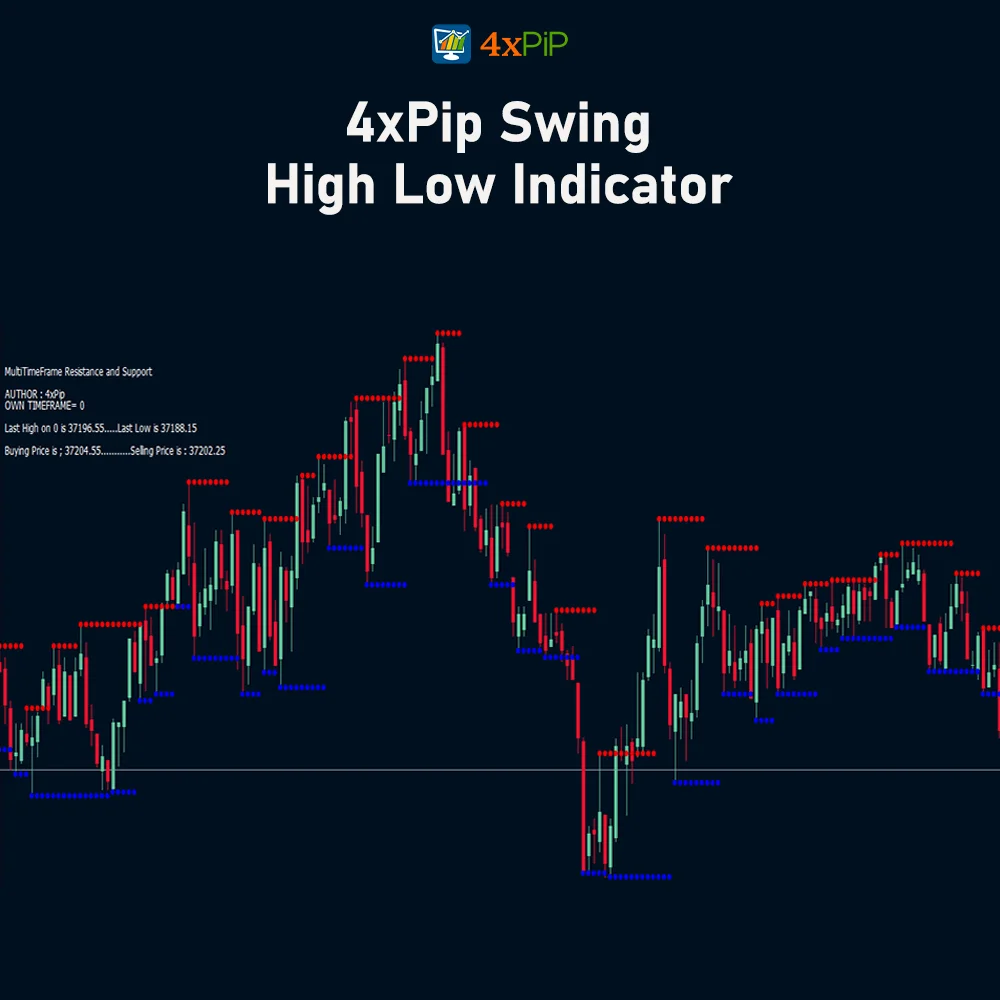
Swing High Low Indicator is an amazing tool that assists traders in making informed decisions by giving a brief overview of the last highs and lows of the market along with buying and selling prices using swing highs and swing lows.
Description
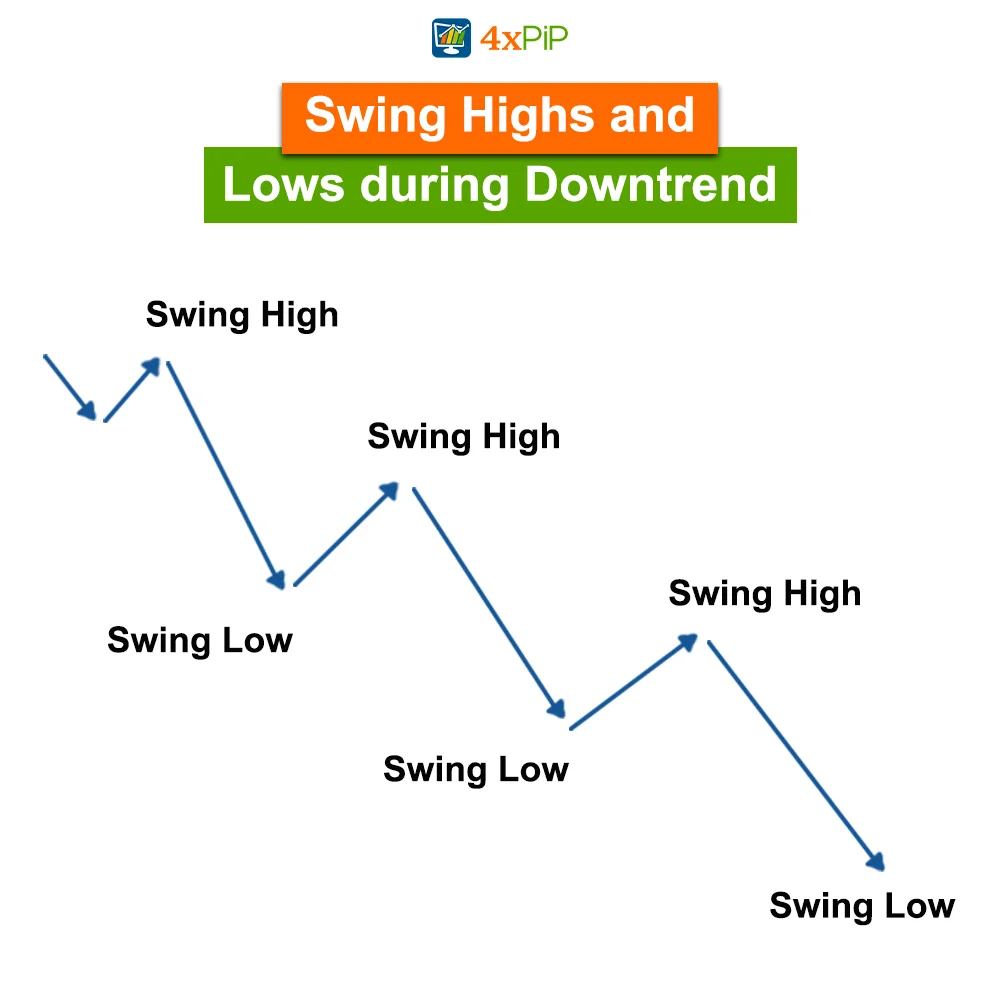
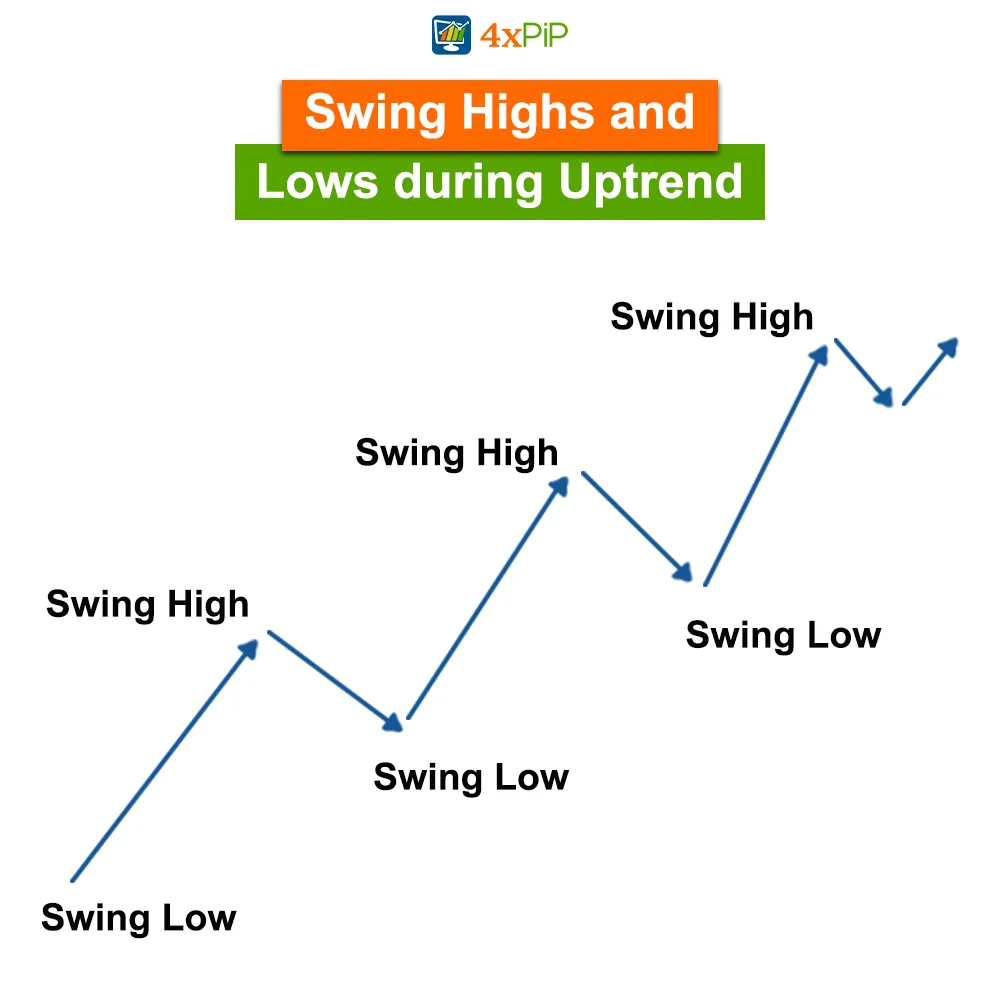
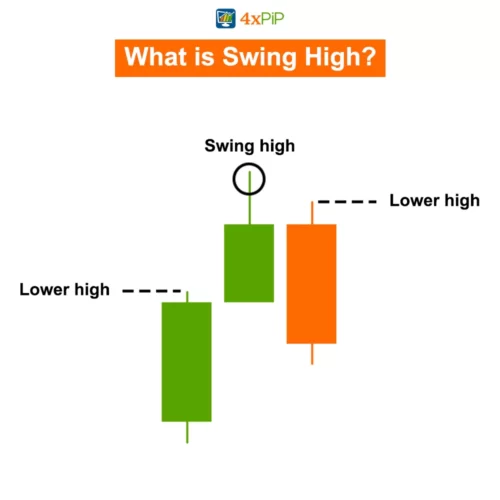
What is Swing High? A swing high is like the very top point of a roller coaster ride in the stock market. In simple terms, it’s when price of stock/investment reaches its highest point during certain time (less than 20 trading periods). Imagine it as the crest of a wave. To find a swing high, just look for a moment when the price is higher than all the other prices around it, depending on the timeframe you’re looking at, like the highest price in the last month on a daily chart. Swing highs are crucial for traders, especially those using swing trading strategies, as they help spot potential changes in trends and how volatile market might be.
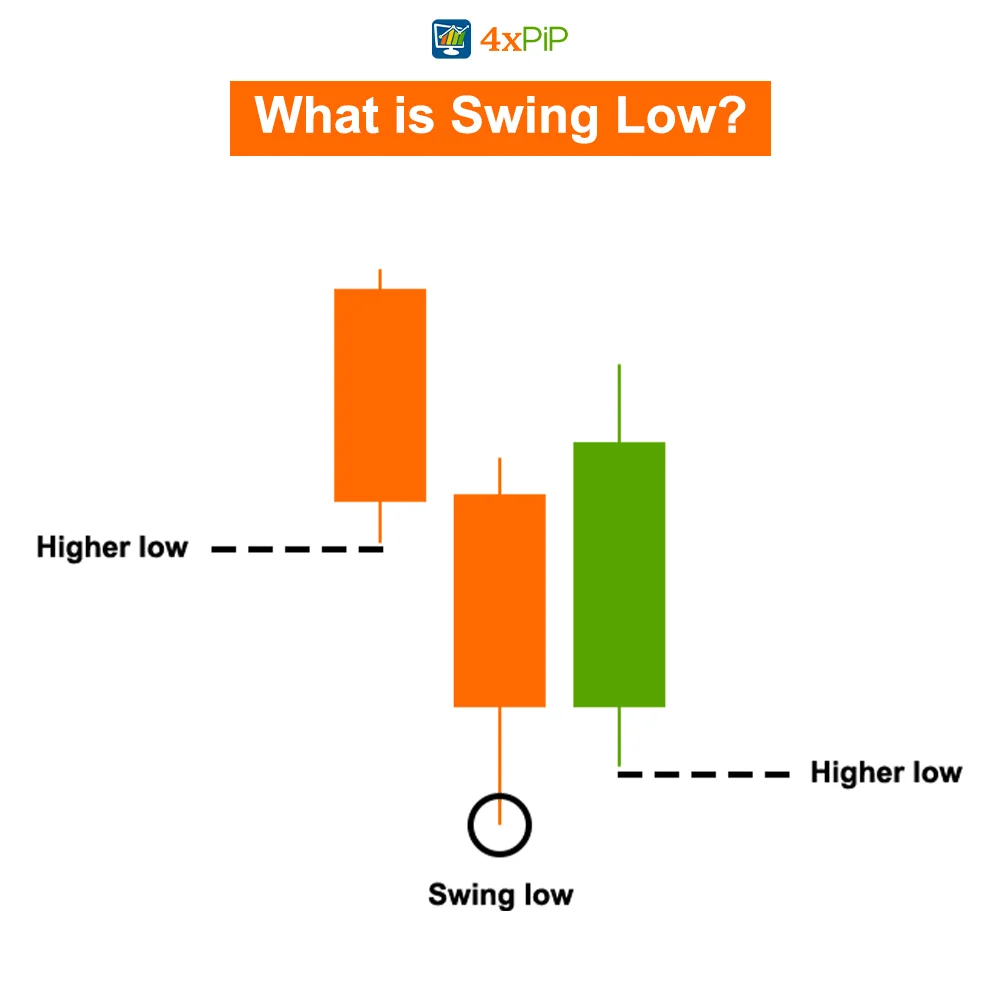
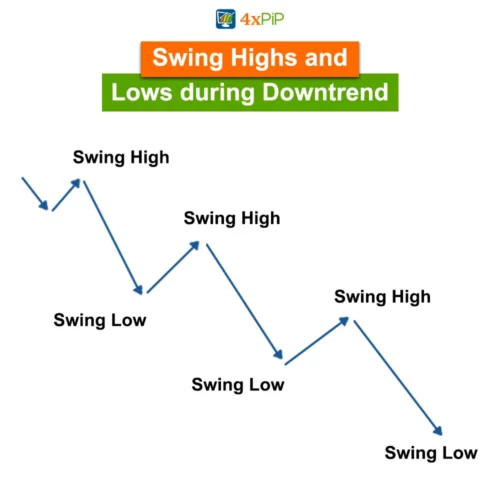
What is Swing Low? A swing low is like the lowest dip in a roller coaster ride of stock prices. It’s the lowest point the price reaches during a specific time, typically less than 20 trading periods. Picture it as the lowest point in a wave. To identify a swing low, just find a moment when the price is lower than any other nearby prices, depending on the timeframe you’re checking, like the lowest price in the last month on a daily chart. Swing lows are super important for traders, especially those using swing trading strategies. They help in figuring out where the market might is heading and how much it might go up or down. The swing low is the noticeable dip in prices, with its partner being the swing high, marking peak in prices.

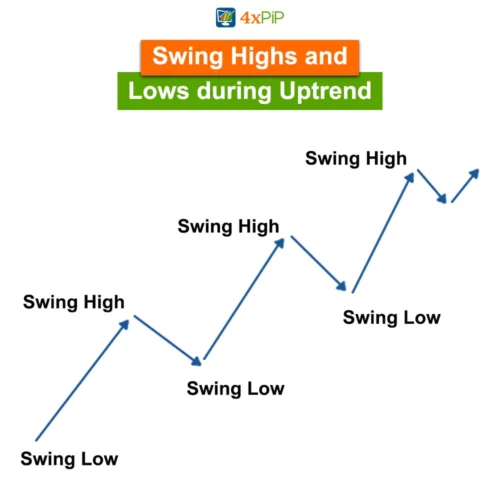
The Swing High-Low indicator is like a helpful guide for people trading stocks or investments. It helps you see the highest points (Swing High) and lowest points (Swing Low) of prices during a certain time. Imagine it as a tool that marks the top of a roller coaster ride(Swing High) and the bottom dip(Swing Low). Traders use it to understand when prices might change direction and where they might go up or down. Lastly, this indicator is great for figuring out trends and making smart decisions about buying or selling stocks. It’s like a simple map that shows you the exciting highs and lows of the market.
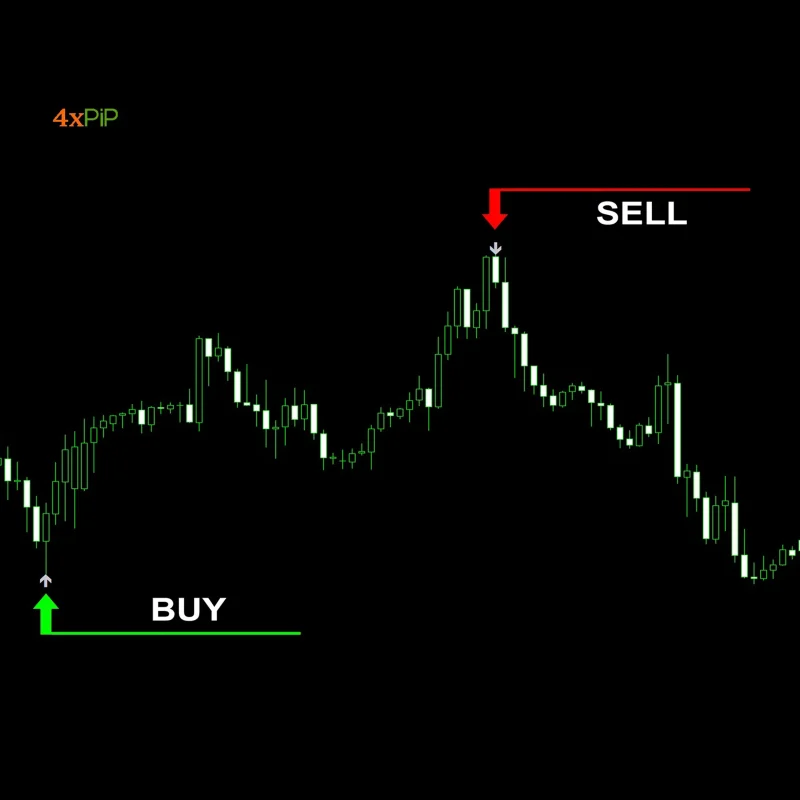
How to Trade?
Open the sell trade at swing high and close it on swing low. For opening buy trade, open it on at swing low. The buy trade is closed at swing high. In short, the trade is closed at opposite signals. It’s better to keep stoploss according to risk-to-reward ratio, you can also set it according to opposite to trade opening. Also, the previous swing highs and swing lows can also be used as the stoplosses and takeprofits.
Features:
The Accurate Swing High-Low Indicator boasts several key features that enhance its utility in technical analysis and trading strategies:
- Precise Trend Reversal Identification: It pinpoints precise swing highs and lows, aiding traders in identifying potential trend reversals with accuracy.
- Timeframes Adaptability: It’s adaptable across various timeframes, allowing traders to apply it to different chart intervals-daily, hourly, or shorter periods.
- Visual Clarity: With clear visual representation, Swing High-Low Indicator provides an easy-to-read display of swing highs and lows on the price chart, making it accessible for traders of all experience levels.
- Customizable Parameters: Moreover, traders can customize indicator’s parameters for specific trading preferences, providing flexibility in adapting to diverse market conditions.
- Integration with Trading Strategies: Integration into different trading strategies provides valuable insights into trend shifts and helps in informed decision-making.
- Historical Data Analysis: Allows traders analyze historical swing highs/lows, offering comprehensive view of price action and enabling informed trading strategies.
- Real-time Alerts: It comes with real-time alert features, notifying traders when significant swing high-low is identified, allowing for timely decision-making.
- Interface: Also, 4xPip Swing High-Low Indicator features user-friendly interface, ensuring that traders easily interpret and apply information provided by indicator.
- Risk Management: By identifying swing highs-lows, indicator contributes to improved risk management as traders make well-informed decisions on entry/exit points.
- Backtesting Capabilities: Lastly, traders may benefit from backtesting capabilities, enabling them to assess indicator’s performance based on historical data, thereby validating its effectiveness in different market conditions.
These features collectively position the Accurate Swing High-Low Indicator as a valuable tool for traders seeking to navigate price trends, identify potential reversals, and make strategic decisions in the dynamic financial markets.
Conclusion:
In summary, the 4xPip Accurate Swing High-Low Indicator is a helpful tool for traders. It accurately spots trend changes, works on different timeframes, and is adjustable to fit personal preferences. With a clear display and user-friendly design, it’s accessible to all traders. It not only integrates with various trading strategies but also provides historical data analysis and real-time alerts for timely decision-making. Moreover, its risk management features and backtesting capabilities add to its reliability. Furthermore, 4xPip Accurate Swing High-Low Indicator is valuable asset, offering insights into market trends, risk management, and strategy optimization.
DOWNLOAD NOW Reach Us on WhatsApp
 Fly Over to Telegram
 Drop Us an Email
Settings
- Show information: True => Indicator Swing High and Low will show the information on the chart. False => Indicator will Not show any information on the chart.
- Timeframe: Adjust the timeframe for Swing High Low lines. You can select any timeframe such as 1 Min, 5 Min, 15 Min, 30 Min, 1 Hour, 4 Hour, 1 Day, 1 Week, and 1 month.
20 reviews for Accurate Swing High Low Indicator for MetaTrader 4 – Free Download
| 5 star | 50% | |
| 4 star | 50% | |
| 3 star | 0% | |
| 2 star | 0% | |
| 1 star | 0% |
Q & A
Yes, the indicator's user-friendly interface and visual clarity make it accessible for traders of varying experience levels, providing valuable insights into market trends and reversals.
By identifying Swing Highs and Lows, it helps traders make well-informed decisions on entry/exit points, contributing to enhanced risk management.
Yes, the indicator often comes with customizable parameters, allowing traders to align it with their specific trading styles and objectives.
Experts advise traders to open sell trades at Swing High and close them at Swing Low. For buy trades, they open at Swing Low and close at Swing High, aligning with opposite signals for effective decision-making.
The indicator serves as a guide, showing traders the highest(Swing High) and lowest(Swing Low) points of prices during certain time. It aids in understanding potential changes in price direction.
Related products
-
 Free
FreeMT4 EA Drawdown Limiter
Original price was: $100.00.$10.00Current price is: $10.00. Select options -
 Premium
Forex News (EA) Expert Advisor for MT4 | Economic Calendar
Original price was: $199.00.$99.00Current price is: $99.00. Select options -
 Free
FreeMT4 Waddah Attar Explosion Indicator
$0.00 Select options -
 Free
FreeMT4 Quantum Pro Indicator
$0.00 Select options
Martingale Forex EA is a powerful tool, especially for navigating volatile markets. The 100% winning rate is a bit optimistic, but with proper risk management, it can be a game-changer.
Martingale Forex EA is effective, but don’t let the 100% winning rate claim lull you into complacency. It’s a tool, not a guarantee. Use it wisely, and it can enhance your trading.
Martingale Forex EA is effective, but the 100% winning rate claim is a bit too optimistic. It’s crucial to manage expectations and use the EA as a part of a comprehensive trading strategy.
Martingale EA is a gem in the Forex world. The Takeprofit feature is spot-on, and the counter trades work wonders. My trading has become more profitable and less stressful.
The EA is effective, but caution is key. The 100% winning rate claim might be a bit exaggerated. Nonetheless, it’s a valuable tool if used with a solid risk management plan.