Stochastic Threads | Rainbow Stochastic Ribbon Multi lines Stochastic MTF Advanced indicator for MT4 FREE
$0.00
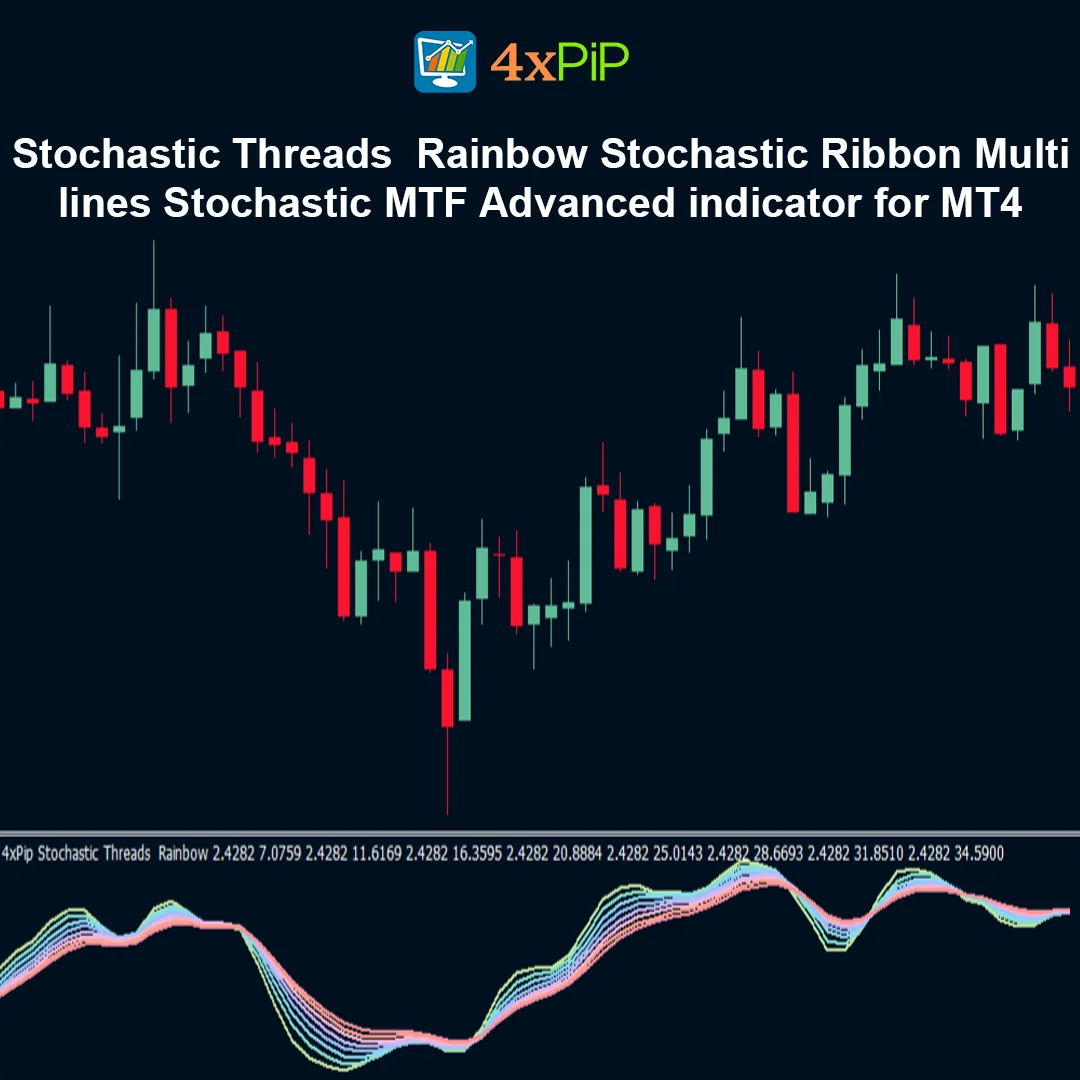
The Stochastic Threads / Rainbow Stochastic Ribbon indicator for MetaTrader 4 is an advanced multi-timeframe momentum oscillator that displays multiple stochastic signals across different periods and timeframes in a single sub-window. By creating a ribbon or rope-like visualization of several stochastic lines, it allows traders to identify trend strength, momentum alignment, and potential trend reversals more effectively than using a single stochastic indicator.
Description
What is the Stochastic Threads / Rainbow Stochastic Ribbon indicator?
The Stochastic Threads or Rainbow Stochastic Ribbon is an advanced version of the traditional Stochastic Oscillator. Instead of displaying only two lines (%K and %D), this indicator plots multiple stochastic signals from different settings or timeframes in one window. These lines create a colorful ribbon-like visualization that helps traders see how momentum behaves across several market speeds simultaneously. This layered view allows traders to understand market structure and detect potential trend reversals earlier.
How does the multi-timeframe stochastic system help traders?
The multi-timeframe (MTF) feature allows traders to observe momentum from higher timeframes while trading on a lower timeframe chart. For example, a trader analyzing a 15-minute chart can also see the momentum direction of 1-hour or 4-hour stochastic signals without switching charts. When multiple timeframes align in the same direction, the trend signal becomes stronger. This alignment helps traders avoid weak trades and focus on high-probability opportunities.
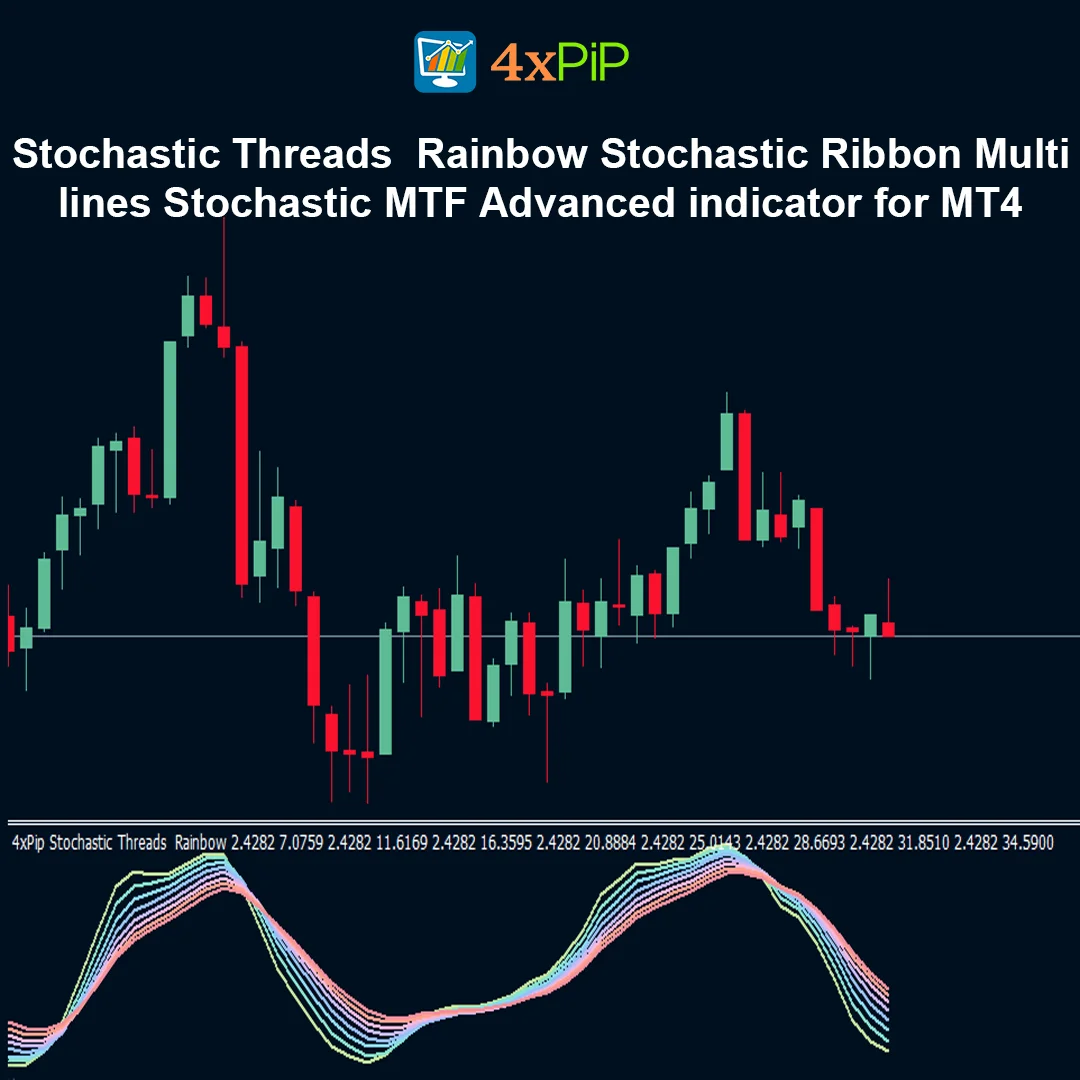
What does the rainbow ribbon visualization show?
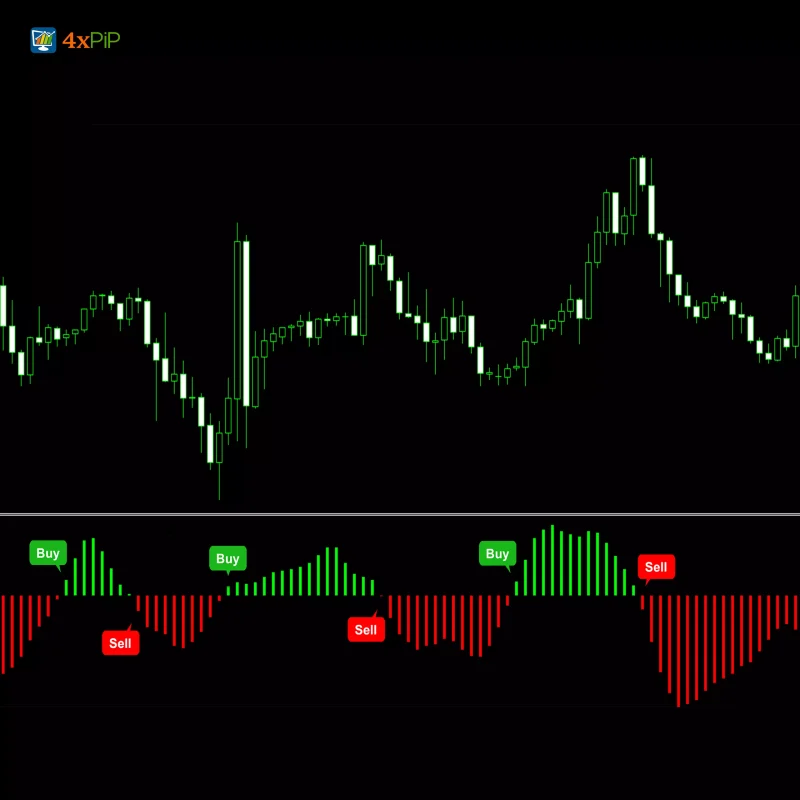
The ribbon visualization shows how different stochastic lines interact with each other. When the lines are tightly grouped, it usually means the market is ranging or consolidating. When the lines spread apart and move in one direction, it signals strong momentum and a potential trending market. Traders often monitor these patterns to identify trend initiation, continuation, or exhaustion phases.
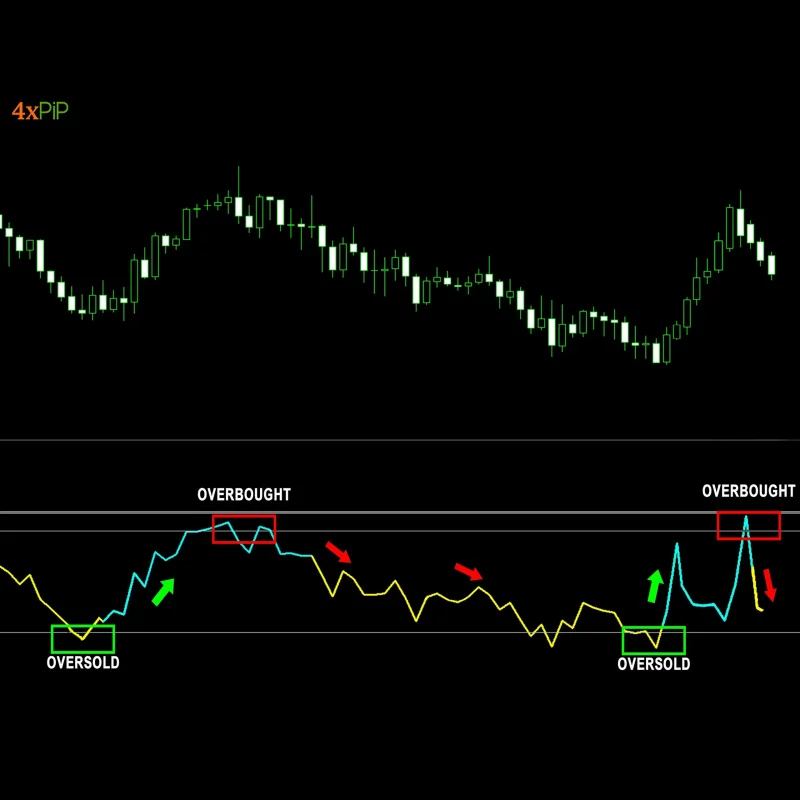
How do alerts and color-coded zones improve trading signals?
Many advanced versions of the indicator include alerts and color-coded overbought or oversold zones. When stochastic lines enter the overbought zone above 80 or the oversold zone below 20, the indicator highlights these conditions visually. Some versions also provide sound alerts, push notifications, or email alerts when certain conditions occur, such as line crossovers or multi-timeframe alignment. These features help traders react quickly to potential market opportunities.
Advantages
- Displays multiple stochastic signals simultaneously.
- Supports multi-timeframe momentum analysis.
- Helps identify trend strength and reversals.
- Provides clear rainbow ribbon visualization.
- Reduces the need to switch between different timeframe charts.
- Detects overbought and oversold conditions effectively.
- Includes optional alerts and notifications.
- Helps filter out weak trading signals.
- Suitable for various trading styles including scalping and swing trading.
- Fully compatible with MetaTrader 4 platform.
Features
- Multi-timeframe stochastic analysis in one window.
- Rainbow ribbon visualization of multiple stochastic lines.
- Color-coded overbought (>80) and oversold (<20) zones.
- Optional alerts including sound, email, and push notifications.
- Ability to display multiple timeframe signals simultaneously.
- Interpolation for higher timeframe data on lower charts.
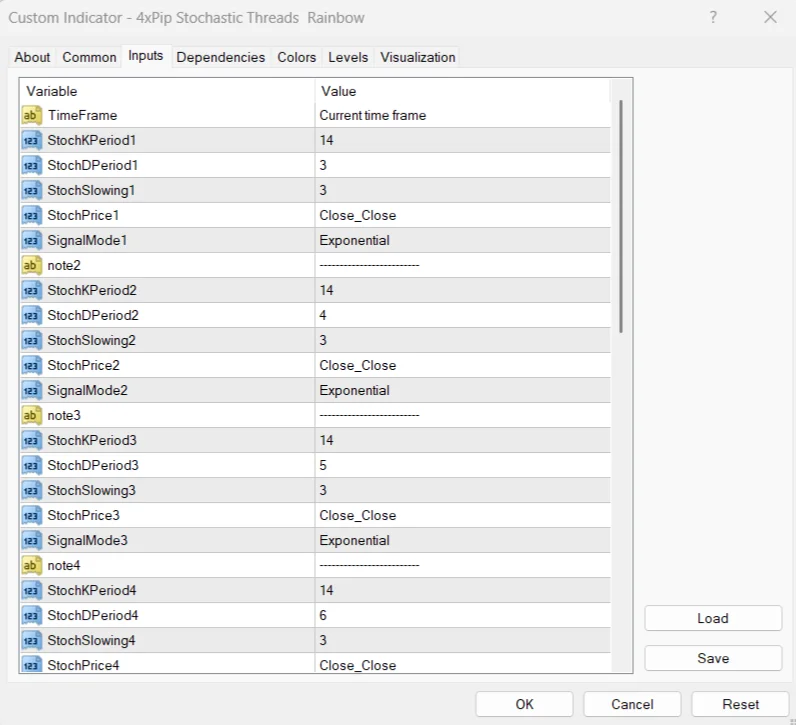
- Customizable stochastic parameters and colors.
- Dashboard-style visual analysis for momentum.
- Lightweight indicator with efficient calculation.
- Compatible with all MT4-supported markets.
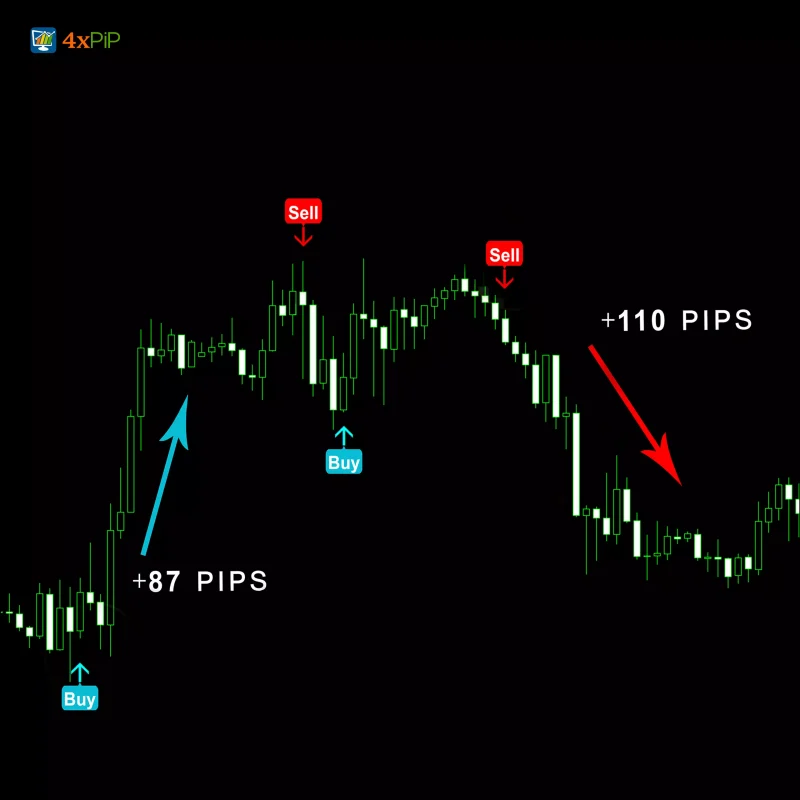
How to Trade
Apply the indicator to your chart in MetaTrader 4.Observe whether the stochastic lines are clustered together, indicating consolidation.Watch for multiple lines aligning upward, signaling bullish momentum.Watch for multiple lines aligning downward, indicating bearish momentum.Monitor when stochastic lines enter overbought (>80) or oversold (<20) zones.Enter trades when several timeframe signals align in the same direction.
Formula
The indicator is based on the stochastic oscillator calculation:
%K = (Current Close − Lowest Low) / (Highest High − Lowest Low) × 100**
Where:
Lowest Low= lowest price during the selected period
Highest High = highest price during the selected period
The Rainbow Stochastic Ribbon indicator applies this formula across multiple timeframes or stochastic settings, displaying several lines that form the ribbon visualization.
Conclusion
The Stochastic Threads / Rainbow Stochastic Ribbon indicator for MetaTrader 4 is a powerful technical analysis tool designed to enhance traditional stochastic strategies. By displaying multiple stochastic signals across different timeframes, it provides a comprehensive view of market momentum and trend behavior.
This multi-layered visualization helps traders identify trend strength, detect potential reversals, and confirm trading opportunities more accurately. As a result, the indicator is widely used by traders seeking advanced momentum analysis across Forex, stocks, and cryptocurrency markets.
DOWNLOAD NOW Reach Us on WhatsApp
 Fly Over to Telegram
 Drop Us an Email
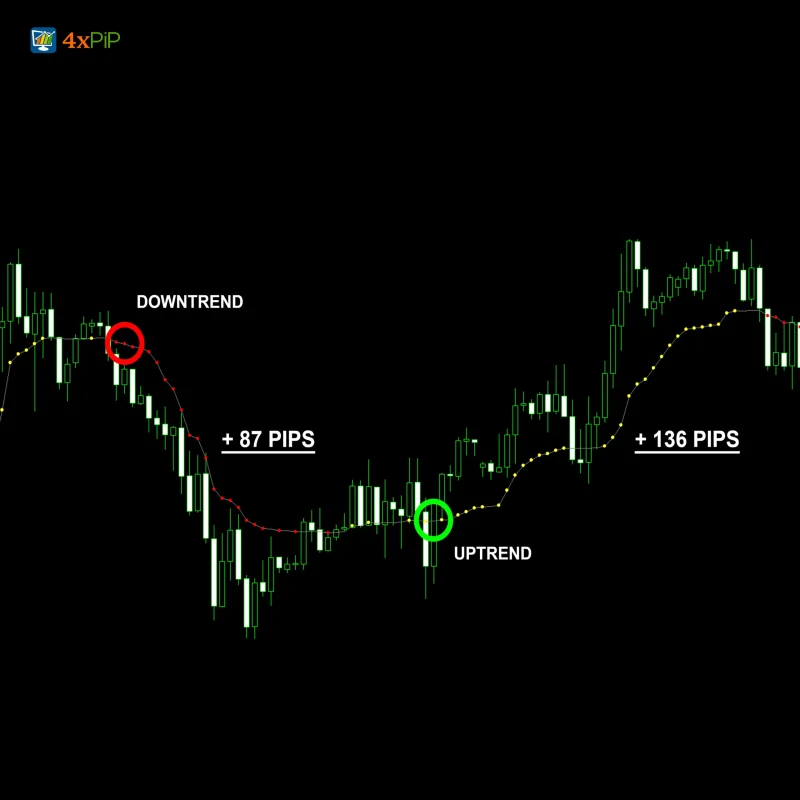
Reviews
There are no reviews yet