History based Equity and Balance Indicator | MT5 FREE Download
$0.00
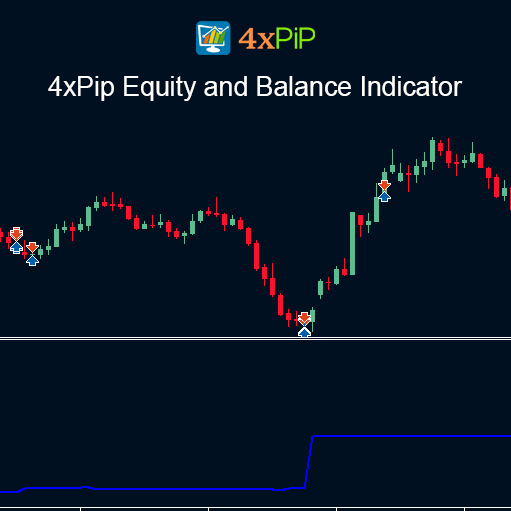
The History Based Equity and Balance Indicator for MetaTrader 5 visualizes your account’s historical equity and balance directly on the chart. It retrieves trade history and plots balance and equity curves in real-time, helping you analyze drawdowns, profit growth, and trading performance with precision.
Description
How Can You Track Your Equity and Balance History Directly on MT5 Charts?
The History Based Equity and Balance Indicator is a performance analytics tool designed for MetaTrader 5 users who want to assess their trading history with clarity. It extracts historical data from your account’s trade records and plots both equity and balance as lines on the chart. This makes it easy to visually analyze your account’s performance over time. Including equity drawdowns, growth trends, and profitability consistency.
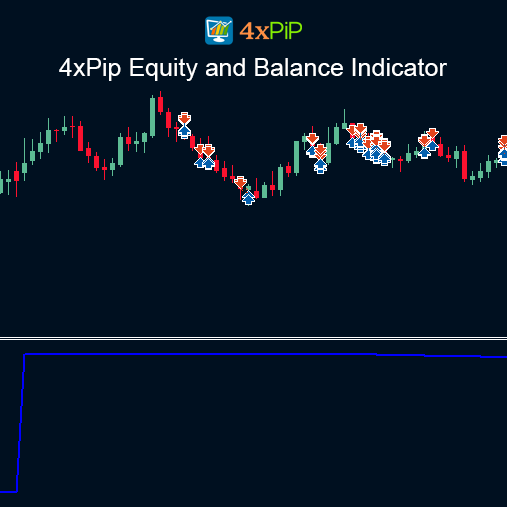
Unlike traditional reports that require switching to the MT5 “Account History” tab or exporting data to Excel, this tool brings your performance chart directly into the live trading environment. The indicator continuously updates as new trades close, giving you a clear side-by-side view of how your equity changes with your balance.
Whether you’re managing your own account or tracking a funded account’s progress, this indicator is essential for reviewing strategy effectiveness, risk exposure, and trade management decisions. It is especially valuable for prop traders, strategy testers, signal providers, and trading educators.
Features
- Balance Curve Line: Plots your account’s balance based on closed trades.
- Equity Curve Line: Reflects real equity values after each trade, including drawdowns.
- Automatic History Extraction: Reads from MT5’s internal account history.
- Customizable Display Period: Define how far back to show account history.
- Color & Style Customization: Personalize line colors, thickness, and appearance.
- Multiple Chart Display Options: Overlay on live price chart or use on separate window.
- Lightweight Execution: Designed to work fast without lag on all systems.
- No Repainting or Delays: Displays exact data from trading records without distortion.
- Compatible with All Brokers: Works across all MT5 brokers and account types.
- Minimal Setup Required: Just drop it on the chart and it works instantly.
Formula
Equity & Balance Formula (Simplified)
Shareholders’ Equity=Total Assets−Total Liabilities
How To Use
- Place the indicator file in your MT5 Indicators folder and restart the terminal.
- Open any chart (EURUSD, BTCUSD, etc.) and load the indicator onto it.
- Choose time range (last 30 days, 90 days, all history, etc.).
- Customize color, line type, or thickness to suit your theme.
- Use the balance line to track profit growth from closed trades.
- Use the equity line to observe real account behavior and drawdowns.
- Overlay it while testing new EAs, manual strategies, or funded accounts.
How to Trade
How 4xPip History based Equity and Balance indicator works for your trading?
Use the History Based Equity and Balance Indicator by loading it on your account to compare past equity and balance curves. This helps you spot drawdowns, profit growth, and risky phases in your trading history. If equity often dips far below balance, it signals poor risk control or oversized positions. Use these insights to refine your lot sizing, stop-loss placement, and overall strategy.
During live trading or EA testing, let the indicator update in real time to track performance consistency. If balance rises but equity shows deep swings, adjust your money management. A smooth upward trend in both confirms stability. This simple routine makes the tool ideal for optimizing strategies, controlling risk, and building disciplined account growth.
What is difference between Equity and Balance?
Conclusion
The History Based Equity and Balance Indicator for MT5 brings full transparency and insight into your trading performance by charting both balance and equity using your account’s historical data. It eliminates the need for separate tracking tools or manual exports by embedding this analysis directly into your MT5 platform. Ideal for both individual and professional traders, this tool helps improve accountability, risk control, and strategy development (all without costing a dime). If you’re serious about tracking your growth and learning from your trading behavior, this tool is a must-have.
FAQ's
Q & A
Related products
-

Two Line MACD Histogram Indicator for MT5 – Free Download
$0.00 Select options -
 Free
FreeMT5 Trend Indicator
$0.00 Select options -
 Premium
Best Martingale Strategy Forex EA MT5 | Grid Trading
$99.00 Select options -
 Free
FreeMT5 EA Moving Average Crossover
Original price was: $100.00.$20.00Current price is: $20.00. Select options
Reviews
There are no reviews yet