
Two Line MACD Histogram Indicator for MT5 – Free Download
$0.00
Two Line MACD Histogram Indicator for MT5 is a technical analysis tool designed to visualize the convergence and divergence of two Moving Average Convergence Divergence (MACD) lines, identify potential trend reversals and crossovers, aiding them in making more informed trading decisions.
Description
What is the MACD indicator? The Moving Average Convergence Divergence (MACD) indicator is specifically classified as a trend-following indicator. Illustrating the correlation between two exponential moving averages (EMAs) of a security or asset on a price chart, the MACD indicator is derived by computing the difference between the two EMAs, such as the 12-period EMA and the 26-period EMA. However, the standard presentation with one MACD line and one signal line can sometimes leave traders wanting more. Furthermore, this is where the Two Line MACD Histogram indicator for MetaTrader5 steps in, offering a more refined and potentially profitable perspective.
What are the Two Lines in the MACD Indicator?
The Two Line MACD Histogram Indicator is built upon the Moving Average Convergence Divergence (MACD), a popular momentum oscillator. The indicator consists of two lines—the MACD line and the signal line—along with a histogram that represents the difference between these lines.
- MACD Line: This line is formed by subtracting the 26-period Exponential Moving Average (EMA) from the 12-period EMA. It reflects the short-term momentum of the asset. It is represented by blue colour.
- Signal Line: The signal line is a 9-period EMA applied to the MACD line. It smoothens the MACD line and helps identify potential trend changes. It is represented by red.
What is the histogram in MACD?
The histogram is the visual representation of the difference between the MACD line and the signal line. It provides a clear depiction of the strength and direction of the market trend. Also, the Two Line MACD Histogram for MetaTrader 5 builds upon the traditional MACD concept by adding the line, often called the Zero Line, to the histogram section. Moreover, this line represents the point where the MACD and signal lines would converge if no momentum exists. Lastly, the result is a visual representation of not only the magnitude of momentum but also its direction relative to neutral market conditions. Also, MACD’s histogram strategy is to identify potential trend reversals and price swings. 4xPip Two Line MACD Histogram indicator for MT5 is the Best MACD Two line Histogram Indicator.
Formula of MT5 Two Line MACD Histogram indicator
The MACD calculation involves two main exponential moving averages (EMAs); let’s take an example of 12 EMA and 26 EMA:
MACD Line =12-period EMA − 26-period EMA
Signal line = 9-period EMA (normally)
MACD Histogram = MACD Line − Signal line
How to Trade with a Two Line MACD Histogram indicator for MT5?
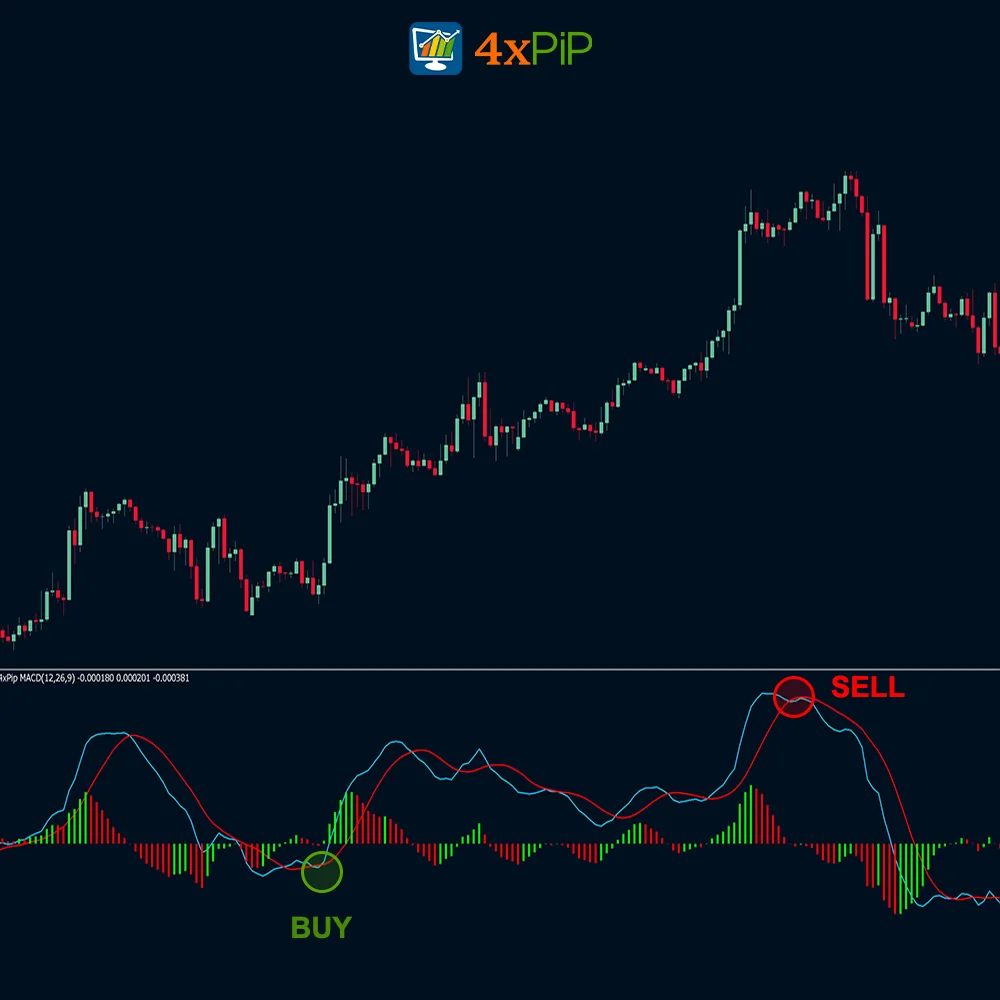
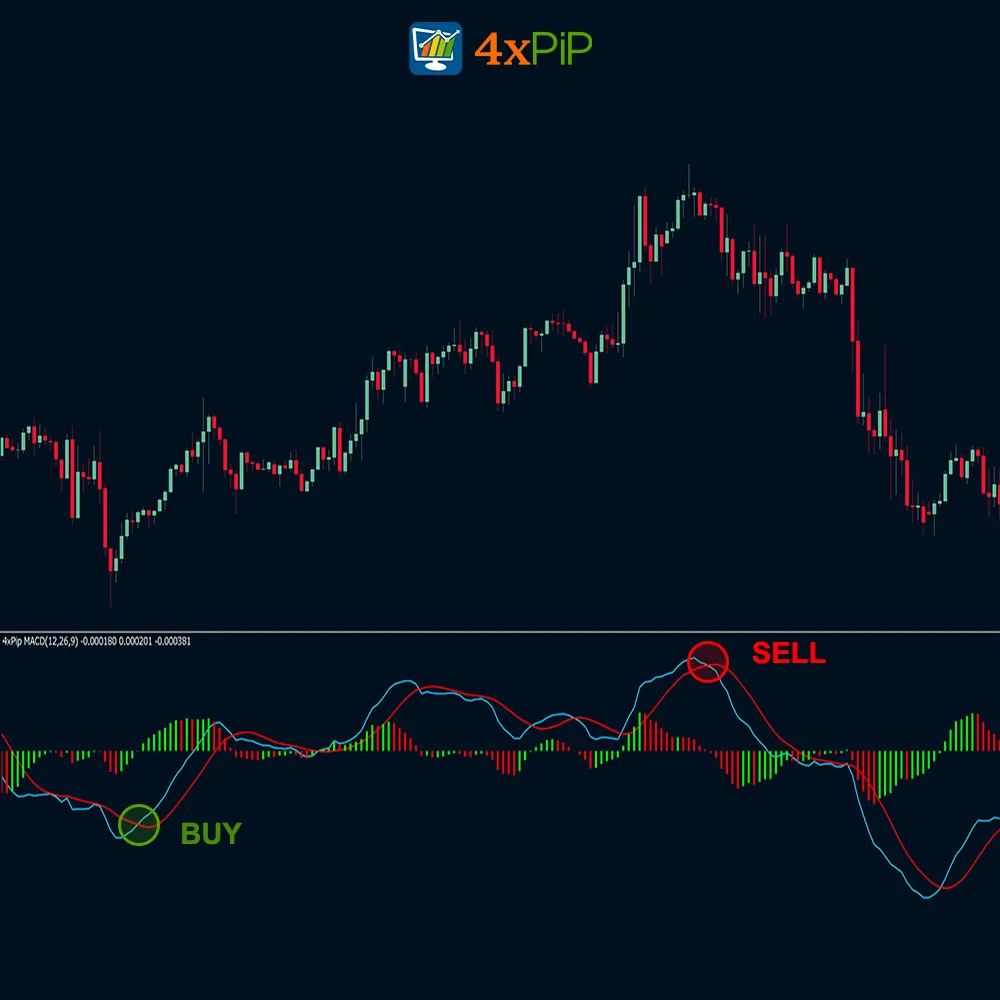
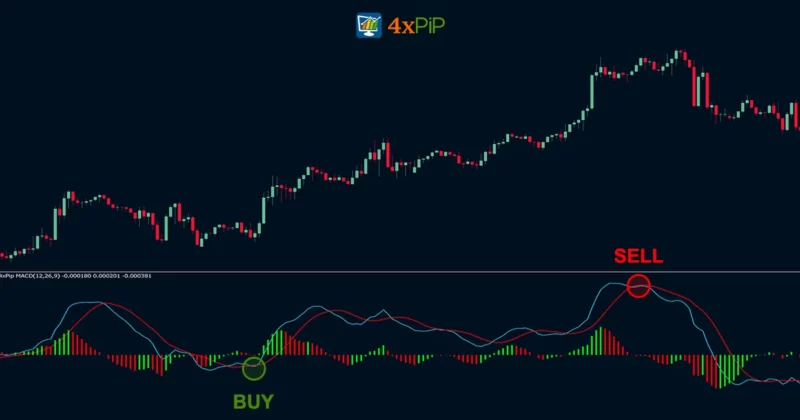
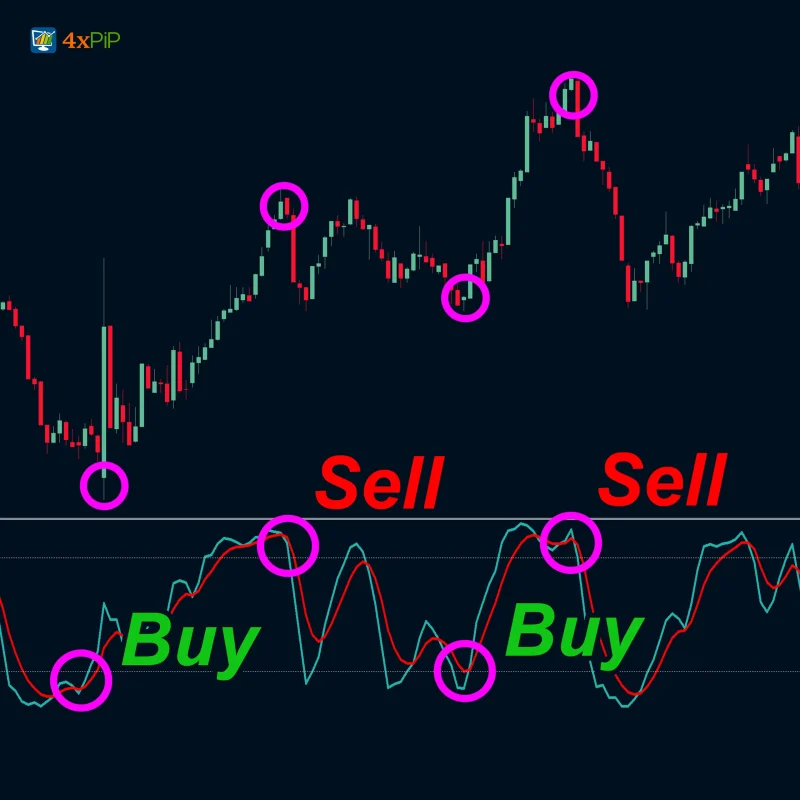
Trading the Two Line MACD Histogram indicator involves acting upon crossovers, signifying the point when the MACD line (Blue line) crosses over the signal line (Red line). Hence, crossovers frequently signal the emergence of a new trend.
When the MACD line (Blue line) crosses under the signal line (Red line) and correctly identifies a new downtrend, that is when you can enter a short or sell trade. Moreover, when the MACD line (Blue line) crosses over the signal line (Red line), it indicates the start of a new uptrend; hence, you can enter a long or buy trade.
Divergence is a condition where elements move apart or exhibit independence. In MACD, it refers to when price action and momentum do not align. For instance, divergence may manifest when the price consistently forms lower highs, but the MACD histogram depicts a series of higher lows. Also, a bullish divergence pattern indicates the possibility of a trend reversal in the near future. Similarly, in an uptrend, when the price sets higher highs but the MACD histogram shows lower highs, it forms a bearish divergence pattern.
Features
MT5 Two Line MACD Histogram Indicator is a game-changer for traders seeking full potential of Moving Average Convergence Divergence(MACD) indicator. Furthermore, this indicator is the advanced version of the MACD Indicator. It acts as a confirmation source of signals and the Best MACD indicator for the MT5 platform. It opens in a new chart. With its comprehensive features and detailed explanations, you can enhance your technical analysis skills and maximize your trading success.
Key Features of MT5 Two Line MACD Histogram:
- Trend Confirmation: The Zero Line acts as a dynamic support/resistance level for the MACD, pinpointing bullish/bearish momentum with laser precision.
- Divergence detection: The Two-line MACD Histogram exposes divergences between price and momentum, allowing you to capitalize on market changes ahead of the curve.
- Momentum strength: The distance between the MACD line and the Zero Line is your visual guide of momentum intensity. Identify high-conviction trading opportunities with confidence.
- Visual Clarity with Histogram: The distinctive histogram visually represents the difference between the MACD line and the signal line, providing a clear snapshot of trend strength and direction.
- Crossover Signals: Leverage the indicator’s ability to generate buy or sell signals with precision. Witness MACD line crossing above signal line for bullish opportunities and below for bearish signals, guiding through potential trend changes.
- Multiple Time Frame Analysis: The indicator may have the capability to analyze the MACD signals across different timeframes simultaneously. This allows traders to assess the overall market trend and potential trade setups from a broader perspective.
- Historical Analysis: The indicator may provide a historical analysis of MACD signals, including the accuracy of past signals and the performance of different parameter combinations. This information can assist traders in evaluating the effectiveness of the indicator and making informed trading decisions.
- Fully customizable: Lastly, make the Two Line MACD Histogram your own. Adjust colors, line styles, and parameters to match your trading preferences and platform theme perfectly.
Conclusion
In short, the 4xPip Two Line MACD Histogram indicator for MT5 can be a valuable tool for MT5 traders seeking to refine their technical analysis and identify profitable trading opportunities. Moreover, by understanding its benefits and best practices, you can leverage this indicator to gain a deeper understanding of market momentum and make more informed trading decisions. Lastly, you can easily download a free Two Line MACD Histogram indicator for MT5 now!
DOWNLOAD NOW Reach Us on WhatsApp
 Fly Over to Telegram
 Drop Us an Email
Settings
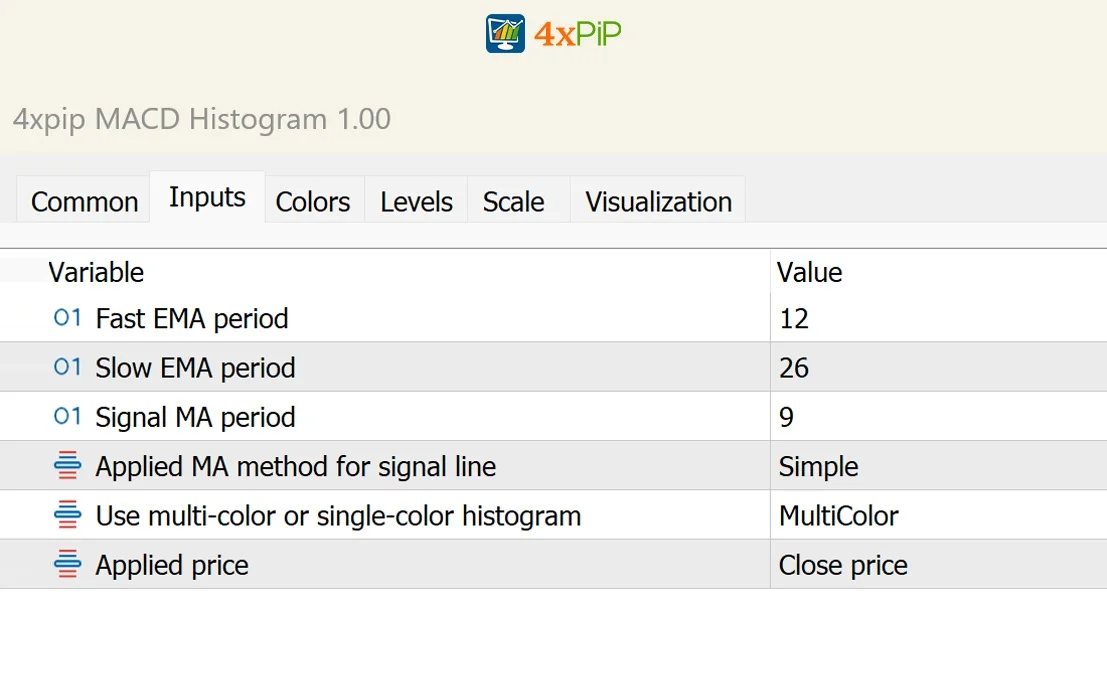
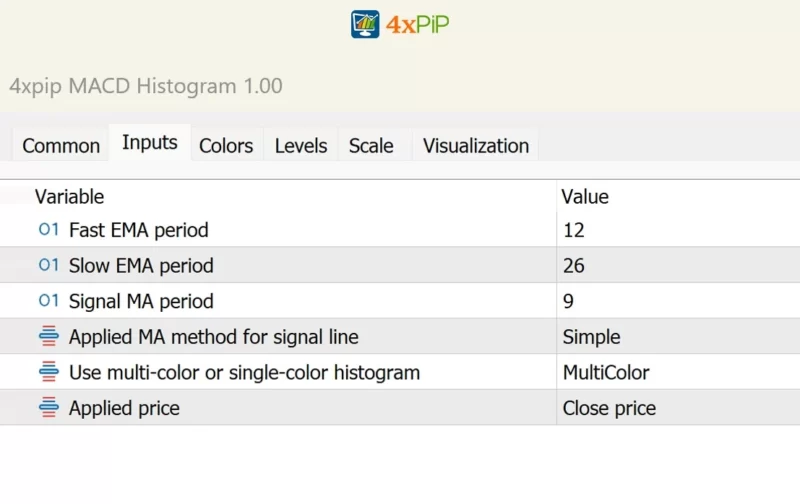
- Fast EMA period: Insert period for Fast EMA
- Slow EMA period: Insert period for Slow EMA
- Signal MA period: Insert period for Signal MA
- Applied MA method for the signal line: Select your MA method. It can be Simple, Exponential, Smooth, or Linear Weighted.
- Use multi-color or single-color histogram: Use Single-color or multi-color display.
- Applied price: Select your Applied price for MACD calculations such as Close, Open, High, Low, Median, Typical or Weighted.
Q & A
MACD is the most effective for daily timeframes, with the default settings commonly set to 26/12/9 days.
MACD generates technical signals when its line crosses above signal line (indicating buy) or falls below it (indicating sell). MACD serves as a valuable tool for assessing whether a security is in an overbought or oversold condition, providing insights into the strength of a directional move and signaling potential price reversals to traders.
The combination of MACD with Price Reasonability Checks (PRC) boasts a success rate of 90%. This approach involves the use of three exponential moving averages instead of one or two.
To validate changes in momentum, a nine-day exponential moving average is introduced as a signal line. In broad terms, a buy signal triggeres when the MACD line crosses above the signal line, while a sell signal initiates when the MACD line descends below the signal line.
Regarding signals, the MACD offers trading signals derived from the crossover of its MACD line and signal line, along with insights from the histogram. Meanwhile, the AO generates signals based on the positive and negative values of the indicator, as well as identifying bullish and bearish divergences.

Reviews
There are no reviews yet