Relative Volatility Index Indicator for MetaTrader 4
$0.00
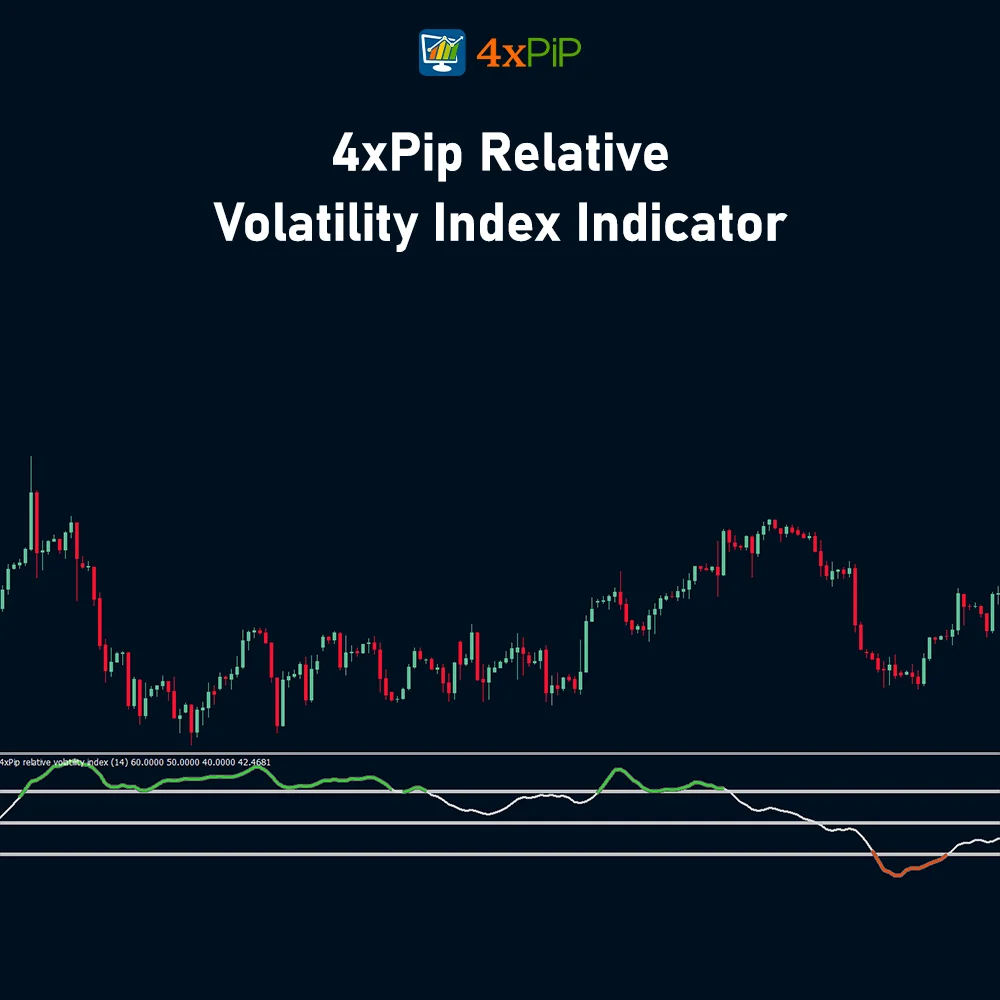
The Relative Volatility Index (RVI) is a powerful indicator for analyzing charts and understanding the market better. It considers volatility, giving a full picture of possible buying and selling chances. With its dual chart window, you can easily see the RVI line next to the price chart for a more detailed analysis.
Description
What is a Relative Volatility Index Indicator? The Relative Volatility Index (RVI) is an amazing indicator for analyzing the market and understanding price trends by considering volatility. Unlike basic price indicators, RVI gives traders a better view of possible opportunities to buy or sell. Moreover, it was created to improve chart analysis and make it easier to spot trends accurately. The RVI Indicator gives clear signals with its colored lines. A white line means a stable market, not going strongly up or down. A green line suggests a chance to buy, showing more upward movement. Also, a red line suggests a chance to sell, with more downward movement. You can customize your analysis by picking different moving averages like simple, exponential, smoothed, or linear weighted. Moreover, this indicator uses RSI, Japanese candle stick price, and moving averages. It is just like the Relative Strength Index(RSI) but a better version.
Relation Between RSI and RVI:
The Relative Volatility Index (RVI) is a bit like the Relative Strength Index (RSI), but they’re not exactly alike. The RSI looks at how much prices change, but the RVI checks the standard deviation of price changes. This makes the RVI better for figuring out how volatile the market is. Similar to RSI both upper and lower limits can also be placed in RVI. Also, we use clear buy and sell zones with upper (60) and lower (40) limits. These give simple signals based on where the RVI line is. Moreover, you can change how the indicator looks by picking different colors. Lastly, the RVI uses volatility, which might give better signals than the RSI.
Using the RVI as a Confirming Indicator
The RVI is meant to confirm trade signals. It is most effective when used alongside other indicators for better trading signals. Furthermore, combining it with moving averages helps identify entry and exit points more confidently. Also, using indicators like Average True Range (ATR), Bollinger Bands, and Historic Volatility gives more insights into market volatility and trend strength. Moreover, this helps reduce false signals and makes your strategies more effective.
Advantages of RVI Indicator:
RVI indicator offers various advantages, which are as follows:
Risk Management: By confirming signals and providing volatility direction, the RVI helps manage risk. This is key for a balanced and disciplined trading approach.
Improved Entry and Exit Points: Combined with moving averages, the RVI helps traders find better entry and exit points, boosting confidence in decisions and strategy effectiveness.
Different from RSI: Unlike the RSI, the RVI looks at the standard deviation of price changes, not their magnitude. This makes it better for measuring market volatility.
Calculation with Standard Deviation: The RVI calculates using the standard deviation of high and low prices over a set time. This gives a more detailed measure of volatility compared to just price changes.
Signal Confirmation: The RVI’s main job is to confirm signals from indicators like moving averages. This confirmation boosts signal accuracy, reducing false positives.
Formula:
RVI = 100 – 100 / (1 + Relative Volatility)
How to Trade with Relative Volatility Index Indicator?
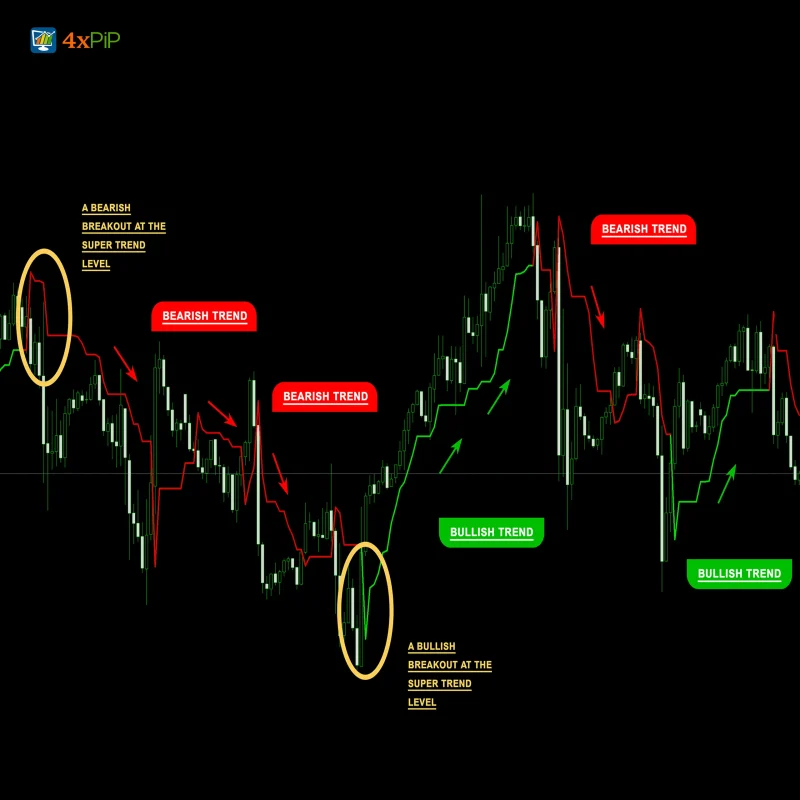
The RVI is like the RSI, but instead of looking at absolute price changes, it uses the standard deviation of high and low prices over a defined range of periods. Compare price changes with RVI movements to analyze divergence. Divergence helps spot possible trend reversals. If prices are reaching new highs but RVI doesn’t confirm, it might mean momentum is weakening.
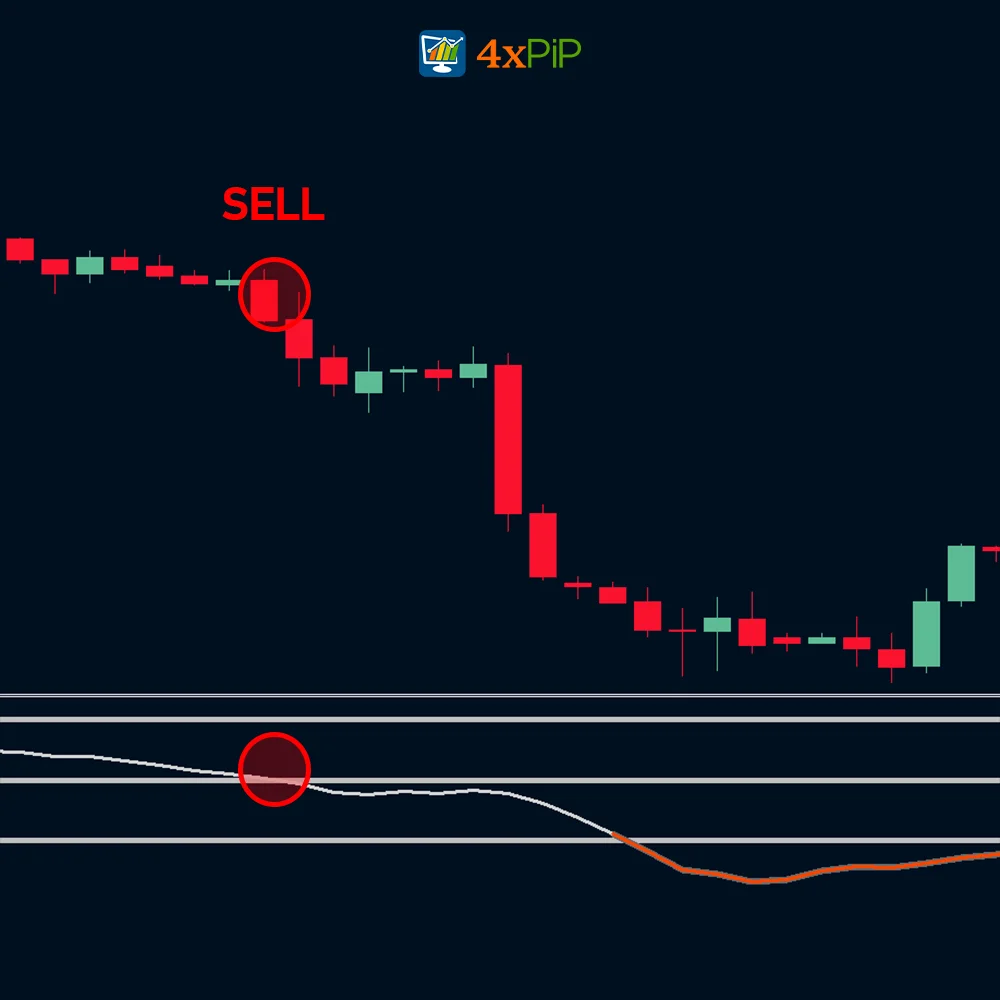
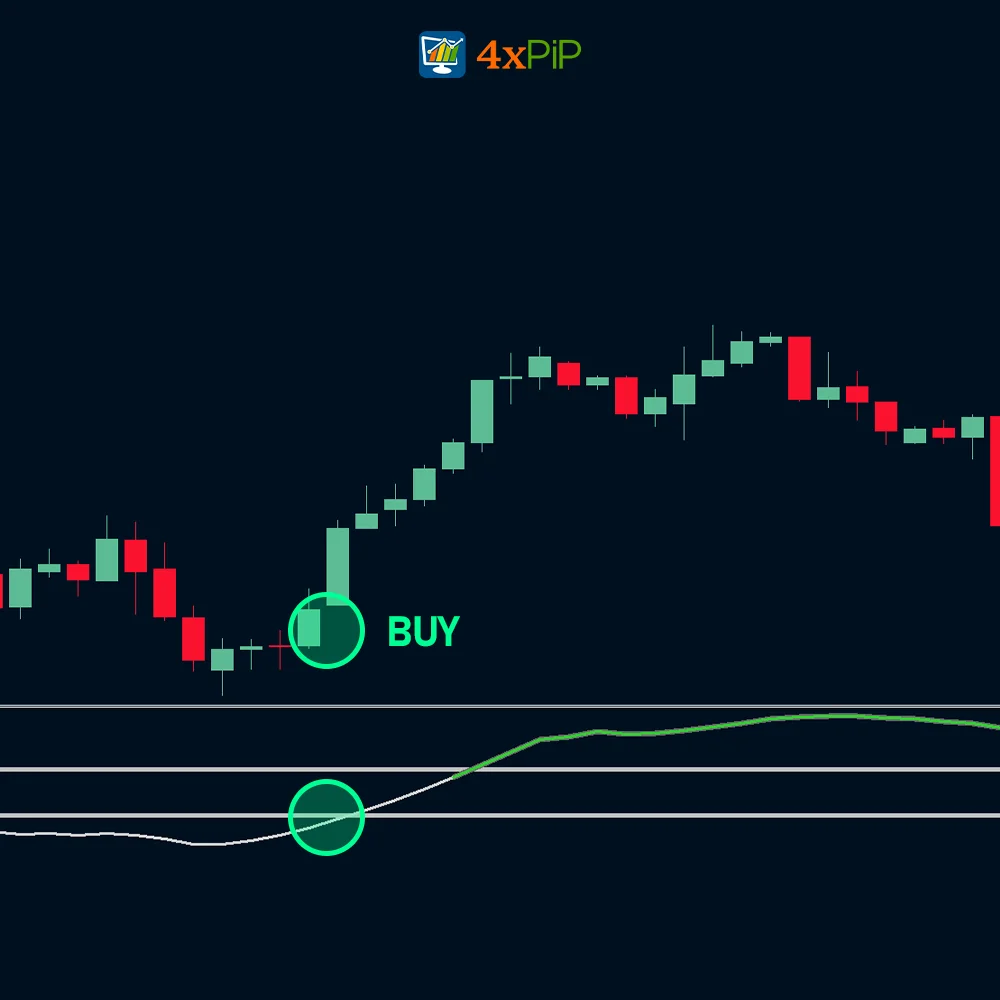
Use the RVI’s set upper limit (60) and lower limit (40) to determine when to buy or sell. If the RVI goes above 60, it could be too high, and you might want to sell. If it goes below 40, it could mean it’s too low, and you might want to buy. Use RVI to double-check signals from other indicators, especially ones showing the trend. When RVI matches with other indicators, it makes signals more reliable and reduces wrong signals.
Features:
Relative Volatility Indicator has multiple features some of which are as follows:
- Signal Confirmation: The RVI’s main job is to confirm signals from indicators like moving averages. This confirmation boosts signal accuracy, reducing false positives.
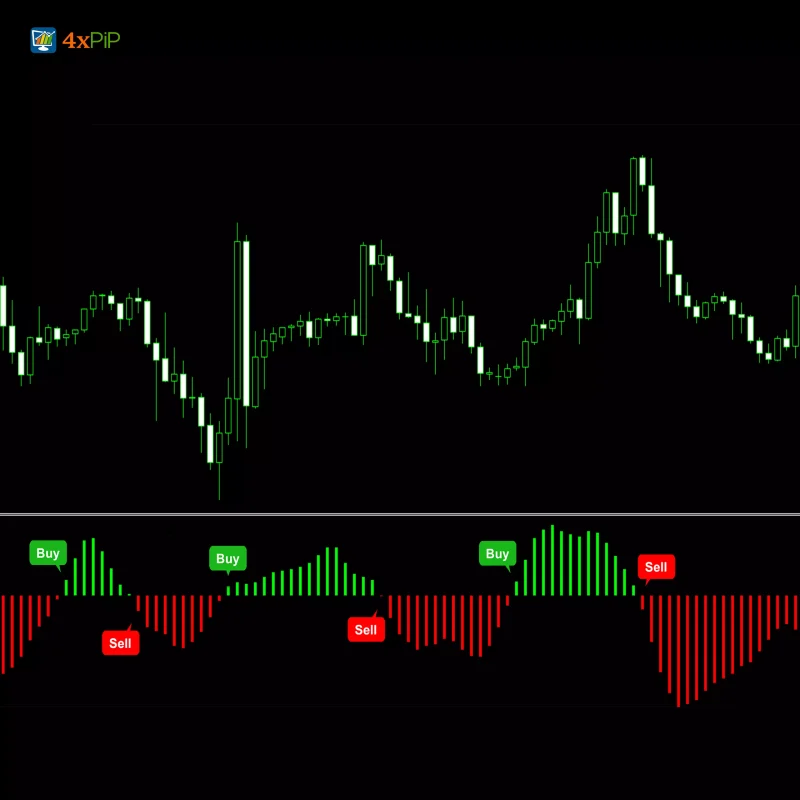
- Spotting Trends: RVI identifies uptrends and downtrends and gives buying and selling signals. When the RVI line is of green color it is a potential buying opportunity and when the line is of red color it is a potential selling opportunity. While white color indicates neutral trends in the market
- Different from RSI: Unlike the RSI, the RVI looks at the standard deviation of price changes, not their magnitude. This makes it better for measuring market volatility.
- Calculation with Standard Deviation: The RVI calculates using the standard deviation of high and low prices over a set time. This gives a more detailed measure of volatility compared to just price changes.
- Works Well with Other Indicators: The RVI works best when combined with other indicators and tools. It’s compatible with moving averages, trendlines, and more, helping traders create a reliable system.
- Improved Entry and Exit Points: Combined with moving averages, the RVI helps traders find better entry and exit points, boosting confidence in decisions and strategy effectiveness.
- Risk Management: By confirming signals and providing volatility direction, the RVI helps manage risk. This is key for a balanced and disciplined trading approach.
- Used in Scanning and Strategy Testing: The RVI works in market scanning and strategy testing.
Conclusion
The Relative Volatility Index (RVI) is a powerful indicator in market analysis, assessing price trends by considering volatility. Moreover, it improves chart analysis by providing clear signals based on volatility, offering buying and selling opportunities. Unlike the Relative Strength Index (RSI), the RVI focuses on the standard deviation of price changes, making it adept at measuring market volatility. It serves to confirm trade signals, particularly when used alongside other indicators, aiding in risk management, improving entry and exit points, and offering insights into trend strength.
DOWNLOAD NOW Reach Us on WhatsApp
 Fly Over to Telegram
 Drop Us an Email
Settings
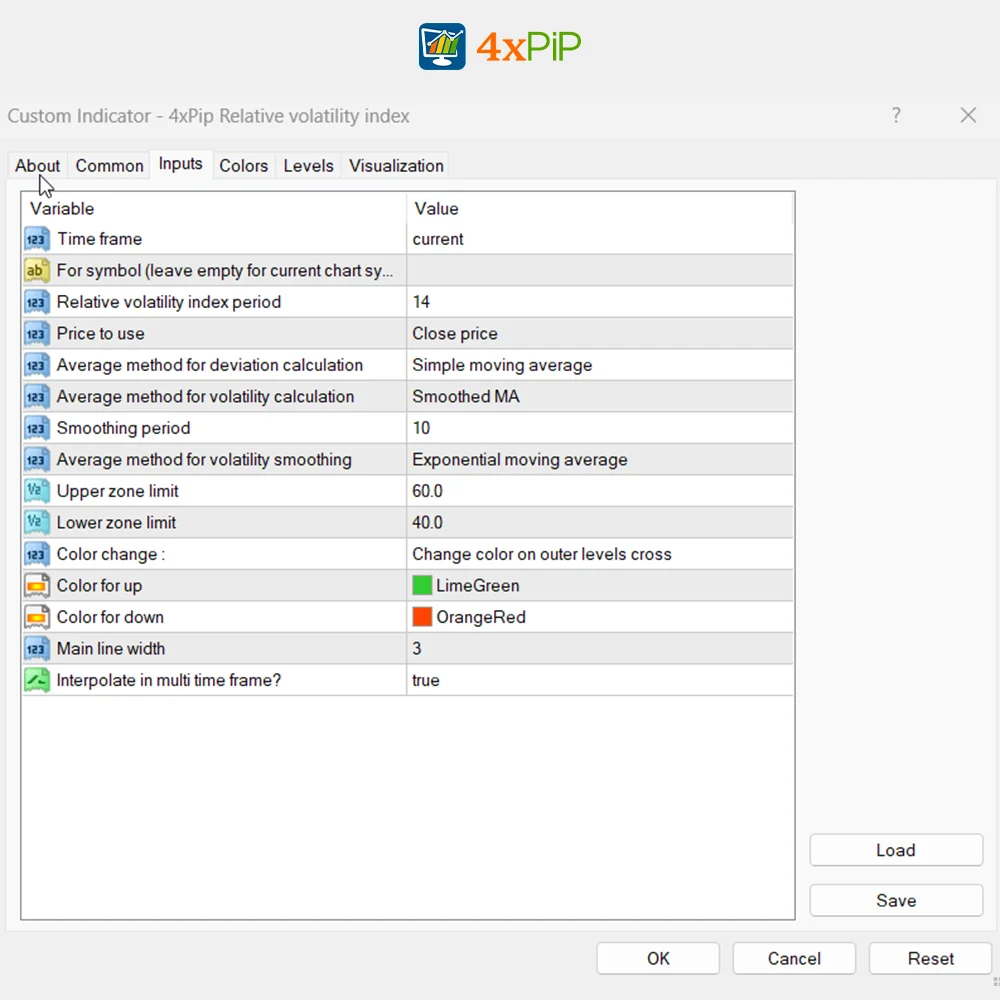
- Time frame (value = Current)
- For symbol (leave empty for current chart symbol)
- Relative volatility index period (value = 14)
- Price to use (value = Close Price)
- Average method for deviation calculation = Options => Simple moving average, Exponential moving average, Smoothed MA, Linear weighted MA
- Average method for volatility calculation = Options => Simple moving average, Exponential moving average, Smoothed MA, Linear weighted MA
- Smoothing period (value = 10)
- Average method for volatility smoothing = Options => Simple moving average, Exponential moving average, Smoothed MA, Linear weighted MA
- Upper zone limit (value = 60.0)
- Lower zone limit (value = 40.0)
- Color change: = Options=> Change color on slope change, change color on middle line cross, change color on outer levels cross
- Color for up (value = LimeGreen)
- Color for down (value = OrangeRed)
- Main line width (value = 3)
- Interpolate in multi-timeframe (value = true)
41 reviews for Relative Volatility Index Indicator for MetaTrader 4
| 5 star | 48% | |
| 4 star | 51% | |
| 3 star | 0% | |
| 2 star | 0% | |
| 1 star | 0% |
Q & A
Yes, the RVI can be beneficial for traders at all experience levels, offering valuable insights into market trends and volatility for informed decision-making.
The RVI is compatible with various trading tools and indicators, facilitating strategy testing and market scanning for more informed trading decisions.
While the RVI provides valuable insights, it's most effective when used in conjunction with other indicators to validate signals and enhance strategy effectiveness.
The RVI enhances signal accuracy by confirming signals from indicators like moving averages, reducing false positives in trading decisions.
Martingale EA is effective, but it’s not a foolproof strategy. The 100% winning rate claim is a bit ambitious. Use it cautiously, and it can be a valuable asset in your trading arsenal.
As a beginner, Martingale EA has been a game-changer for me. The automatic trading and counter trades make it easy to navigate the market. My confidence in trading has soared.
Martingale EA is a powerful addition to my trading arsenal. Recovering losses with counter trades is a brilliant feature. It’s not a guaranteed win every time, but it significantly improves your odds.
Martingale Forex EA lives up to its promises. The 100% winning rate is not just a claim; it’s a reality. It has transformed my trading experience, and I can’t imagine trading without it.
Downloaded Martingale Forex EA, and my trading has never been better. The EA’s ability to identify optimal entry points is remarkable. It’s a must-have for serious traders.