
MACD of 3 DEMA Double Exponential Moving Average Indicator for MT4 – FREE Download
$0.00
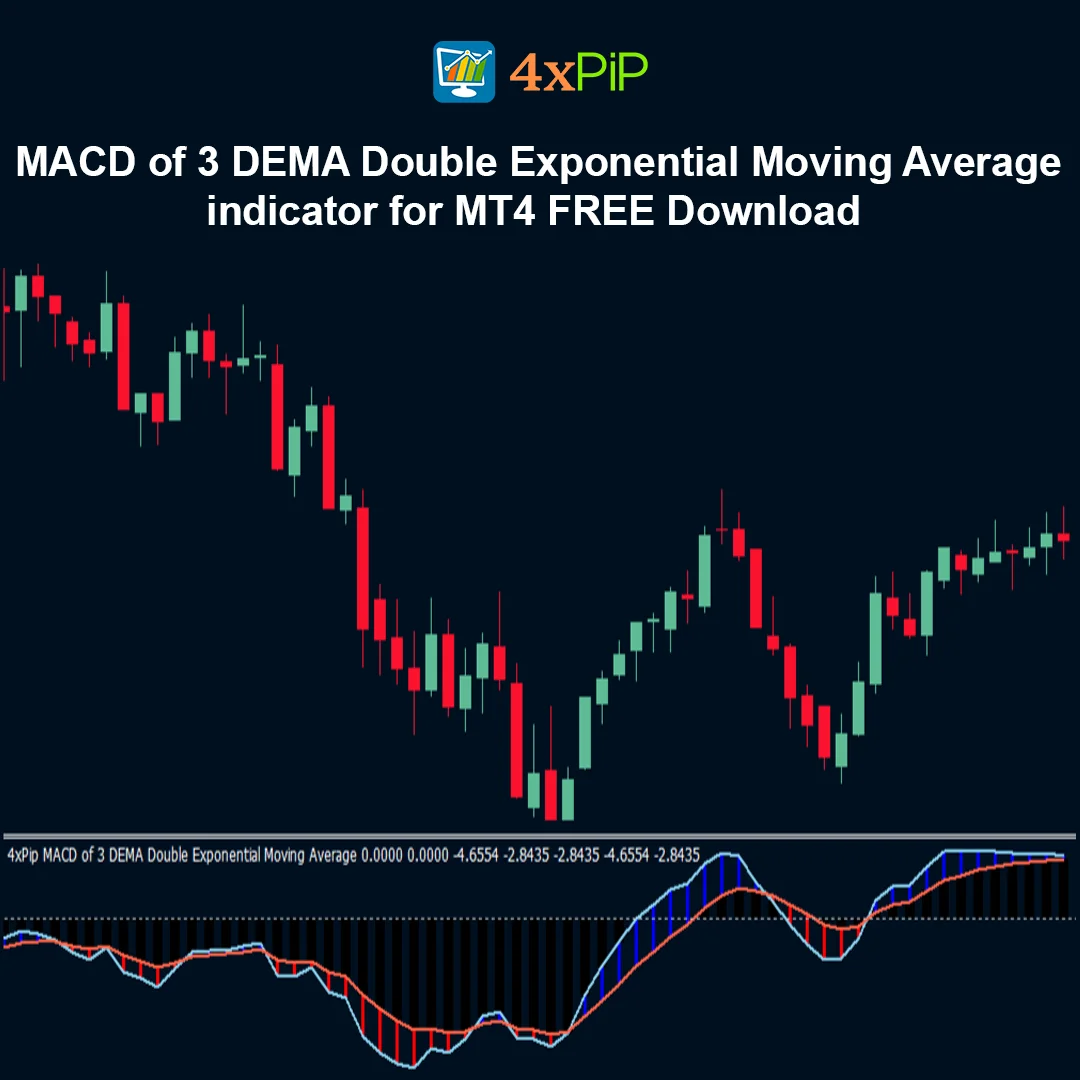
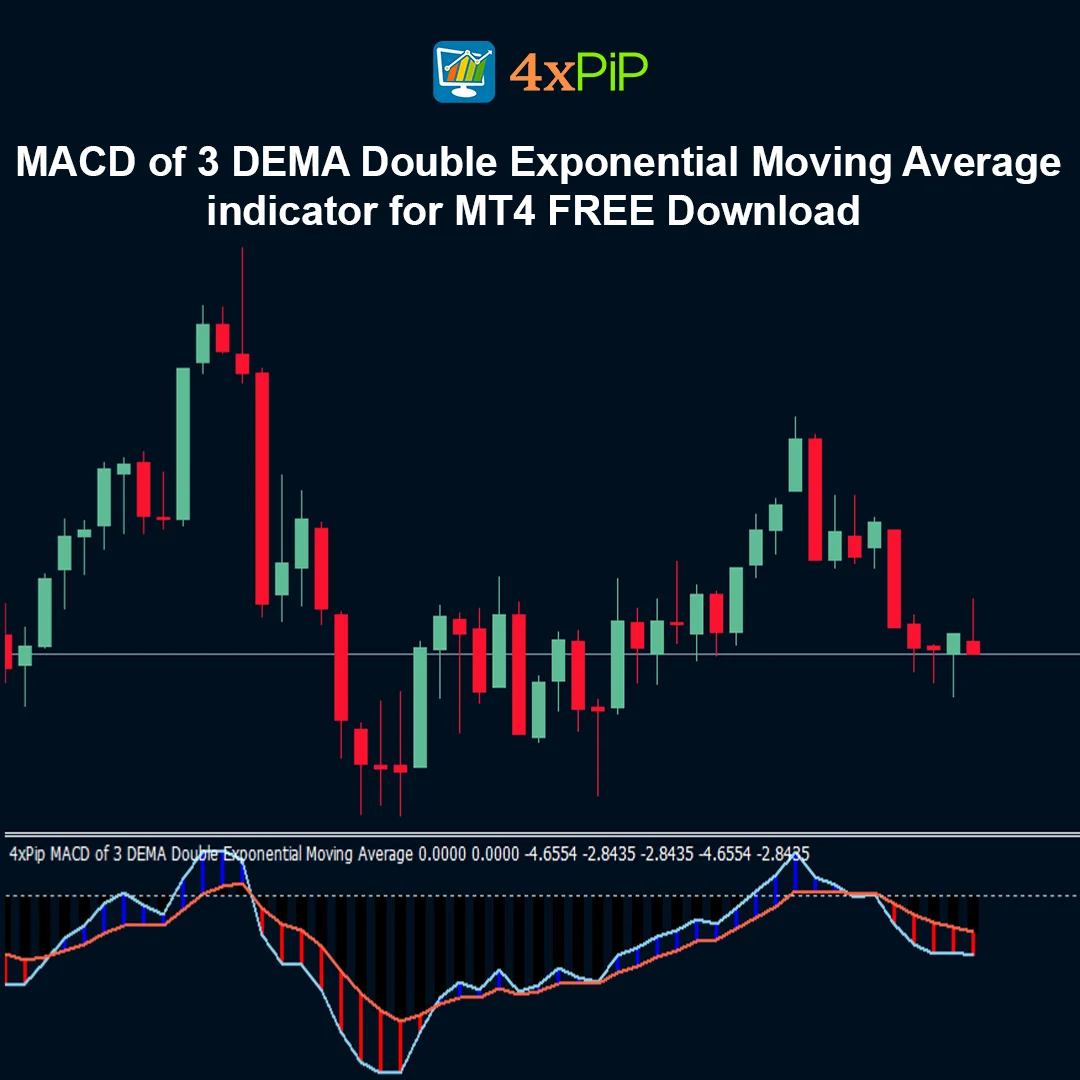
The MACD of 3 DEMA Double Exponential Moving Average is an advanced momentum and trend-following indicator designed for the MetaTrader 4 platform. This indicator is a modified version of the classic MACD that uses Double Exponential Moving Averages (DEMA) instead of traditional exponential moving averages to reduce lag and improve signal accuracy.
By applying three DEMA calculations within the MACD structure, the indicator becomes more responsive to price changes and helps traders detect trend momentum, potential reversals, and entry opportunities earlier than the standard MACD.
The indicator displays a MACD line, signal line, and histogram, allowing traders to analyze the strength and direction of market momentum while filtering out unnecessary market noise.
Description
What is the MACD of 3 DEMA indicator?
The MACD of 3 DEMA indicator is a modified version of the traditional MACD that replaces standard exponential moving averages with Double Exponential Moving Averages. This adjustment makes the indicator more responsive and reduces lag in trend signals.
Why are DEMA averages used in this indicator?
DEMA averages are used because they react faster to price movements compared to traditional exponential moving averages. By using DEMA, the indicator can provide earlier signals and smoother momentum analysis.
How does the indicator work?
The indicator calculates three Double Exponential Moving Averages and integrates them into the MACD calculation. The result is a momentum indicator that reacts faster to changes in price trends and displays signals through a MACD line, signal line, and histogram.
What does the histogram represent?
The histogram represents the difference between the MACD line and the signal line. It helps traders visualize the strength and direction of market momentum.
What do the MACD and signal lines show?
The MACD line shows the relationship between two moving averages, while the signal line acts as a trigger line that generates potential buy or sell signals when crossovers occur.
Why is this indicator useful for traders?
The MACD of 3 DEMA provides faster signals and better responsiveness compared to the standard MACD. This helps traders identify trend momentum and possible reversals more efficiently.
Advantages
- Reduces lag compared to the standard MACD indicator.
- Uses Double Exponential Moving Averages for faster response.
- Provides clearer momentum signals.
- Helps detect trend changes earlier.
- Displays MACD line, signal line, and histogram for detailed analysis.
- Filters market noise while maintaining responsiveness.
- Works across multiple financial markets.
- Suitable for various trading timeframes.
- Can be combined with other technical indicators.
- Free indicator for MetaTrader 4 users.
Features
- Modified MACD indicator based on DEMA calculations.
- Uses three Double Exponential Moving Averages.
- Reduced lag compared to traditional MACD.
- Displays MACD line and signal line for crossover signals.
- Histogram visualization of momentum strength.
- Helps identify bullish and bearish market momentum.
- Compatible with all trading instruments in MetaTrader 4.
- Lightweight and optimized for smooth platform performance.
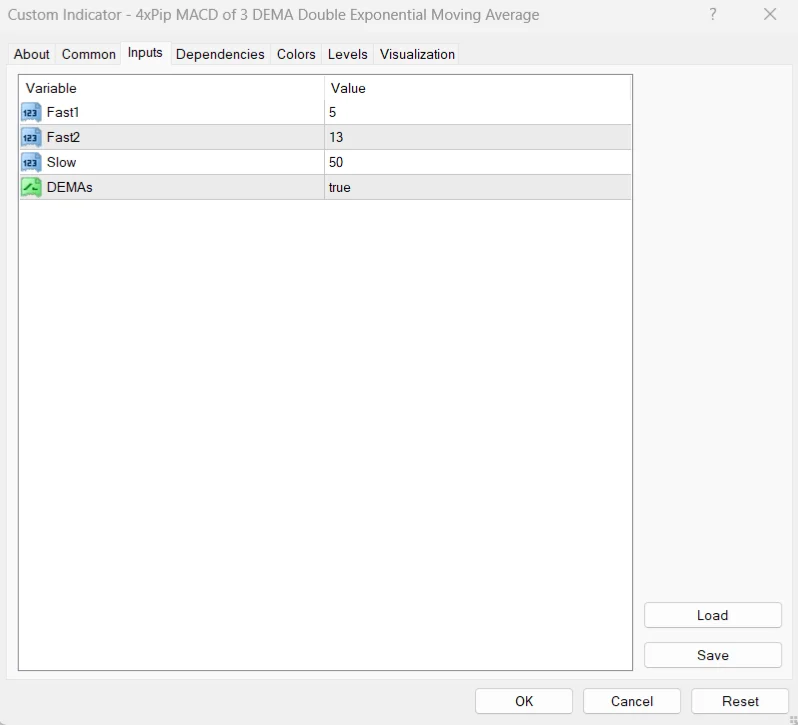
- Adjustable parameters for flexible analysis.
- Suitable for both manual and automated trading strategies.
How to Trade
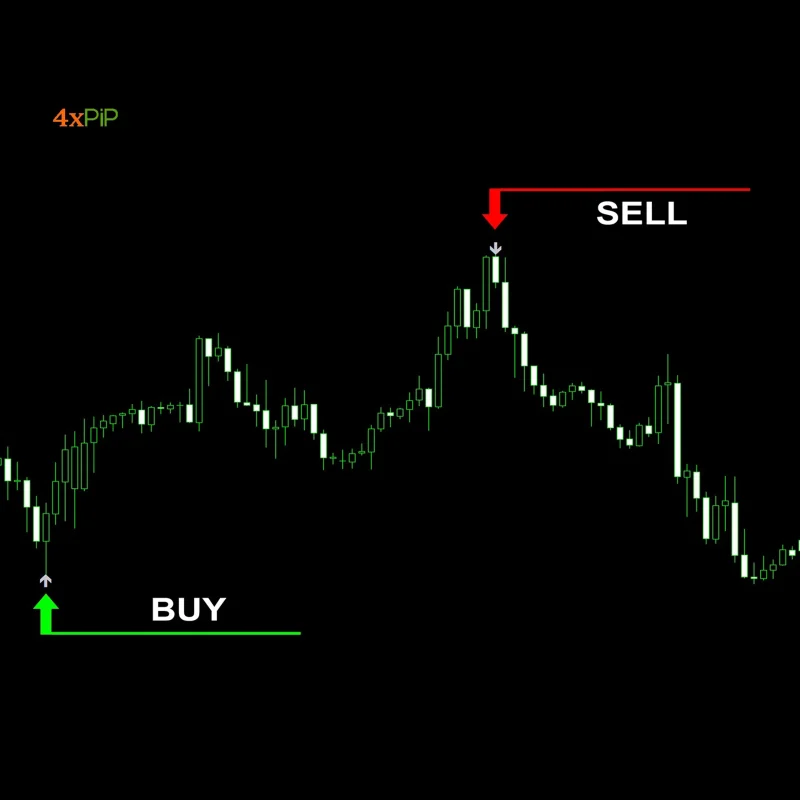
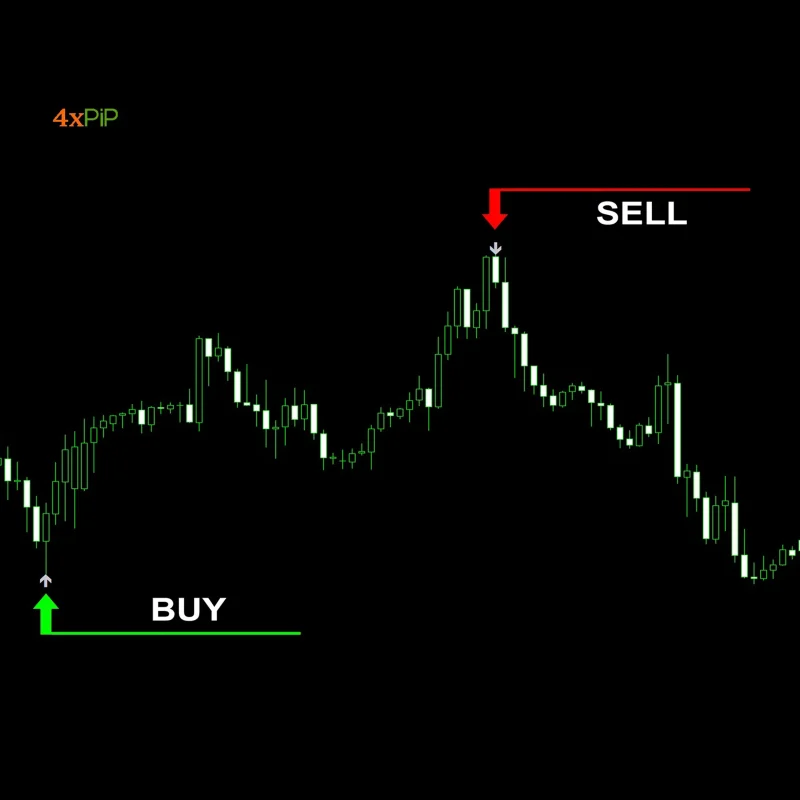
The MACD of 3 DEMA indicator is primarily used to identify momentum shifts and trend direction. When the MACD line crosses above the signal line, it suggests increasing bullish momentum and traders may consider potential buying opportunities. When the MACD line crosses below the signal line, it indicates increasing bearish momentum and traders may look for selling opportunities. The histogram also helps traders evaluate momentum strength—growing histogram bars typically indicate strengthening trends, while shrinking bars suggest weakening momentum. Because the indicator uses Double Exponential Moving Averages, it reacts faster to price movements than the standard MACD. Traders often combine this indicator with support and resistance levels, trend analysis, or other momentum indicators to confirm trading signals.
Formula
The indicator is based on the Double Exponential Moving Average calculation:
DEMA = (2 × EMA₁) − EMA₂
Where:
- EMA₁ — Exponential moving average of price
- EMA₂ — Exponential moving average of EMA₁
These DEMA values are then used within the MACD structure to calculate the MACD line, signal line, and histogram, resulting in faster and more responsive momentum signals.
Conclusion
The MACD of 3 DEMA Double Exponential Moving Average indicator is a powerful enhancement of the traditional MACD. By incorporating Double Exponential Moving Averages, it reduces lag and provides quicker responses to market changes. This makes it a valuable tool for traders who want to identify trend momentum, potential reversals, and trading opportunities more effectively on the MetaTrader 4 platform.
DOWNLOAD NOW Reach Us on WhatsApp
 Fly Over to Telegram
 Drop Us an Email
Reviews
There are no reviews yet