Daily Lot, Orders, Profit Statistics on Chart – Indicator for MetaTrader 5 FREE Download
$0.00
The Daily Lot, Orders, Profit Statistics indicator for MetaTrader 5 provides a clear on-chart summary of your trading performance. It displays daily trading statistics including total lots traded, number of closed orders, and net profit or loss. With real-time updates, color-coded results, and a clean modern interface, traders can quickly evaluate their performance directly from the chart.
Description
What is the Daily Lot Statistics Indicator?
The Daily Lot, Orders, Profit Statistics indicator is a powerful performance monitoring tool designed for traders using MetaTrader 5. Instead of manually reviewing trade history, this indicator automatically calculates and displays important trading metrics directly on the chart.
It tracks daily trading activity and presents it in an easy-to-read format. Traders can quickly see how many lots were traded, how many orders were executed, and the total profit or loss for each trading day.
The indicator also provides an all-time summary, allowing traders to evaluate their entire trading performance at a glance.
Why is tracking daily trading statistics important?
Monitoring daily trading statistics is essential for improving trading discipline and strategy performance. Many traders focus only on individual trades, but long-term success comes from understanding overall performance patterns.
This indicator simplifies that process by presenting structured daily records directly on the chart. Traders can easily see which days were profitable and which resulted in losses. This visual feedback helps identify mistakes, refine strategies, and maintain consistent risk management.
By analyzing daily statistics, traders gain deeper insights into their trading behavior and can make better decisions moving forward.
How does the indicator display trading data?
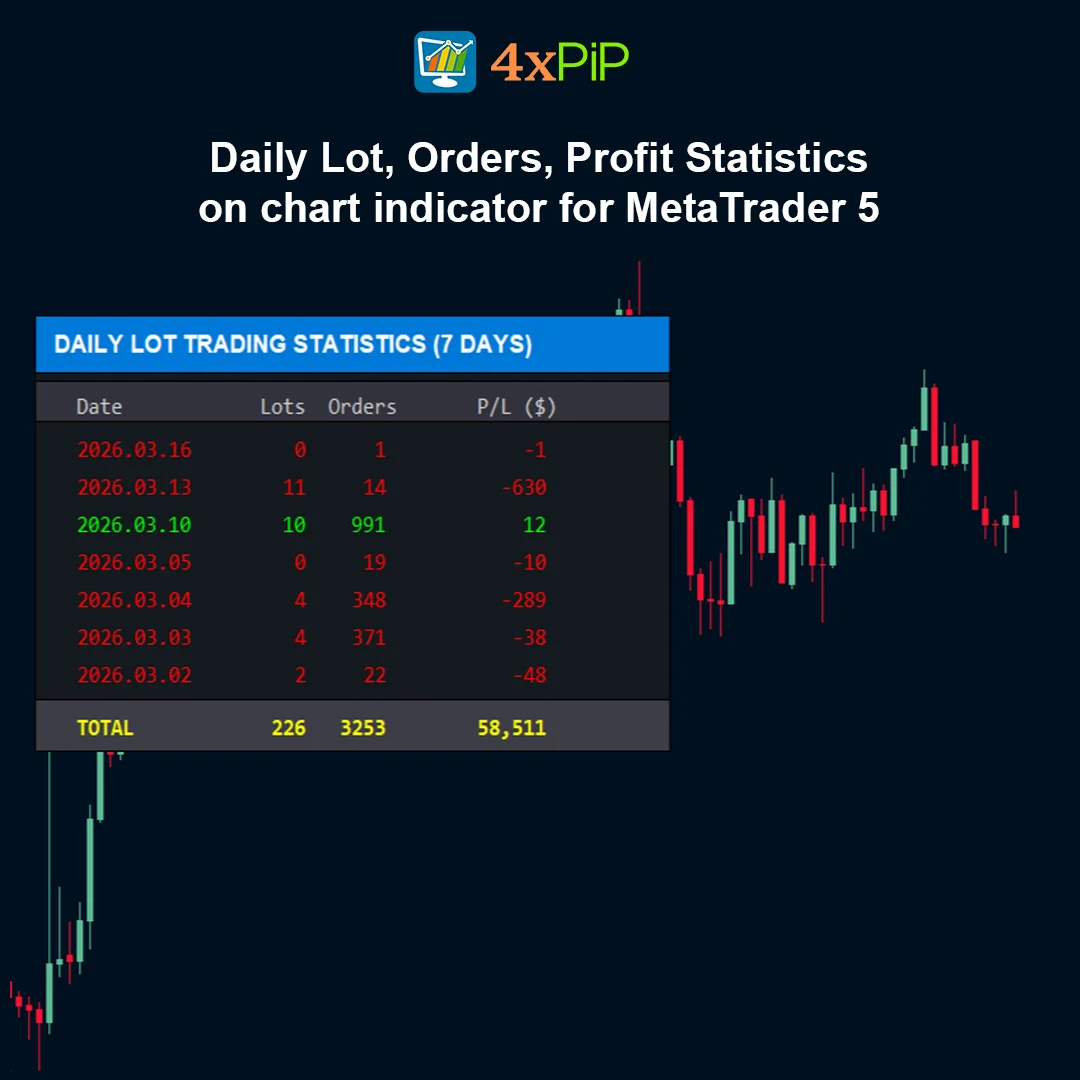
The indicator organizes trading data into a structured panel that shows statistics for the last seven trading days, although this value can be customized in the settings.
Each row represents a trading day and includes the following information:
* Date in YYYY.MM.DD format
* Total lots traded during the day
* Number of closed orders
* Net profit or loss including swap and commission
The indicator also calculates a TOTAL row, which summarizes all trading history. This provides traders with a quick overview of their long-term performance.The results are visually enhanced using color-coded profit values.
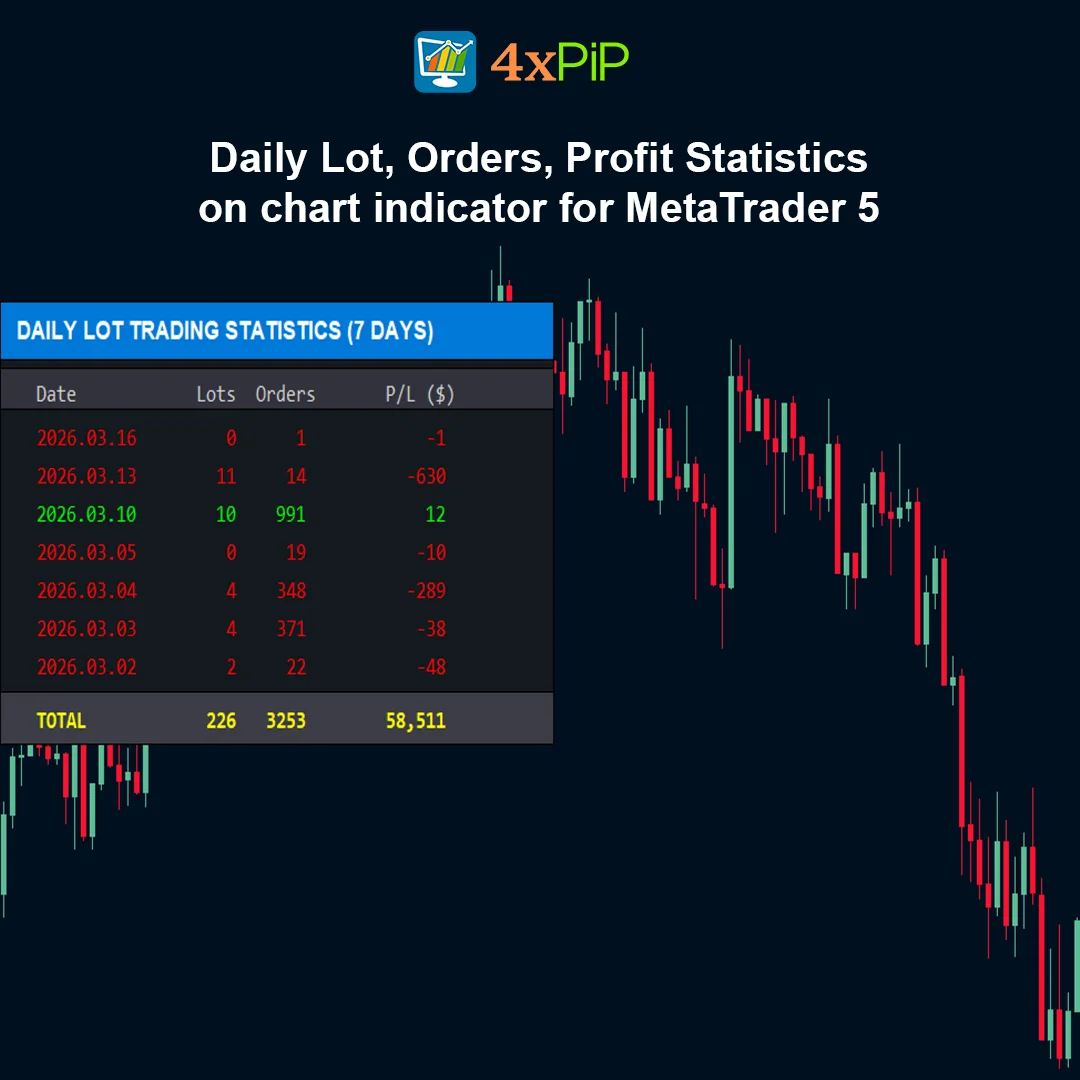
What makes this indicator visually effective?
One of the most useful aspects of the indicator is its visual clarity. Profitable days are displayed in green, while losing days appear in red, allowing traders to instantly recognize performance trends.
The interface uses a modern flat UI design, making the statistics easy to read without cluttering the chart. Numbers are also formatted using comma-separated values, which improves readability when dealing with large trading volumes or profits.These design elements make the indicator both professional and user-friendly.
Who should use this indicator?
This indicator is ideal for traders who want quick access to performance data without opening complex trading reports.
Day traders can use it to evaluate daily trading results and maintain consistency. Swing traders benefit from the weekly overview that shows performance trends across multiple sessions. It is also extremely useful for traders who keep trading journals and want a quick visual summary of their activity directly on the chart.
Overall, the tool provides a simple yet powerful way to monitor trading performance in real time.
Advantages
- Displays daily trading statistics directly on the chart.
- Tracks lots traded, orders executed, and profit/loss.
- Shows statistics for recent trading days.
- Provides cumulative all-time trading summary.
- Real-time automatic updates.
- Color-coded results for easy interpretation.
- Clean modern interface design.
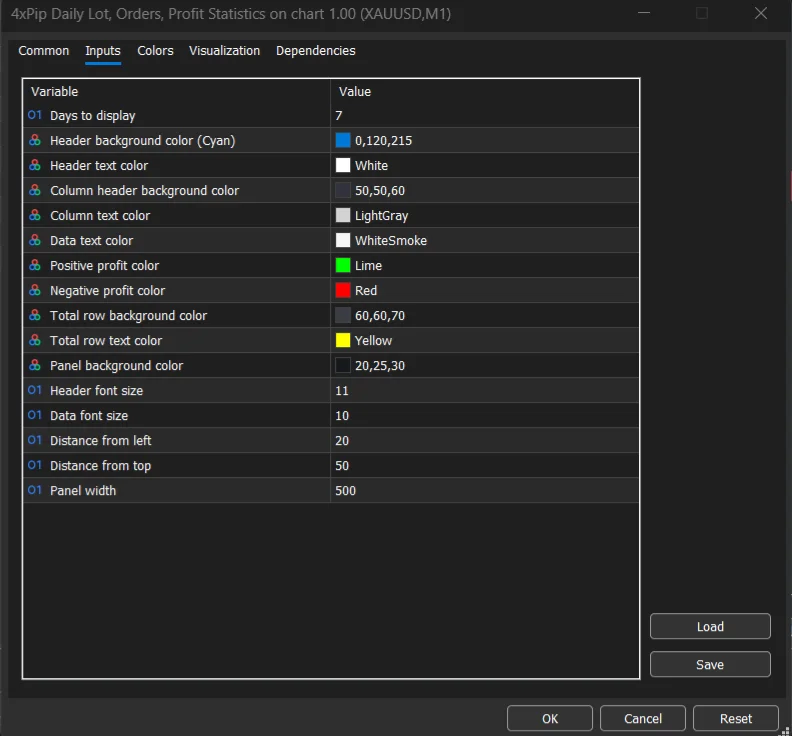
- Customizable colors and layout.
- Helps traders evaluate performance quickly.
- Suitable for all trading styles.
Features
- Daily trading breakdown display.
- Customizable number of days shown.
- Real-time data updates.
- Color-coded profit and loss values.
- Comma-separated number formatting.
- Modern flat UI interface.
- Tracks total lots traded per day.
- Displays number of closed orders.
- Calculates net profit including swaps and commissions.
- Compatible with all MT5 charts.
How to Trade
Install the indicator in MetaTrader 5.Attach it to any chart.The indicator will automatically analyze your trading history.Monitor daily statistics to evaluate trading performance.Use the information to adjust risk management and improve strategy results.
Formula
The indicator analyzes trading history and calculates the following metrics:
Lots (Daily)
Sum of all traded lot sizes for closed orders during the day.
Orders (Daily)
Total number of closed trades for the day.
Net Profit/Loss
Profit calculation including:
Profit = Trade Profit + Swap + Commission
Total Statistics
Total Lots = Sum of all daily lots
Total Orders = Sum of all closed orders
Total Profit/Loss = Combined net profit from all trades
Conclusion
The Daily Lot, Orders, Profit Statistics indicator for MetaTrader 5 is a practical performance monitoring tool that helps traders stay aware of their trading results. By providing real-time daily statistics and cumulative summaries directly on the chart, it simplifies performance tracking and improves trading discipline.
With its clean design, clear metrics, and customizable settings, this indicator is an excellent addition for traders who want a professional overview of their trading activity.
DOWNLOAD NOW Reach Us on WhatsApp
 Fly Over to Telegram
 Drop Us an Email
FAQ's
Q & A
Related products
-
 Premium
Best Martingale Strategy Forex EA MT5 | Grid Trading
$99.00 Select options -
 Free
FreeMT5 EA Stochastic
Original price was: $100.00.$20.00Current price is: $20.00. Select options -
 Premium
MT5 EA to send Signal Alerts to Telegram channel
Original price was: $199.00.$49.00Current price is: $49.00. Select options -
 Premium
MT5 Trailing Stop EA
Original price was: $99.00.$10.00Current price is: $10.00. Select options
Reviews
There are no reviews yet