

Best Fibonacci indicator for MetaTrader 4 – Download FREE
$0.00
4xPip Best Fibonacci indicator for MetaTrader 4 automatically applies Fibonacci retracement and extension levels, streamlining the process of identifying support, resistance, and price targets for traders. It simplifies and enhances your Fibonacci analysis in MT4.
Description
What is the Fibonacci Trading Strategy? The Fibonacci trading strategy involves analyzing and executing trades based on the Fibonacci sequence, where each number is the sum of the two preceding ones (e.g., 0, 1, 1, 2, 3, 5, 8, 13, 21, 34, etc.). Traders use Fibonacci retracements to identify likely support and resistance levels in an asset’s price movement. These levels are determined by measuring vertical distances between price highs and lows and dividing them by key Fibonacci ratios (23.6%, 38.2%, 50%, 61.8%, and 100%). When a price retraces to one of these levels following a significant upward or downward movement, it may suggest a potential trend change, guiding traders in their buying or selling decisions.
What is Fibonacci retracement and extension?
Fibonacci retracement and extension are technical tools employing horizontal lines to pinpoint potential support and resistance levels in an asset or security’s price trajectory. Traders utilize Fibonacci ratios to forecast retracement or extension zones by tracing price swings from high to low. Retracement levels indicate support or resistance zones, while extension levels signal potential profit-taking areas.
The Fibonacci sequence holds relevance in financial markets as it identifies potential support and resistance levels for asset prices. Derived by summing the previous two numbers (starting from 0 and 1), it assists traders in pinpointing areas where price movements may stall or reverse. These levels often align with significant psychological levels in trading, guiding traders in decision-making processes like entering or exiting positions.
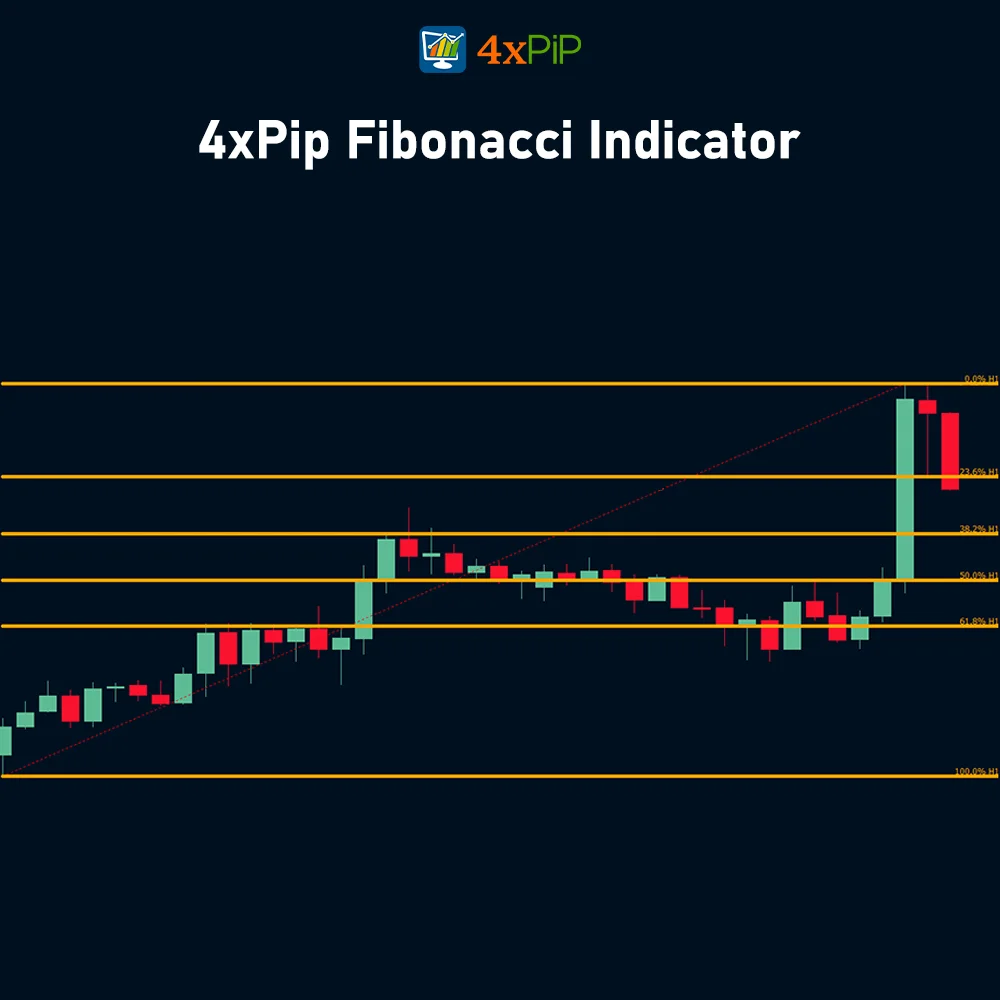
The 4xPip Best Fibonacci indicator for MT4 simplifies Fibonacci retracements by automatically plotting them on the chart. Users can adjust the position of the retracements by dragging the diagonal line. When the chart period changes, the retracements recalculate automatically. Additionally, the indicator draws Fibonacci extensions, filtering out flat market phases and focusing only on active price movements.
Fibonacci extensions help determine the potential depth of retracement relative to the primary trend, identifying pivotal points from which the trend is likely to resume. Unlike some indicators, the Fibonacci levels remain unchanged when switching timeframes, ensuring consistency. This versatility makes the indicator valuable for traders employing various trading styles across different timeframes.
Moreover, the indicator provides insights into the sentiment of Forex market participants, aiding in predicting potential price movements. This comprehensive functionality makes it a valuable tool for traders of all experience levels and trading strategies.
Fibonacci levels
The Fibonacci extensions are represented as percentages and calculated by setting the Fibo grid from 0% to 100% to display values like 23.6%, 38.2%, 50.0%, and 61.8%. These values help draw six Fibonacci levels:
- 100% marks the starting point for Fibonacci levels.
- 61.8% is the “golden ratio,” often paired with 50% for potential pivot points.
- 50% frequently coincides with pivot formations as traders secure profits.
- 38.2% witness pivot formations when traders are active and confident.
- 23.6% rarely sees pivot formations as traders often wait for deeper retracements.
- 0% marks the endpoint for Fibonacci levels.
These levels are extensively applied in forex, stocks, and cryptocurrency trading to inform trading decisions and enhance success rates.
Formula
Formulas for Fibonacci retracement levels are as follows:
UR = High price – ((High price – Low price) × percentage) in an uptrend market
UR = Low price + ((High price – Low price) × percentage) in a downtrend market
Where:
UR = uptrend retracement;
DR = downtrend retracement
The percentage values correspond to various Fibonacci retracement levels, including 23.6%, 38.2%, 50%, 61.8%, 76.4%, 100%, 138.2%, or 161.8%.
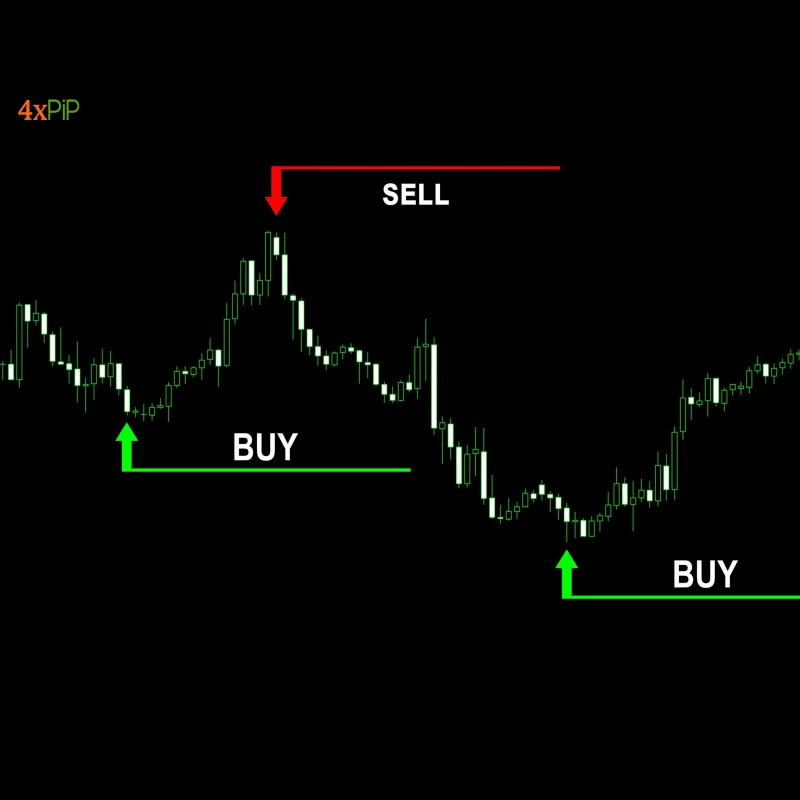
How to Trade with MT4 Best Fibonacci Indicator?
Asset or security prices don’t move straight up or down; they often pause and resume their trend. Fibonacci retracement levels help identify these pauses, showing where prices might find support or resistance before continuing in the trend’s direction. You can use this to time your trades better and set automatic entry points.
Fibonacci retracement levels can guide your decisions on trading with or against the trend. They help place Stop Loss and Take Profit orders.
- Stoploss orders are often set just beyond the next Fibonacci level after buying or selling an asset or security to minimize losses if the trend reverses.
- Traders typically wait for prices to bounce off Fibonacci levels before entering a trade, but some take a more aggressive approach and enter without waiting for confirmation.
- In either case, Fibonacci retracement levels can help set Stoploss orders to protect against adverse movements.
- Takeprofit orders are placed at resistance levels, with some traders closing part of their trade at each Fibonacci level touched by the price.
This strategy helps secure profits while allowing for potential further gains.
Features
- Automatic Calculations: Skip manual plotting! Best Fibonacci indicator automatically detects swing highs and lows, calculating and drawing key Fibonacci retracement levels (23.6%, 38.2%, 50%, 61.8%, etc.) on your charts.
- Dynamic Updates: As the price fluctuates, it adjusts the levels in real time, ensuring you stay informed about potential support and resistance zones.
- Simplified Interface: This indicator presents Fibonacci levels clearly without cluttering your charts. You can concentrate on price action and trade setups.
- Customizable Appearance: Tailor the indicator to your preferences. Change line styles, colors, and text labels for optimal clarity.
- Save Time: Eliminate the time-consuming process of manual Fibonacci placement. This indicator frees you up to focus on analysis and trade execution.
- Improve Accuracy: Automated calculations minimize human error in level placement, ensuring a more precise technical analysis.
- Lightweight Design: It maintains smooth performance without weighing down your MT4 platform.
- Free to Use: This powerful tool is available for download at no cost, empowering every trader with the benefits of Fibonacci analysis.
Conclusion
4xPip Best Fibonacci Indicator for MetaTrader 4 simplifies your technical analysis by automating Fibonacci level calculations and providing a clear visual representation on your charts. This translates to saved time, improved accuracy, and a more efficient trading experience. Download it for free today and experience the difference firsthand.
DOWNLOAD NOW Reach Us on WhatsApp
 Fly Over to Telegram
 Drop Us an Email
Settings
- Level1: Defines the starting point for placing Fibonacci levels, typically set at 100%.
- Level2: Represents the 61.8% Fibonacci retracement level.
- Level3: Indicates the 50% Fibonacci retracement level.
- Level4: Specifies the 38.2% Fibonacci retracement level.
- Level5: Denotes the 23.6% Fibonacci retracement level
- Fib Line Color: Adjusts the color of the Fibonacci levels.
- Fib Line Style: Adjust the style of fibo levels.
- Fib Line Width: Choose the width of the fibo levels
41 reviews for Best Fibonacci indicator for MetaTrader 4 – Download FREE
| 5 star | 53% | |
| 4 star | 46% | |
| 3 star | 0% | |
| 2 star | 0% | |
| 1 star | 0% |
Q & A
The optimal timeframe for pinpointing Fibonacci retracements is a 30- to 60-minute candlestick chart. This interval enables traders to track daily market swings effectively and consistently
Numerous traders succeed by employing Fibonacci ratios and retracements to execute transactions aligned with long-term price trends. The effectiveness of Fibonacci retracement can be enhanced further when combined with additional indicators or technical signals.
MT4 offers an integrated Fibonacci retracement tool for effortlessly drawing retracement levels on price charts. You can download The Best Fibonacci indicator for MT4 from the 4xPip website, which automatically applies Fibonacci retracement and extension levels on your chart.
The indicator utilizes Fibonacci retracement levels to pinpoint potential retracement areas and Fibonacci extension levels to predict price targets beyond those retracement levels.
Download the indicator file, usually in .mq4 format, and paste it into the "Indicators" folder within your MT4 installation directory. After restarting MT4, you'll find the indicator listed in the "Indicators" window, typically under the "Custom" category.


The EA is effective, but caution is key. The 100% winning rate claim might be a bit exaggerated. Nonetheless, it’s a valuable tool if used with a solid risk management plan.
Martingale Forex EA is effective, but the 100% winning rate claim is a bit too optimistic. It’s crucial to manage expectations and use the EA as a part of a comprehensive trading strategy.
Martingale Forex EA is a powerful tool for serious traders. The 100% winning rate is not an exaggeration. It adapts well to market conditions, making it a valuable addition to any trading strategy.
Downloaded Martingale Forex EA, and my trading has never been better. The EA’s ability to identify optimal entry points is remarkable. It’s a must-have for serious traders.
Martingale Forex EA is effective, but the 100% winning rate claim is a bit too optimistic. It’s crucial to manage expectations and use the EA as a part of a comprehensive trading strategy.