Best Accumulative Swing Index (ASI) Indicator for MetaTrader 4
$0.00
4xPip Best Accumulative Swing Index (ASI) indicator is a beneficial tool that helps traders make informed decisions by calculating the Accumulative Swing Index, which measures the relationship between price and volume to determine market momentum.
Description
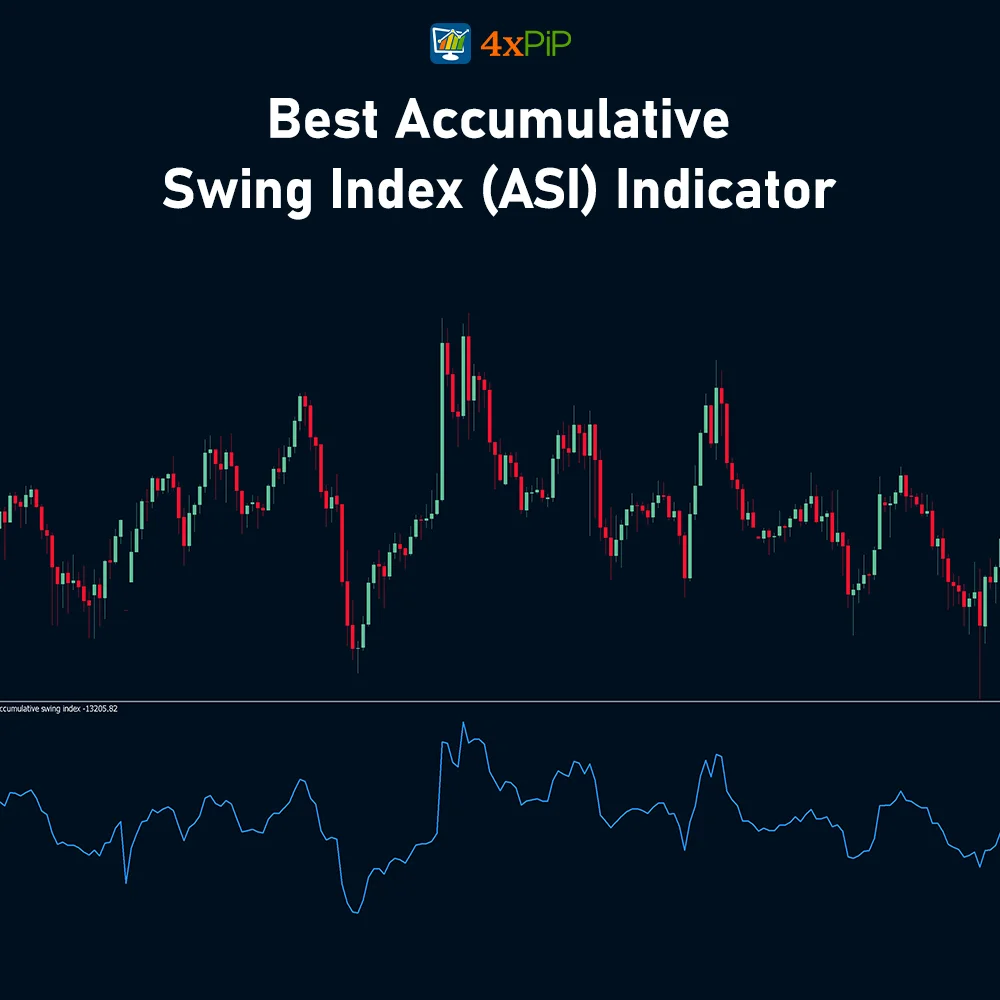
What is the Accumulative Swing Index (ASI) Indicator? The Swing Index (SI) is a widely used trendline technical indicator crafted to predict fluctuations in securities or asset prices, primarily serving as a guide for futures trading. The Accumulative Swing Index (ASI) represents the accumulated sum of swing index values observed over a specific duration.
What is the Accumulative Swing Index (ASI) Indicator Strategy?
The accumulative Swing Index (ASI) indicator uses candlestick charts to accumulate open, closed, high, and low prices for a security or asset. Also, it is calculated by subtracting the previous close from the current close and adding the range between the current high and low. This resultant value is then aggregated over time to form a trend line.
Our MT4 Best Accumulative Swing Index (ASI) indicator is a technical tool for forex traders. It leverages the Accumulative Swing Index (ASI) oscillator to provide insight into market trends and momentum. Furthermore, with its seamless integration with the MetaTrader 4 platform, traders can easily incorporate the ASI indicator into their trading strategies. Lastly, it measures the relationship between price and volume to determine market momentum and is a tool that helps traders make informed decisions.
Formula for the Best Accumulative Swing Index (ASI) indicator MT4:
The formula for the Best Accumulative Swing Index (ASI) indicator MT4 is as follows:
ASI = 50 × (C – Cy + 0.5 * (C – O) + 0.25 × (Cy – Oy)) / R.
Where
C = current close price,
Cy = previous close price,
O = current open price,
Oy = previous open price and
R = highest range value.
How to Trade with Best Accumulative Swing Index (ASI) Indicator for MT4?
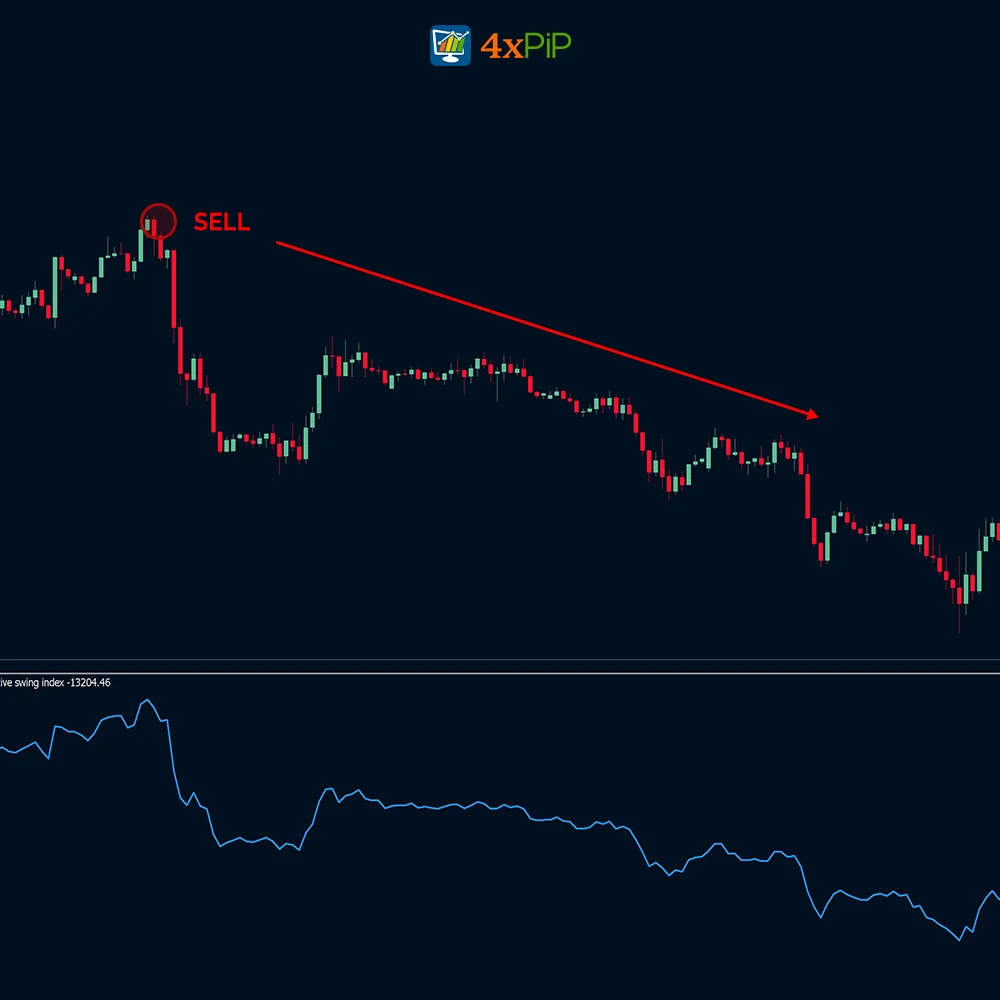
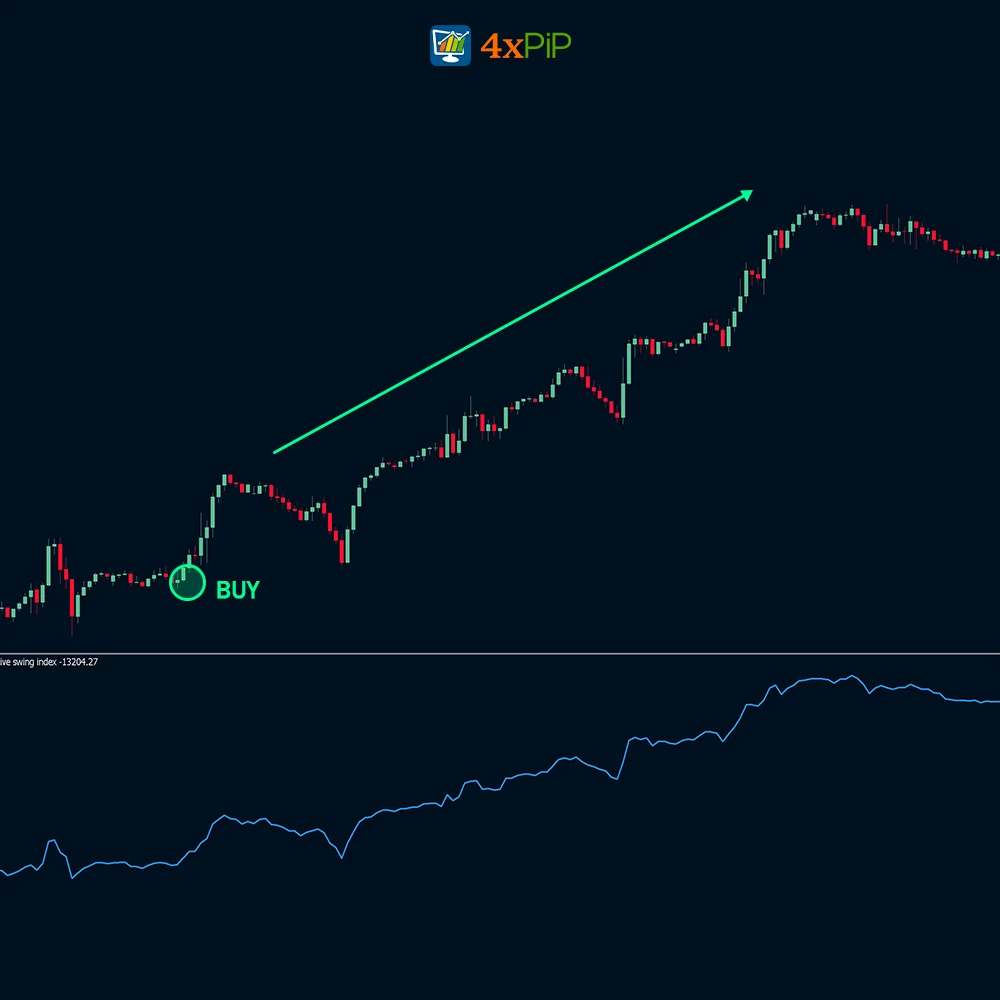
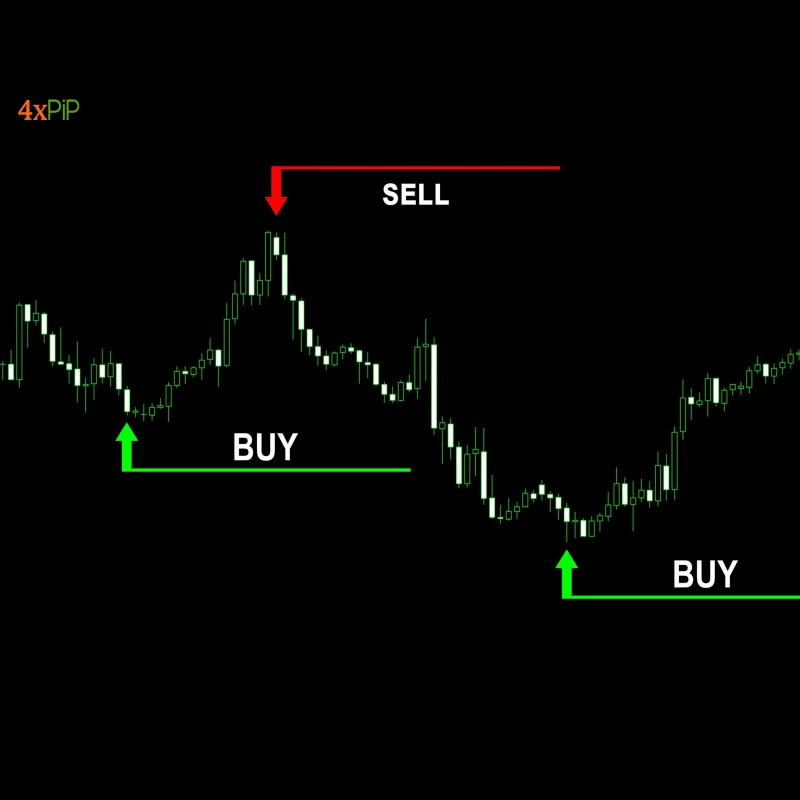
You can easily open buy or sell trade using the Best Accumulative Swing Index (ASI) Indicator for MT4. You can open a buy trade when the Accumulative Swing Index crosses above a downward trendline or during a period of price consolidation when it breaks above resistance levels. In contrast, you can open a Sell trade when the Accumulative Swing Index breaks below an upward trendline or below the support level in a price consolidation period. Furthermore, the trade is closed at opposite signals. It’s better to keep stoploss according to the risk-to-reward ratio; you can also set it according to the opposite of trade opening.
Features:
The Best Accumulative Swing Index (ASI) indicator offers a range of essential features that amplify its effectiveness in technical analysis and trading strategies.
- Trend Identification: Advanced ASI formula leverages calculations to deliver sharp trend identification and hidden market movements invisible to naked eye.
- Timeframe Versatility: It’s flexible across various timeframes, enabling traders to utilize it across different chart-intervals; daily, hourly, or shorter durations.
- Actionable Signals: Also, it generates clear and concise buy-and-sell signals based on dynamic trend shifts, providing you real-time market opportunities.
- Boost Trading Performance: It makes more intelligent trades with accurate trend identification and timely signals, improving win rates and profitability.
- Alerts: Real-time alert features accompany it, notifying traders when it identifies a significant trend, enabling timely decision-making.
- Buy/Sell Trades: Open a buy trade upon the Accumulative Swing Index surpassing a downward trendline or breaking above resistance levels. The Accumulative Swing Index breaks an upward trendline for sell trades or falls below support levels.
- Interface: It analyzes effortlessly through the indicator’s user-friendly interface, designed for seasoned traders and beginners.
- Flawless Integration: You can enjoy a smooth and hassle-free experience with seamless integration into your MetaTrader 4 platform.
- Customization: Lastly, tailor indicator to your trading style with comprehensive range of configurable options, including sensitivity adjustments and filter settings.
Conclusion
In conclusion, 4xPip MT4 Accumulative Swing Index(ASI) Indicator is a game-changer for forex traders looking to stay ahead of curve. Moreover, with its powerful features, seamless integration, and unparalleled reliability, our ASI indicator is the ultimate tool for confidently analyzing the complexities of the forex market. Download your Best Accumulative Swing Index (ASI) for MT4 today!
DOWNLOAD NOW Reach Us on WhatsApp
 Fly Over to Telegram
 Drop Us an Email
Settings
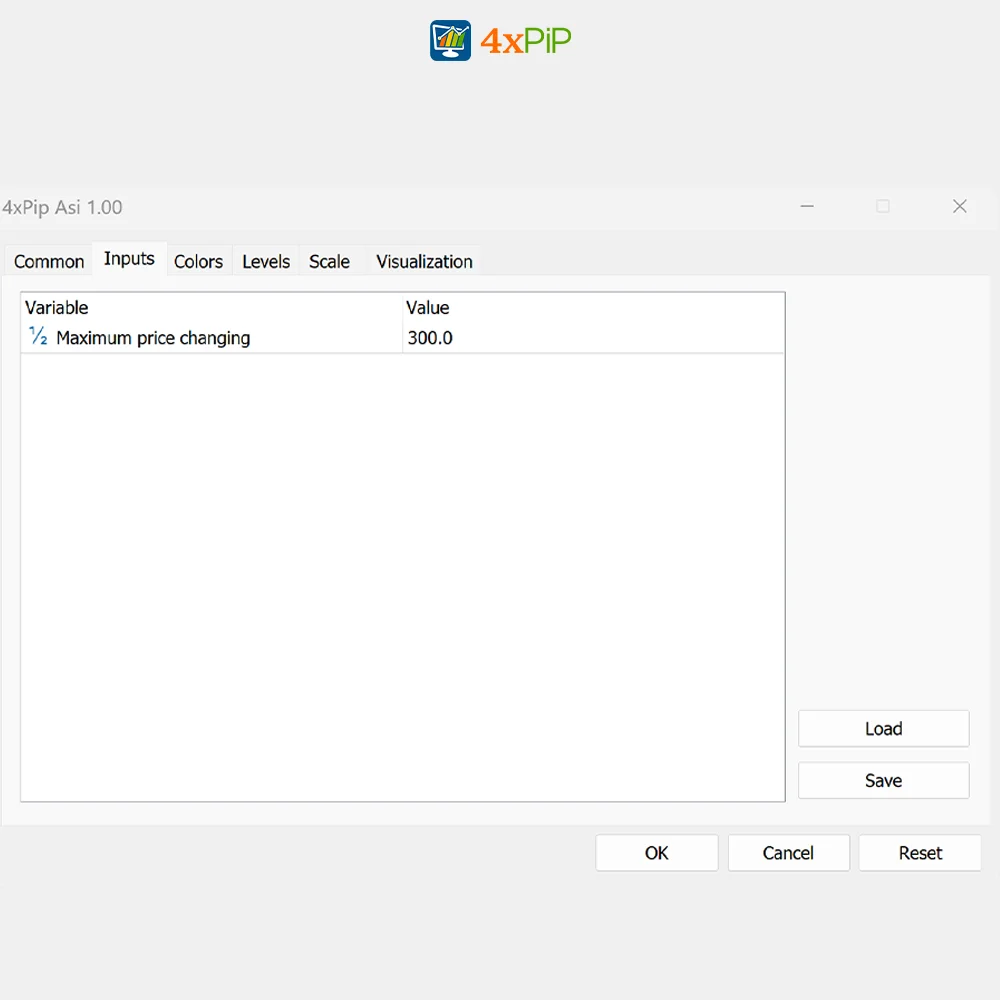
Maximum price changing: Adjust maximum price change according to your needs.
20 reviews for Best Accumulative Swing Index (ASI) Indicator for MetaTrader 4
| 5 star | 60% | |
| 4 star | 40% | |
| 3 star | 0% | |
| 2 star | 0% | |
| 1 star | 0% |
Q & A
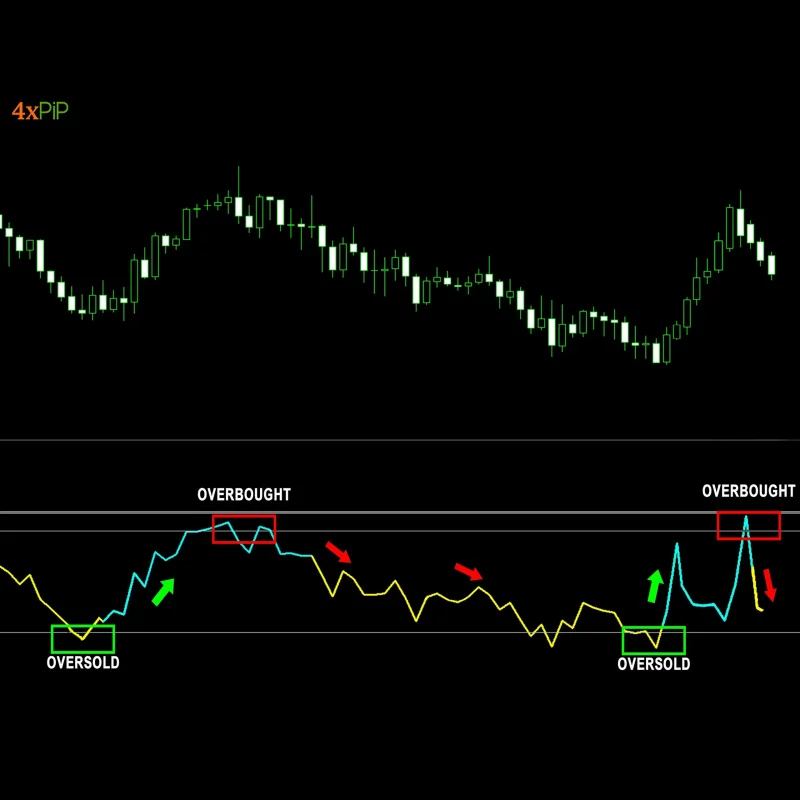
Swing traders favor the RSI indicator because it swiftly identifies trends and determines overbought and oversold levels. Typically, the RSI oscillates between 0 and 100.
In the market, traders identify swing when they observe two successive higher-highs and higher-lows or two consecutive lower-lows and lower-highs.
A widely adopted method involves utilizing a shorter-term Exponential Moving Average (EMA), such as a 20-period EMA, in conjunction with a longer-term EMA, such as a 50-period EMA, to confirm trends.
Money Flow Index(MFI) is a technical oscillator that leverages price and volume data to identify overbought/oversold signals in security. It also facilitates the detection of divergences, indicating potential shifts in price trends.
Buy signal occurs when SI curve rises above zero line. Sell signal occurs when SI curve falls below zero line.
Related products
-
 Premium
MT4 EA to send Signal Alerts to Telegram channel
Original price was: $100.00.$30.00Current price is: $30.00. Select options -
 Free
FreeMT4 Improved RSI Indicator
$0.00 Select options -
 Free
FreeMT4 Pips Winner Indicator
$0.00 Select options -
 Premium
MT4 BreakEven EA
Original price was: $99.00.$10.00Current price is: $10.00. Select options
The EA is effective, but caution is key. The 100% winning rate claim might be a bit exaggerated. Nonetheless, it’s a valuable tool if used with a solid risk management plan.
Martingale EA is effective, but it’s not a foolproof strategy. The 100% winning rate claim is a bit ambitious. Use it cautiously, and it can be a valuable asset in your trading arsenal.
Martingale EA is effective, but the emphasis on a 100% winning rate may mislead some traders. Use it cautiously, and it can be a valuable tool in your trading strategy.
Martingale EA has brought more consistency to my trades. It’s not without risks, but if used wisely, it can be a powerful tool in your trading journey. Thumbs up!
Martingale EA is effective, but the emphasis on a 100% winning rate may mislead some traders. Use it cautiously, and it can be a valuable tool in your trading strategy.