Trend Dashboard Scanner Indicator using Stochastic, CCI, RSI for MT4 – FREE Download
$0.00
The Trend Dashboard Scanner Indicator using Stochastic, CCI, and RSI is a powerful multi-indicator dashboard tool designed for the MetaTrader 4 platform. This indicator combines three widely used momentum indicators—Stochastic Oscillator, Commodity Channel Index (CCI), and Relative Strength Index (RSI)—to provide traders with a clear overview of market trends and momentum conditions.
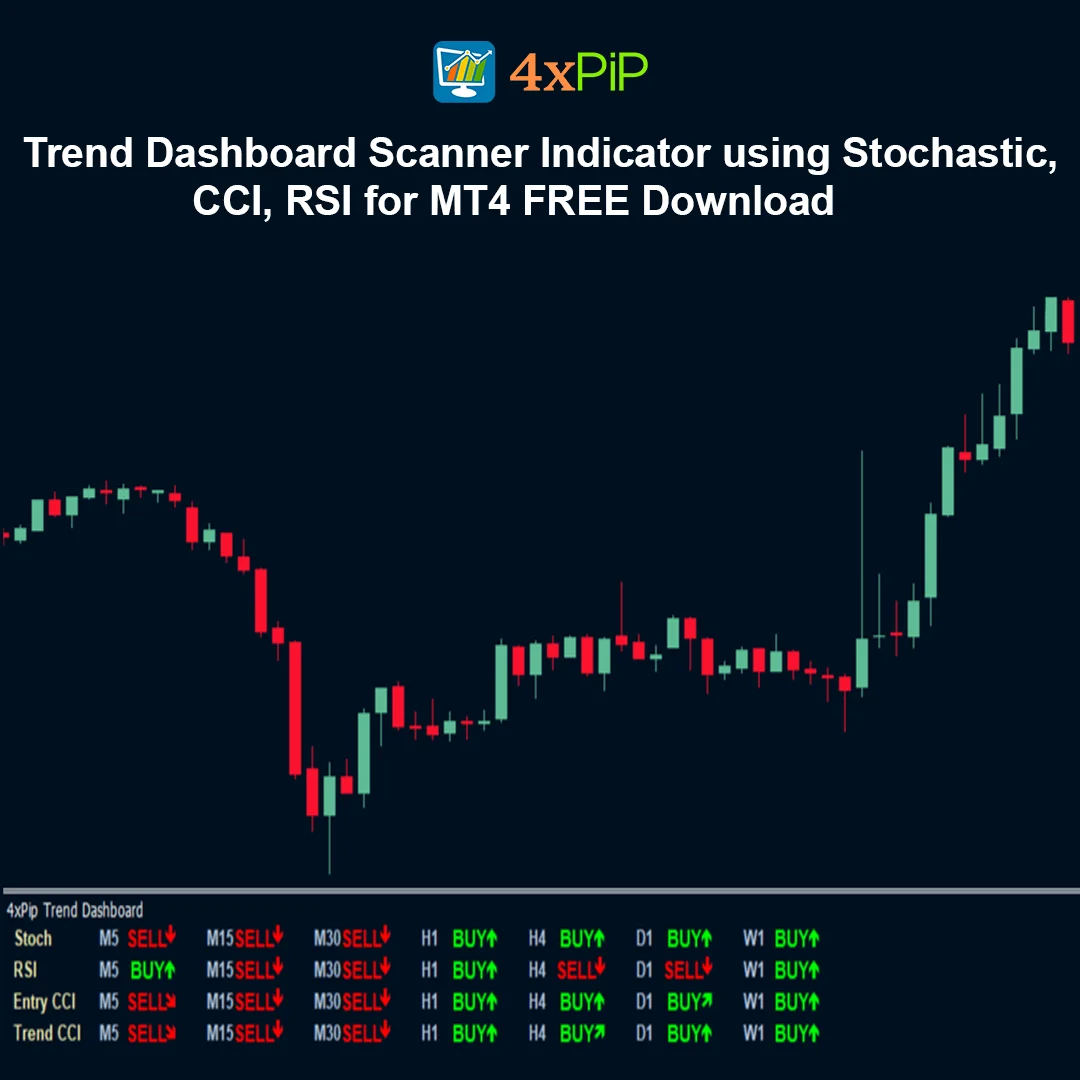
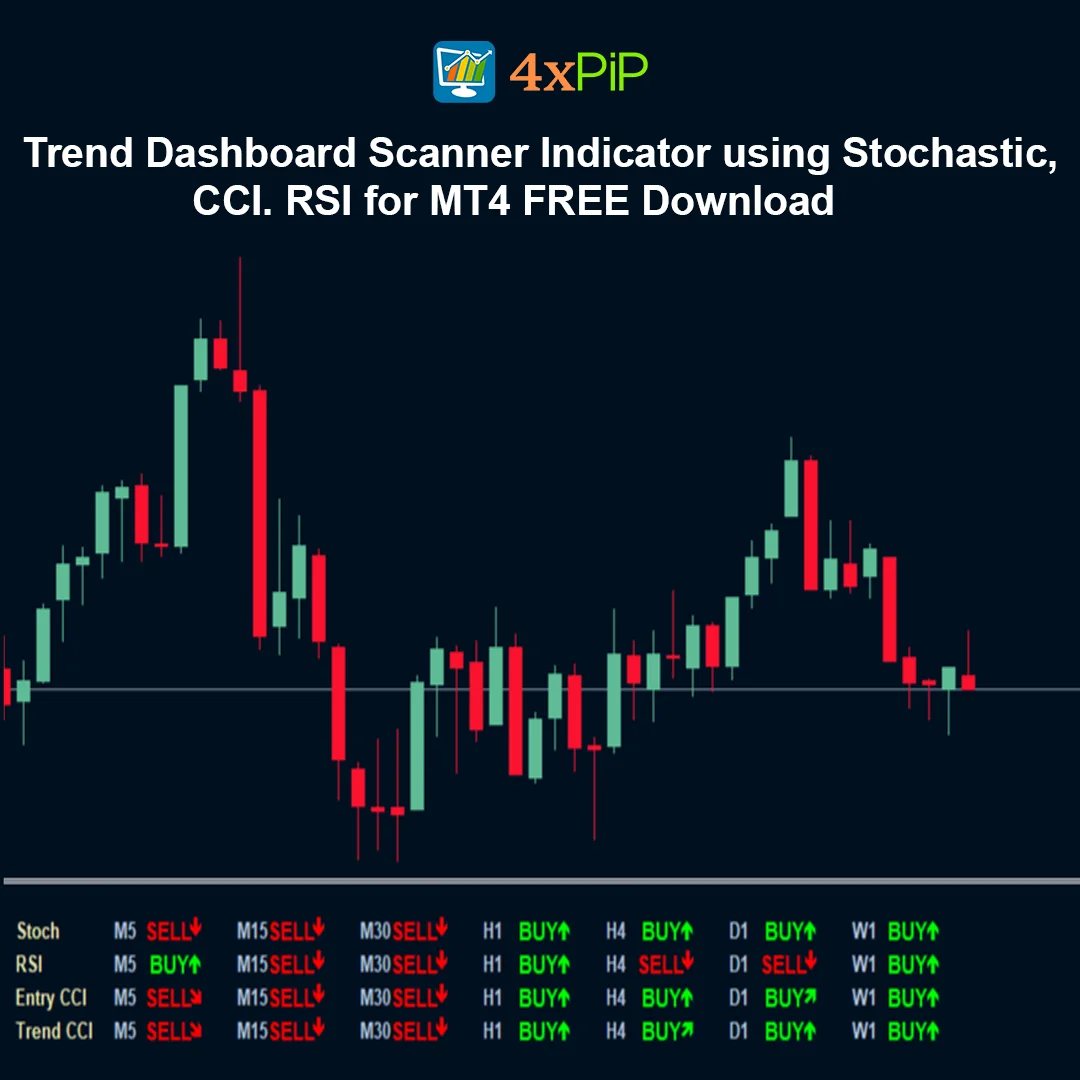
Instead of manually checking multiple indicators on different charts, the dashboard scans the market and displays signals in a simple visual format. This helps traders quickly identify bullish, bearish, or neutral market conditions across different instruments or timeframes.
By combining the analytical strengths of Stochastic, CCI, and RSI, this indicator allows traders to evaluate trend direction, momentum strength, and possible reversal points more efficiently.
Description
What is the Trend Dashboard Scanner Indicator?
The Trend Dashboard Scanner Indicator is a multi-indicator tool that analyzes market conditions using Stochastic, CCI, and RSI indicators and displays the results in a convenient dashboard format.
What indicators are used in this dashboard?
The dashboard uses three popular momentum indicators:
- Stochastic Oscillator to identify overbought and oversold levels
- Commodity Channel Index (CCI) to detect trend strength and possible reversals
- Relative Strength Index (RSI) to measure market momentum and strength
How does the indicator work?
The indicator continuously analyzes price data using the three indicators and displays their signals in a dashboard. This allows traders to quickly determine whether the market is bullish, bearish, or neutral.
What information does the dashboard show?
The dashboard shows the signals generated by Stochastic, CCI, and RSI, helping traders understand the overall trend and momentum conditions.
Why combine multiple indicators?
Using multiple indicators helps confirm trading signals and reduce false signals. When several indicators point in the same direction, the trading signal becomes stronger.
Who can use this indicator?
Both beginner and experienced traders can benefit from this indicator, especially those who want to analyze market momentum quickly.
Advantages
- Combines three powerful momentum indicators.
- Provides a clear dashboard view of market conditions.
- Saves time by scanning indicators automatically.
- Helps identify trend direction quickly.
- Reduces the need to analyze multiple indicators manually.
- Useful for monitoring multiple trading opportunities.
- Works across different financial markets.
- Compatible with all MetaTrader 4 timeframes.
- Helps confirm trading signals.
- Completely free indicator.
Features
- Multi-indicator dashboard display.
- Uses Stochastic, CCI, and RSI indicators.
- Real-time market scanning.
- Visual signals for bullish and bearish trends.
- Helps detect momentum shifts quickly.
- Works on all chart timeframes.
- Compatible with all trading instruments in MetaTrader 4.
- Lightweight and optimized for smooth platform performance.
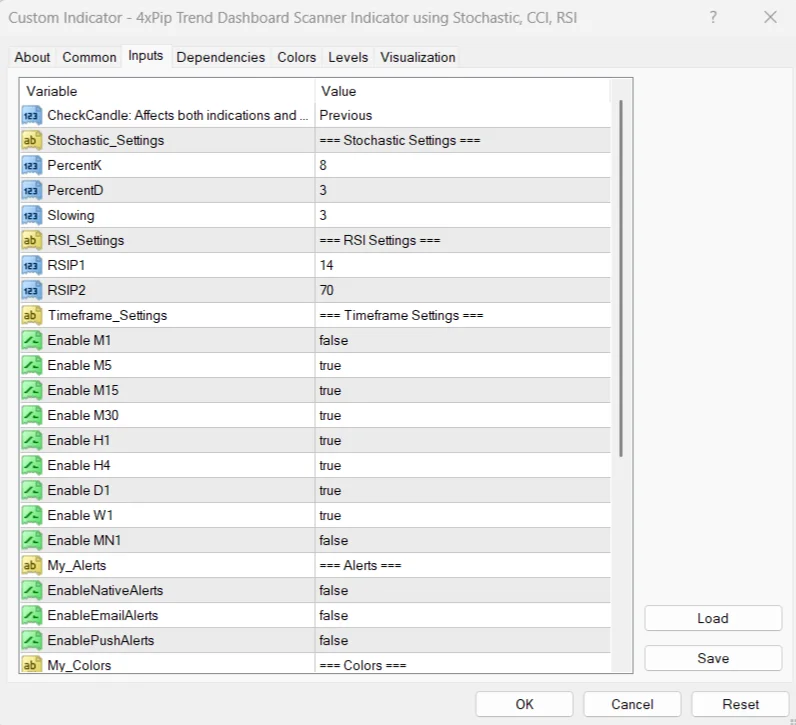
- Customizable indicator settings.
- Suitable for manual and automated trading strategies.
How to Trade
The Trend Dashboard Scanner Indicator helps traders evaluate market momentum using signals from Stochastic, CCI, and RSI. When several indicators show bullish signals simultaneously, it may indicate strong buying momentum and traders may consider potential buying opportunities. When the indicators show bearish signals together, it may suggest strong selling pressure and traders may look for selling opportunities. Traders typically confirm these signals using price action, support and resistance levels, or trend indicators before entering trades. The dashboard format allows traders to monitor market conditions quickly and identify potential trading opportunities more efficiently.
Indicator Logic
The indicator combines signals from three technical indicators:
- Stochastic Oscillator – measures market momentum and identifies overbought or oversold conditions.
- Commodity Channel Index (CCI) – measures price deviation from its average and helps detect trend reversals.
- Relative Strength Index (RSI) – evaluates momentum strength and potential turning points.
When these indicators align in the same direction, the probability of a stronger trend signal increases.
Conclusion
The Trend Dashboard Scanner Indicator using Stochastic, CCI, and RSI is a practical tool for traders who want a quick and efficient overview of market momentum. By combining three widely used indicators into a single dashboard, it simplifies technical analysis and helps traders identify potential trading opportunities faster. This makes it a valuable addition to any MetaTrader 4 trading setup.
DOWNLOAD NOW Reach Us on WhatsApp
 Fly Over to Telegram
 Drop Us an Email
FAQ's
Q & A
Related products
-
 Premium
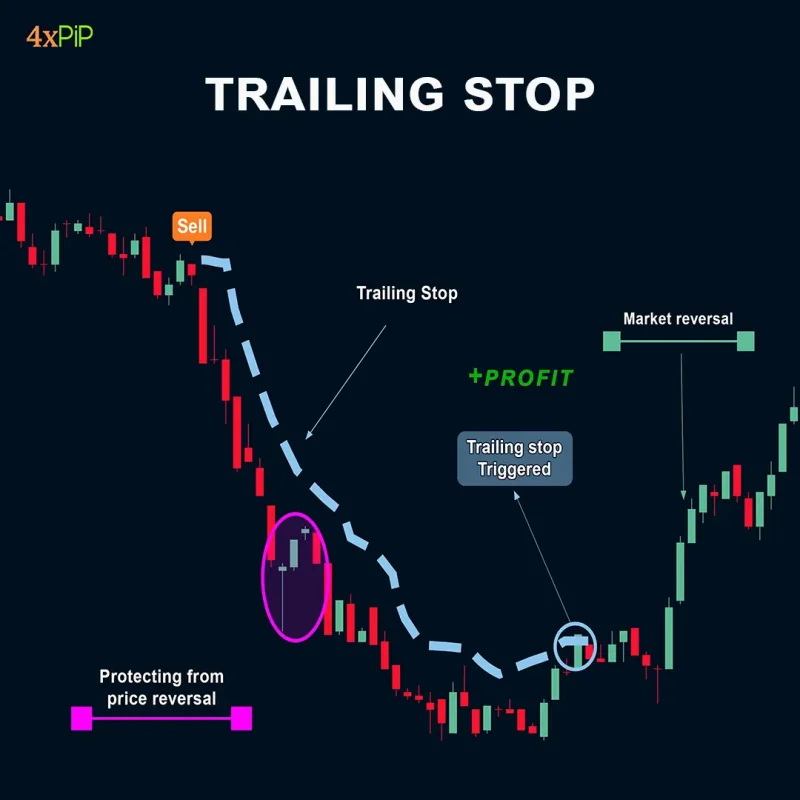
MT4 Trailing Stop EA
Original price was: $99.00.$10.00Current price is: $10.00. Select options -
 Premium
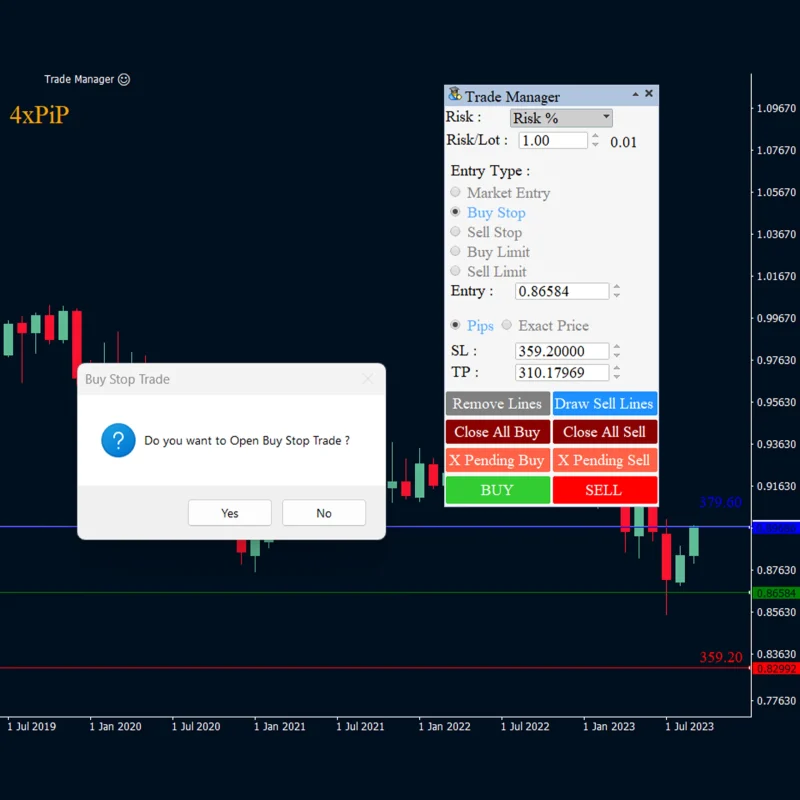
FOREX TRADE MANAGER MT4 EA
Original price was: $249.00.$49.00Current price is: $49.00. Select options -
 Free
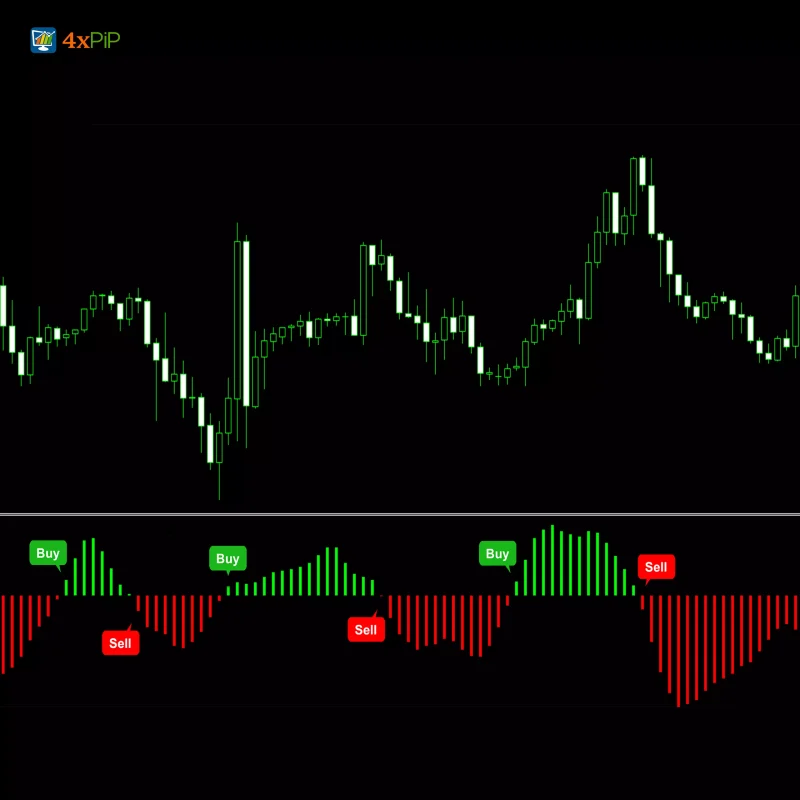
FreeMT4 Fisher Indicator
$0.00 Select options -
 Free
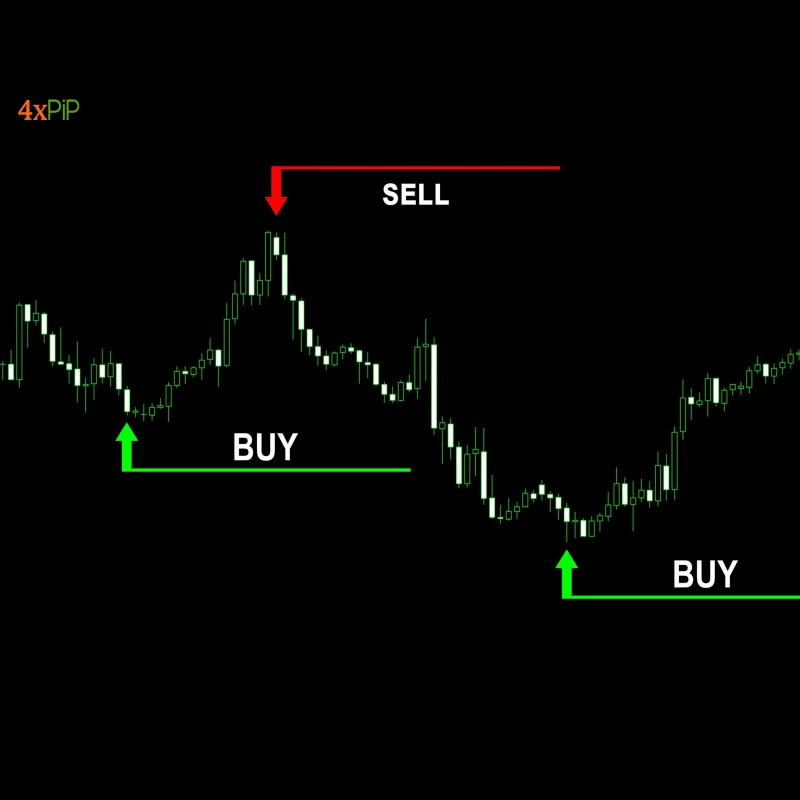
FreeMT4 Pips Winner Indicator
$0.00 Select options
Reviews
There are no reviews yet