Bollinger Bands RSI Super Smooth indicator for MetaTrader 4 FREE Download
$0.00
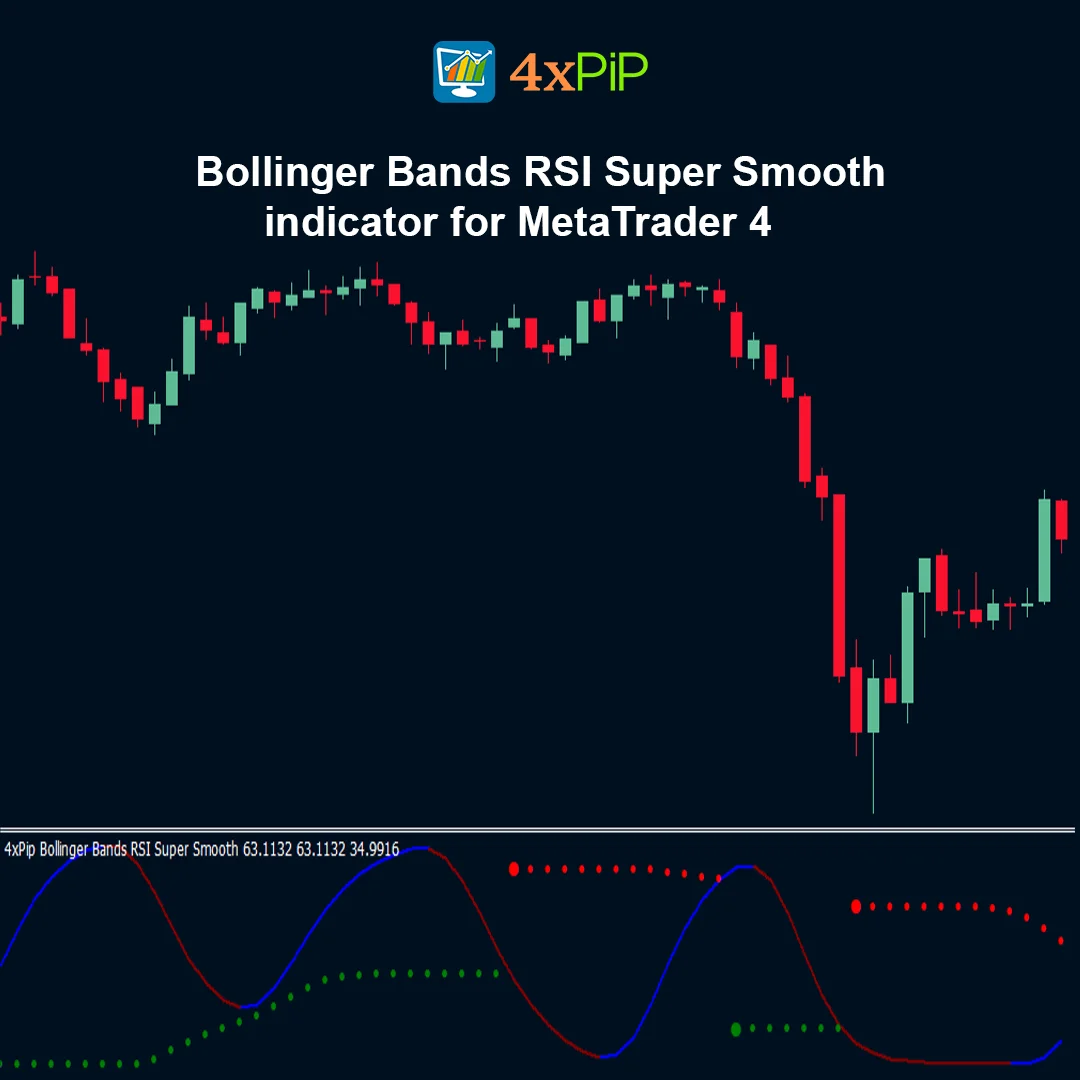
The Bollinger Bands RSI (BB-RSI) indicator for MetaTrader 4 is a powerful hybrid oscillator that combines Relative Strength Index momentum analysis with Bollinger Bands. By plotting volatility bands directly around the RSI line, the indicator helps traders identify overbought and oversold reversals, trend strength, and momentum breakouts more clearly.
Description
What is the Bollinger Bands RSI indicator?
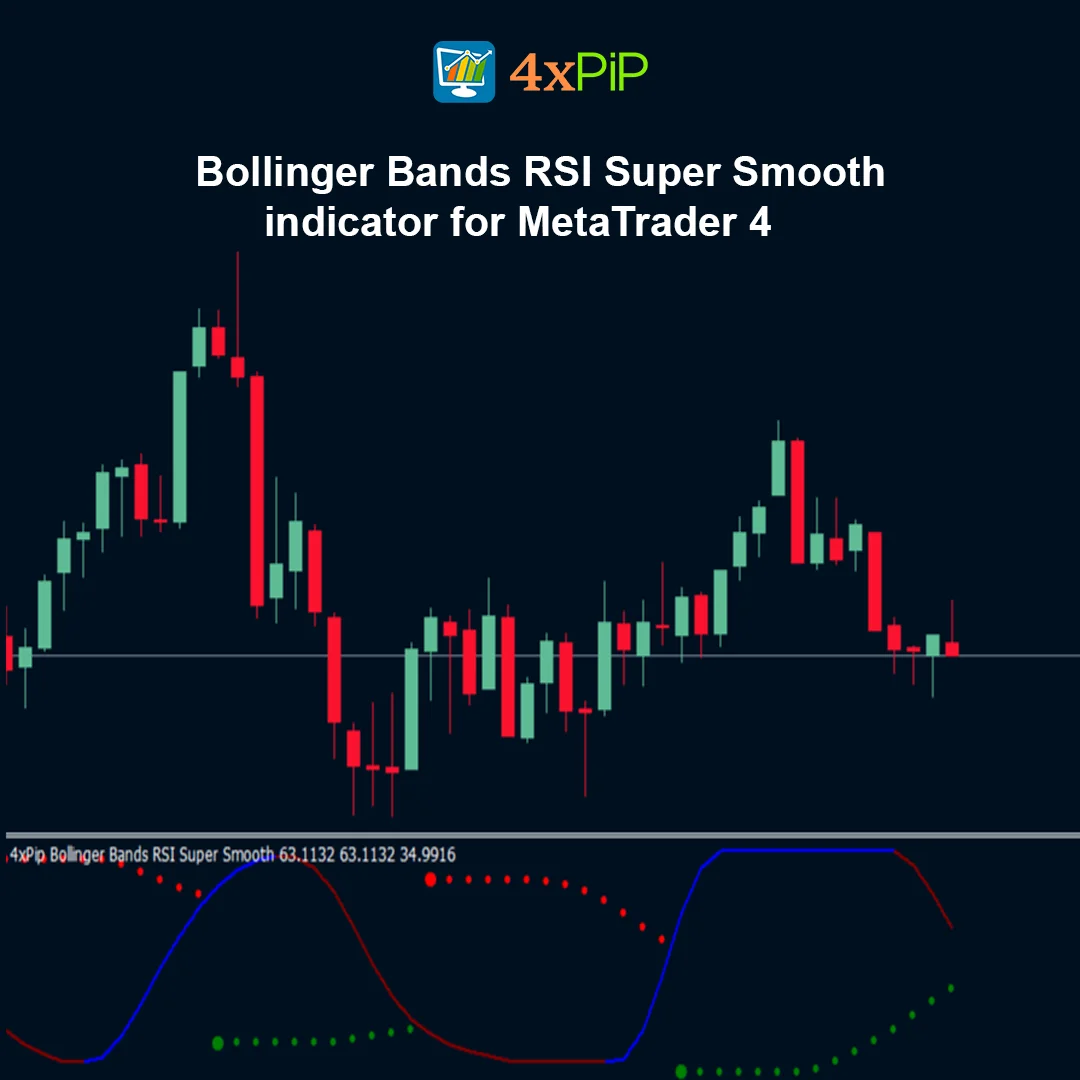
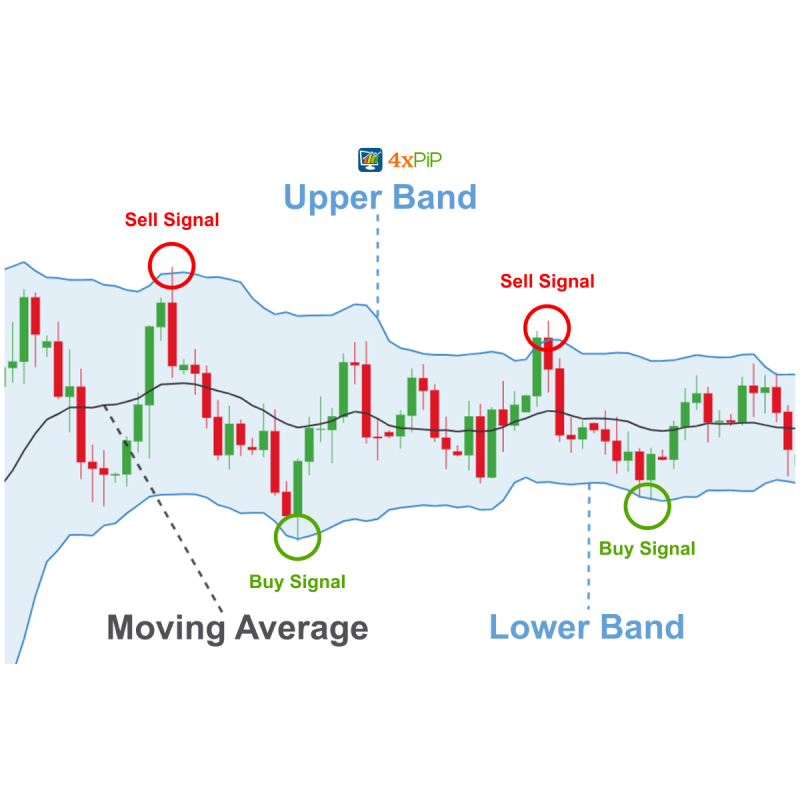
The Bollinger Bands RSI indicator is a modified oscillator that places Bollinger Bands around the RSI instead of price. This approach allows traders to analyze the strength of momentum while also measuring volatility changes in the RSI movement. When the RSI line touches or breaks the upper or lower bands, it often signals that the market momentum is reaching an extreme level.
How does the indicator detect reversals?
The indicator identifies potential reversal points by observing when the RSI line breaks outside the Bollinger Bands. If the RSI moves above the upper band, the market may be overbought and a downward correction could follow. Conversely, if the RSI drops below the lower band, the market may be oversold and a potential bullish reversal might occur.
Why combine Bollinger Bands with RSI?
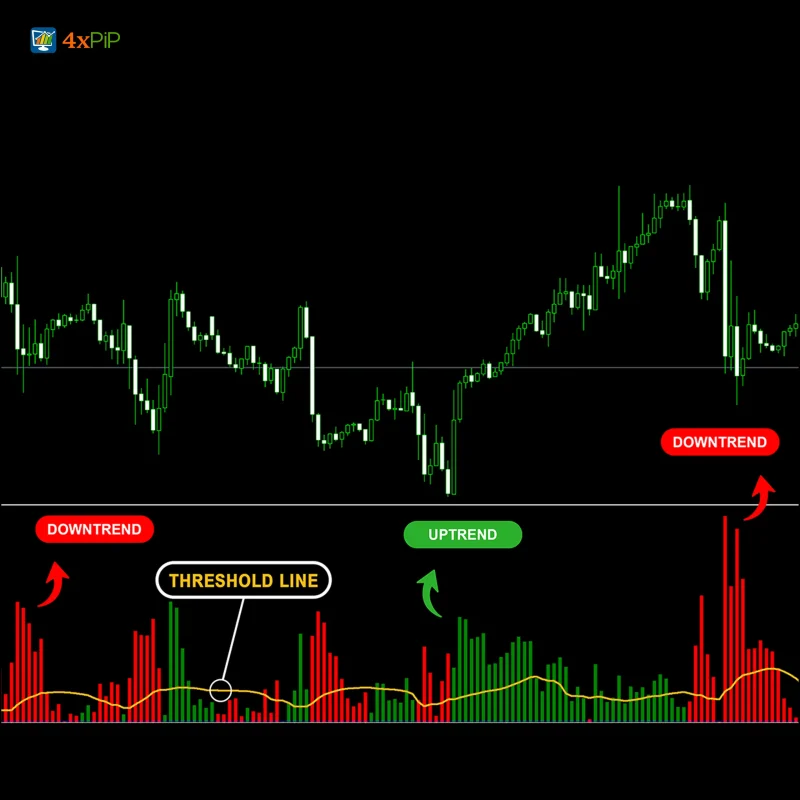
Combining Bollinger Bands with RSI enhances the accuracy of momentum analysis. While RSI alone measures market strength, adding volatility bands helps determine whether the momentum movement is unusually strong or weak. This combination allows traders to spot trend exhaustion, strong breakouts, and potential reversals more effectively than using a single indicator.
What are the different variants of the BB-RSI indicator?
Several free versions of the BB-RSI indicator are available in the trading community. Some variants use the standard RSI formula with Bollinger Bands, while others include smoothed or advanced RSI calculations using moving averages to reduce noise. These improved versions help traders filter false signals and analyze trends more smoothly.
Advantages
- Combines momentum and volatility analysis in one indicator.
- Helps identify overbought and oversold market conditions.
- Detects potential trend reversals earlier.
- Reduces false signals with volatility confirmation.
- Useful for trend-following and reversal strategies.
- Simple visual interpretation with RSI and bands.
- Supports different trading styles and strategies.
- Helps confirm trend strength and momentum breakouts.
- Available in several customizable versions.
- Free to download and use on the MetaTrader platform.
Features
- Combines RSI with Bollinger Bands.
- Plots volatility bands around the RSI oscillator.
- Identifies overbought and oversold conditions clearly.
- Helps detect momentum breakouts.
- Available in standard and smoothed versions.
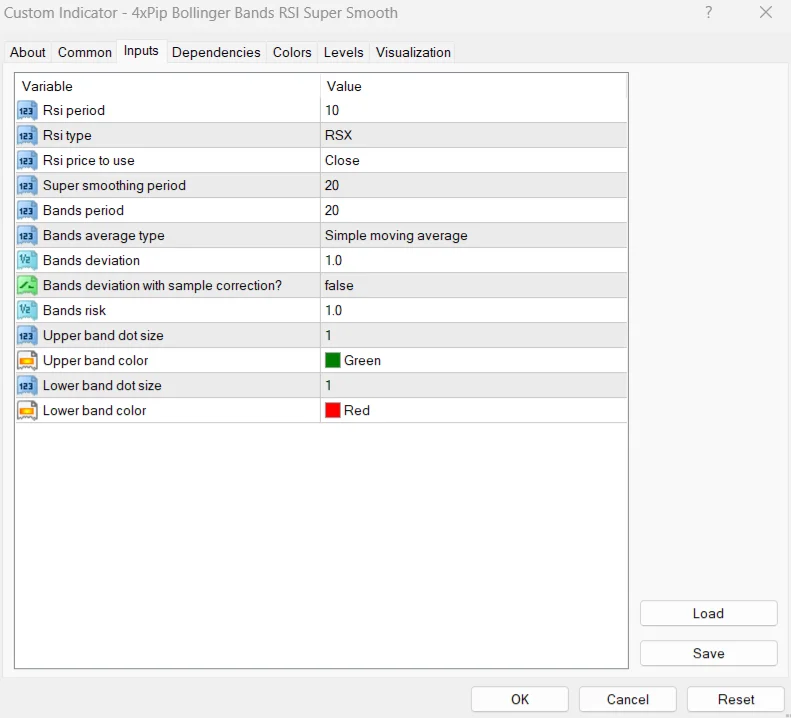
- Customizable RSI period and band settings.
- Works on all symbols and timeframes.
- Helps confirm trend continuation or exhaustion.
- Lightweight and easy to install.
- Compatible with most MT4 trading strategies.
How to Trade
Attach the indicator to your chart in MetaTrader 4.Observe the RSI movement relative to the Bollinger Bands.When RSI breaks above the upper band, watch for a possible sell setup.When RSI drops below the lower band, look for a potential buy opportunity.Confirm signals with price action, trend indicators, or support and resistance levels.Use proper risk management when entering trades.
Formula
The indicator combines the calculations of RSI and Bollinger Bands.
RSI Calculation:
RSI = 100 − (100 ÷ (1 + RS))
Where:
RS = Average Gain ÷ Average Loss
Bollinger Bands Applied to RSI:
Middle Band = Moving Average of RSI
Upper Band = MA(RSI) + (Standard Deviation × Deviation)
Lower Band = MA(RSI) − (Standard Deviation × Deviation)
Conclusion
The Bollinger Bands RSI (BB-RSI) indicator for MetaTrader 4 is a versatile trading tool that merges the strengths of momentum analysis and volatility measurement. By applying Bollinger Bands to the RSI oscillator, traders gain deeper insights into market conditions and can identify reversal opportunities more effectively.
This indicator is especially useful for traders who want to detect momentum extremes, breakout signals, and potential trend reversals using a simple yet powerful oscillator.
DOWNLOAD NOW Reach Us on WhatsApp
 Fly Over to Telegram
 Drop Us an Email

Reviews
There are no reviews yet