MACD RSI Oscillator indicator MetaTrader 5 FREE Download
$0.00
The MACD RSI Oscillator for MetaTrader 5 is a dual-concept momentum and trend indicator that combines MACD structure with RSI sensitivity. Designed for multi-timeframe analysis, it detects divergences, crossover signals, and trend reversals across Forex, crypto, stocks, indices, and other markets. It provides clear histogram transitions and EMA crossovers for precise entry and exit timing.
Description
What is MACD RSI Oscillator for MetaTrader 5?
The MACD RSI Oscillator for MetaTrader 5 merges two of the most widely used technical tools into one unified system.
Unlike traditional MACD-only indicators, this version:
- First calculates RSI values
- Then applies the MACD algorithm
- Produces a refined momentum profile
This structure allows traders to:
- Identify trend acceleration
- Detect bullish and bearish divergences
- Confirm reversal zones
- Improve entry and exit timing
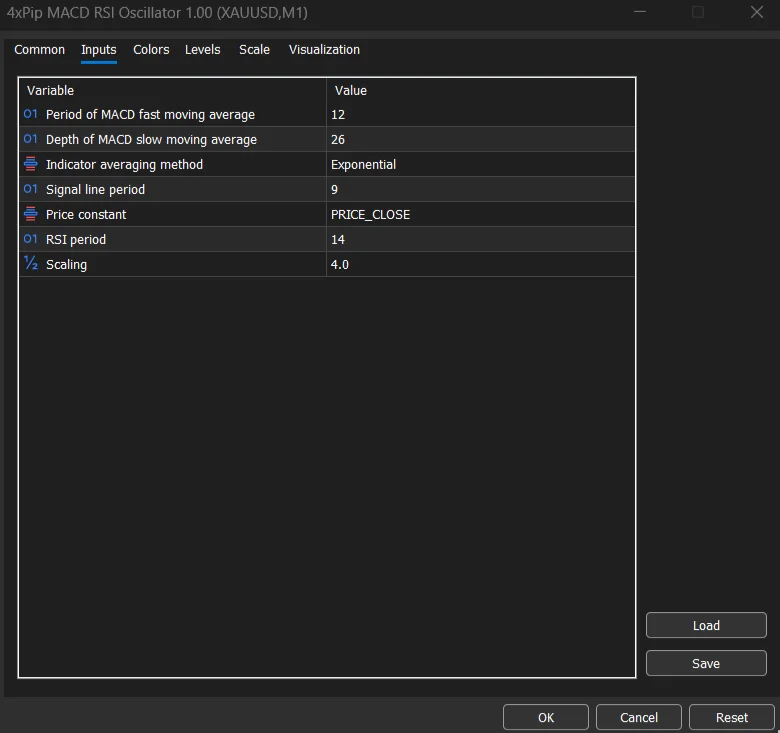
The indicator uses:
- Fast EMA
- Slow EMA
- Signal SMA
- Histogram volume transitions
- Caliber sensitivity setting for divergence adjustment
Signals are generated through:
- EMA crossover events
- Histogram phase shifts (positive/negative transitions)
Advantages
- Combines RSI momentum with MACD trend logic.
- Detects early trend reversals.
- Identifies bullish and bearish divergences.
- Suitable for multi-timeframe analysis.
- Works across Forex, crypto, stocks, and indices.
- Provides clear visual crossover signals.
- Histogram simplifies momentum interpretation.
- Customizable sensitivity settings.
- Ideal for day trading strategies.
- Free and easy to install on MT5.
Features
- Fast EMA parameter for short-term responsiveness.
- Slow EMA for long-term trend direction.
- Signal SMA for smoothing.
- RSI period customization.
- Caliber setting for divergence detection control.
- Histogram-based momentum visualization.
- Dual confirmation system (crossover + phase shift).
- Multi-timeframe compatibility.
- Real-time signal updates.
- Optimized performance for MT5 environment.
How to Trade
Buy Signal
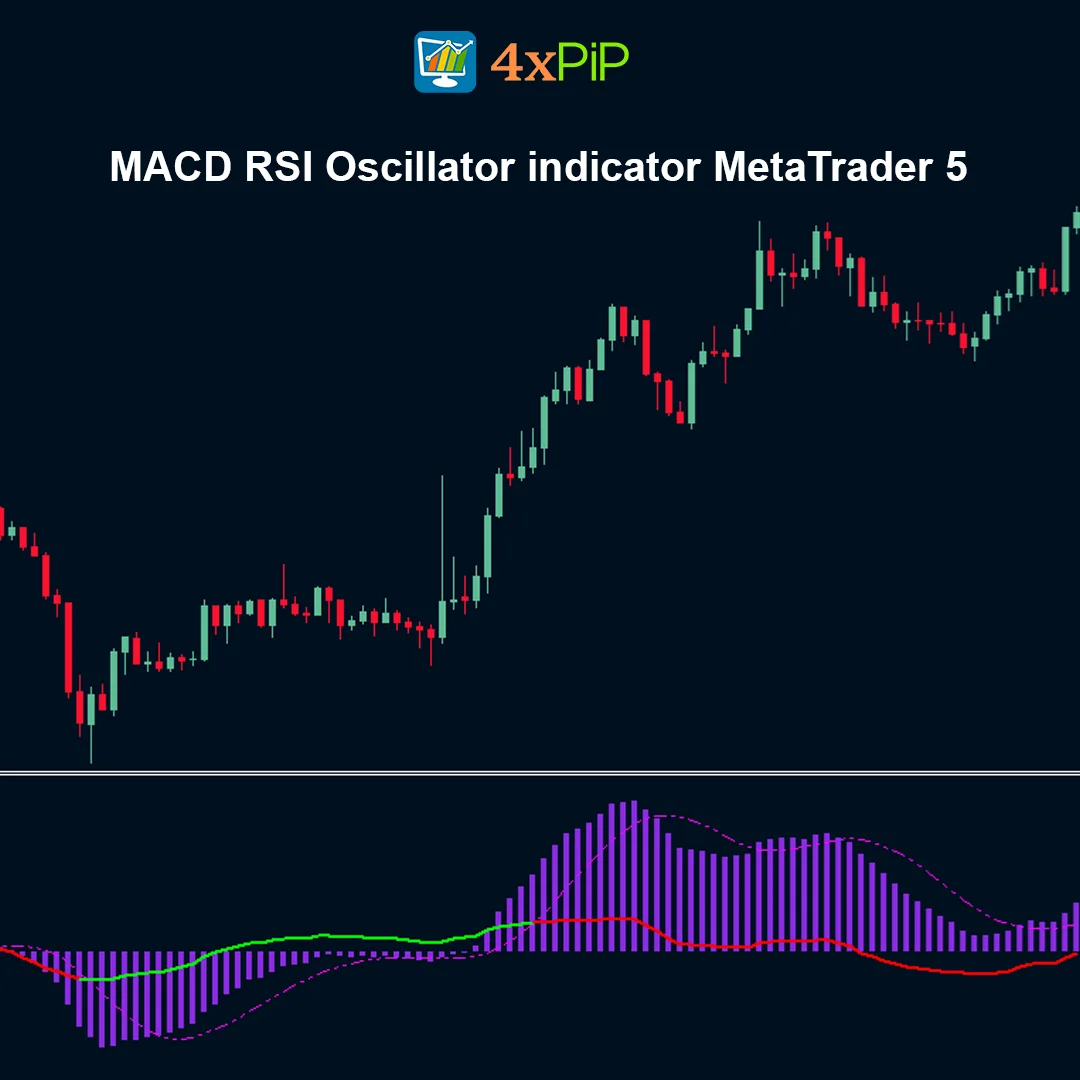
Example: NZD/USD – 1H Chart
Conditions:
- Red EMA crosses above pink dashed line (turns green).
- Histogram moves from negative to positive zone.
This dual confirmation indicates:
- Bullish momentum building
- Trend acceleration
- Potential buy opportunity
Sell Signal
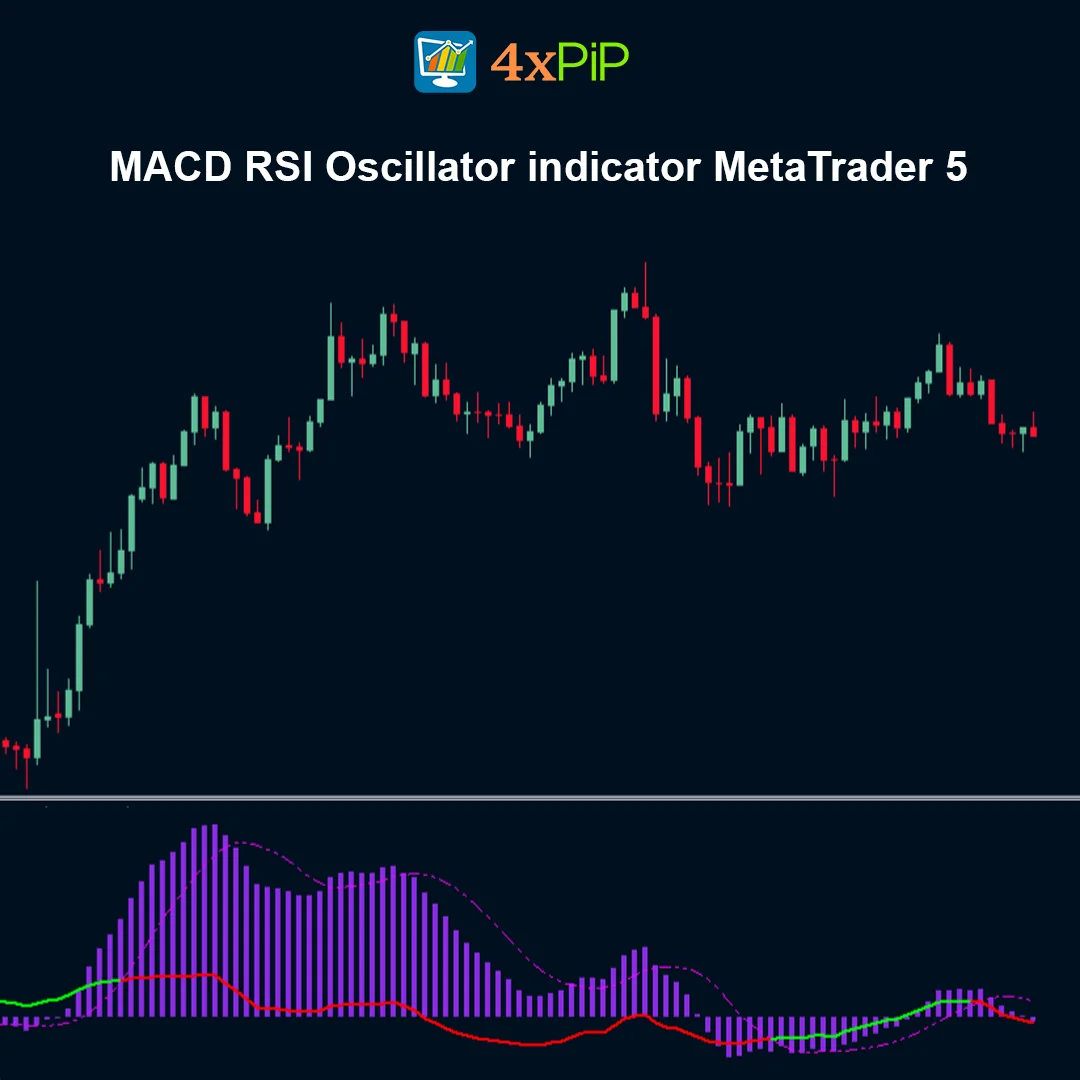
Example: BNB – 30M Chart
Conditions:
- Green EMA crosses below pink dashed line (turns red).
- Histogram shifts from positive to negative.
This suggests:
- Bearish momentum increase
- Trend reversal possibility
- Potential sell entry
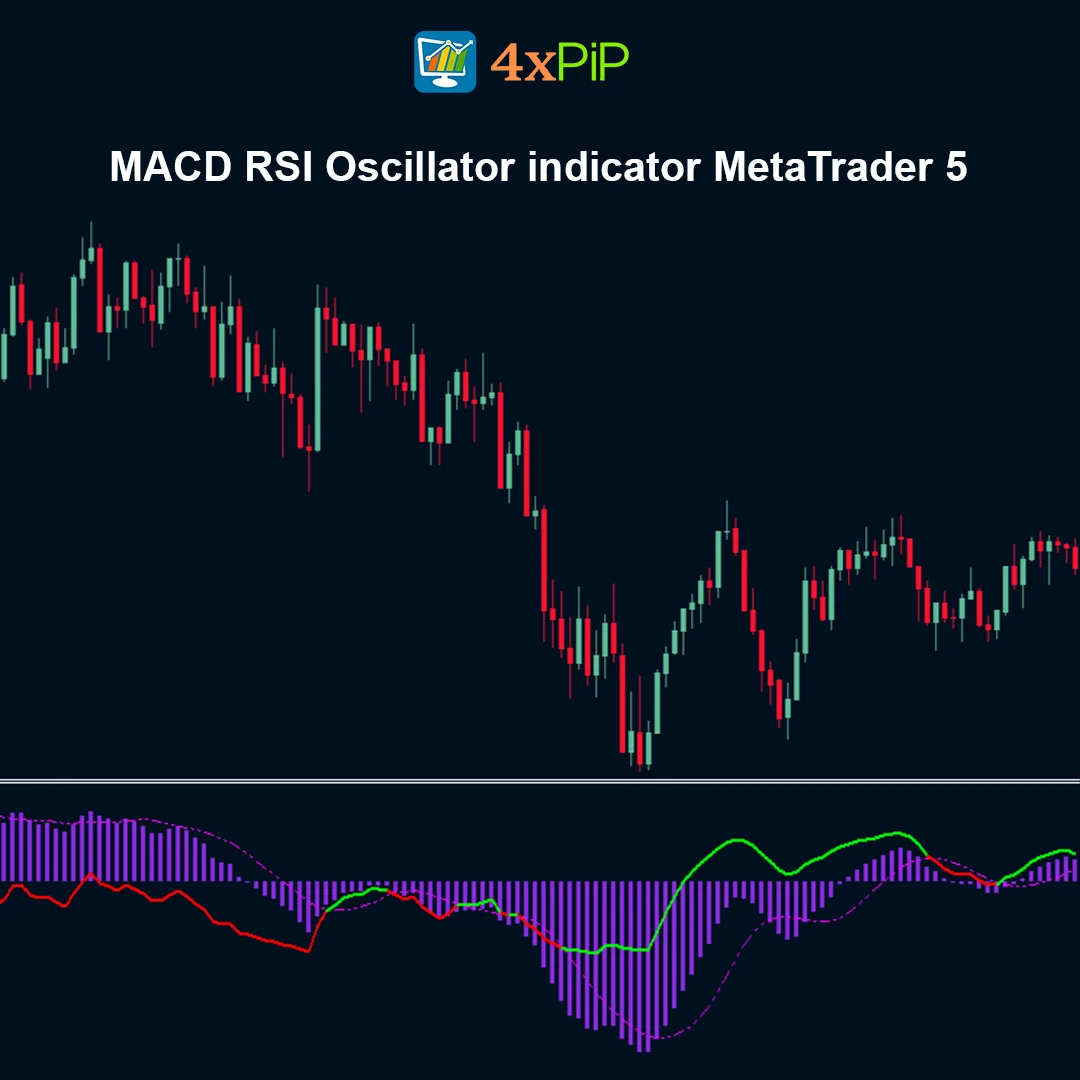
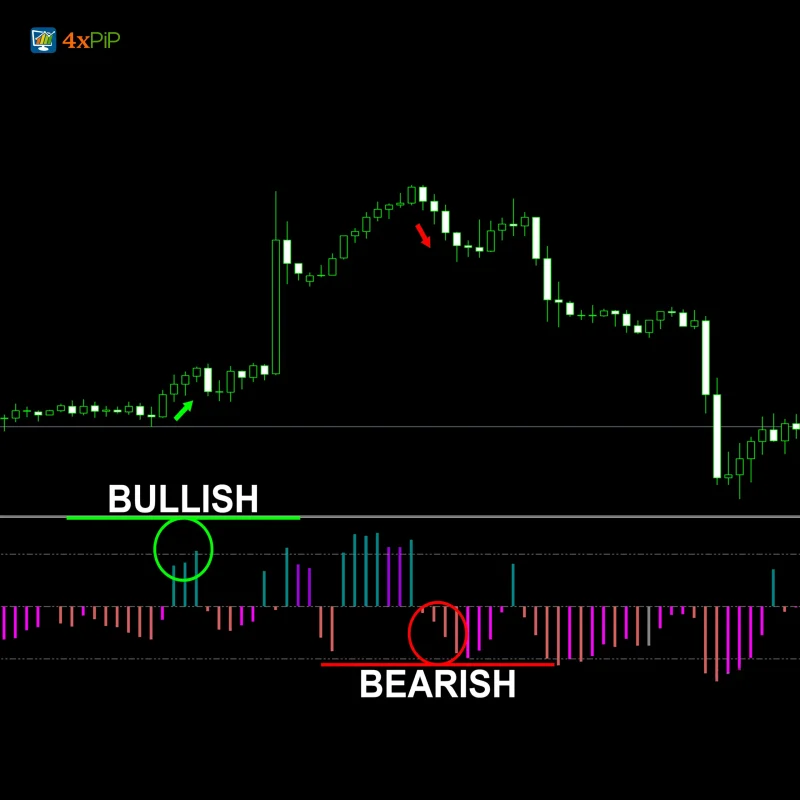
Divergence Strategy
- Price makes higher high, oscillator makes lower high → Bearish divergence.
- Price makes lower low, oscillator makes higher low → Bullish divergence.
- Divergence signals are strengthened by the Caliber setting.
Formula / Logic
Step 1: RSI Calculation
- Standard RSI formula applied over selected period.
Step 2: MACD Structure
- MACD Line = Fast EMA − Slow EMA
- Signal Line = SMA of MACD Line
- Histogram = MACD Line − Signal Line
Step 3: Combined Oscillator Output
- RSI values influence momentum sensitivity.
- MACD structure determines trend direction.
- Histogram phase transition confirms signals.
Step 4: Divergence Sensitivity
- Caliber parameter adjusts how strongly divergences are detected.
Conclusion
The MACD RSI Oscillator for MetaTrader 5 is a powerful hybrid tool that blends trend-following and momentum analysis into a single streamlined indicator. By combining EMA crossovers, histogram transitions, and RSI-based momentum filtering, it provides clear reversal signals and improved trade timing.
Its compatibility with Forex, cryptocurrencies, stocks, indices, and other markets makes it a versatile choice for traders seeking structured confirmation signals and enhanced market analysis.
DOWNLOAD NOW Reach Us on WhatsApp
 Fly Over to Telegram
 Drop Us an Email
FAQ's
Q & A
Related products
-
 Free
FreeAuto Risk-Based Lot for MT5 EA
$30.00 Select options -
 Free
FreeMT5 EA Drawdown Limiter
Original price was: $100.00.$10.00Current price is: $10.00. Select options -
 Premium
MT5 EA to send Signal Alerts to Telegram channel
Original price was: $199.00.$49.00Current price is: $49.00. Select options -
 Free
FreeMT5 MACD Explained Indicator
$0.00 Select options
Reviews
There are no reviews yet