Colored Bollinger Bands Indicator Narrowing and Widenning Phases – indicator for MetaTrader 4
$0.00
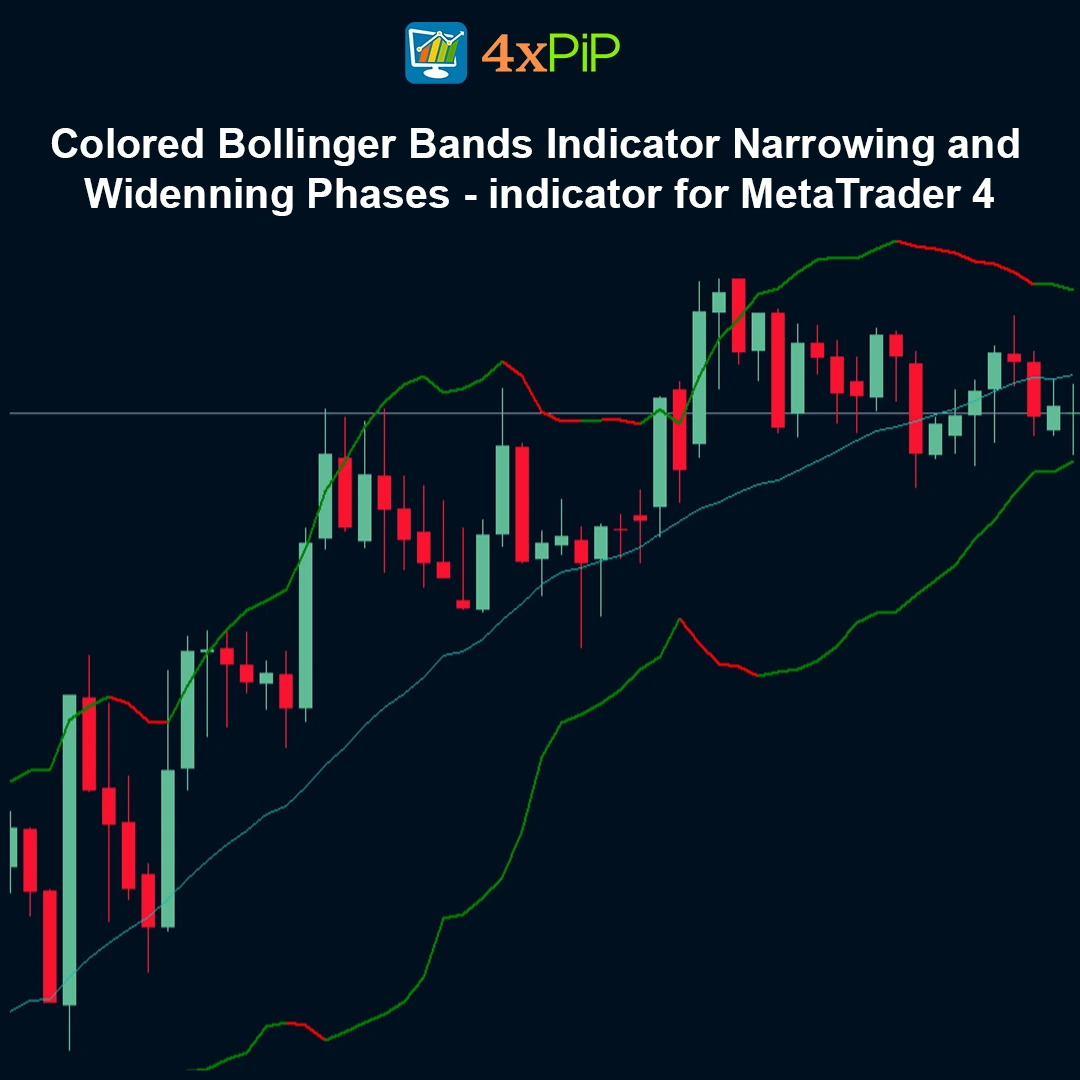
The Colored Bollinger Bands Indicator – Narrowing & Widening Phases for MetaTrader 4 is a volatility-based trading tool that visually highlights expansion and contraction phases of Bollinger Bands using dynamic color changes. It helps traders quickly detect breakout conditions, consolidation zones, and potential buy/sell opportunities.
Description
What is the Colored Bollinger Bands Indicator?
The Colored Bollinger Bands Indicator is a technical analysis tool for MetaTrader 4 that builds on the classic Bollinger Bands formula, which combines a moving average with standard deviation. It automatically changes the color of the upper and lower bands based on market volatility and trend conditions, making it easier for traders to interpret price action and identify potential trading opportunities without manually analyzing raw band data.
What do widening and narrowing bands indicate?
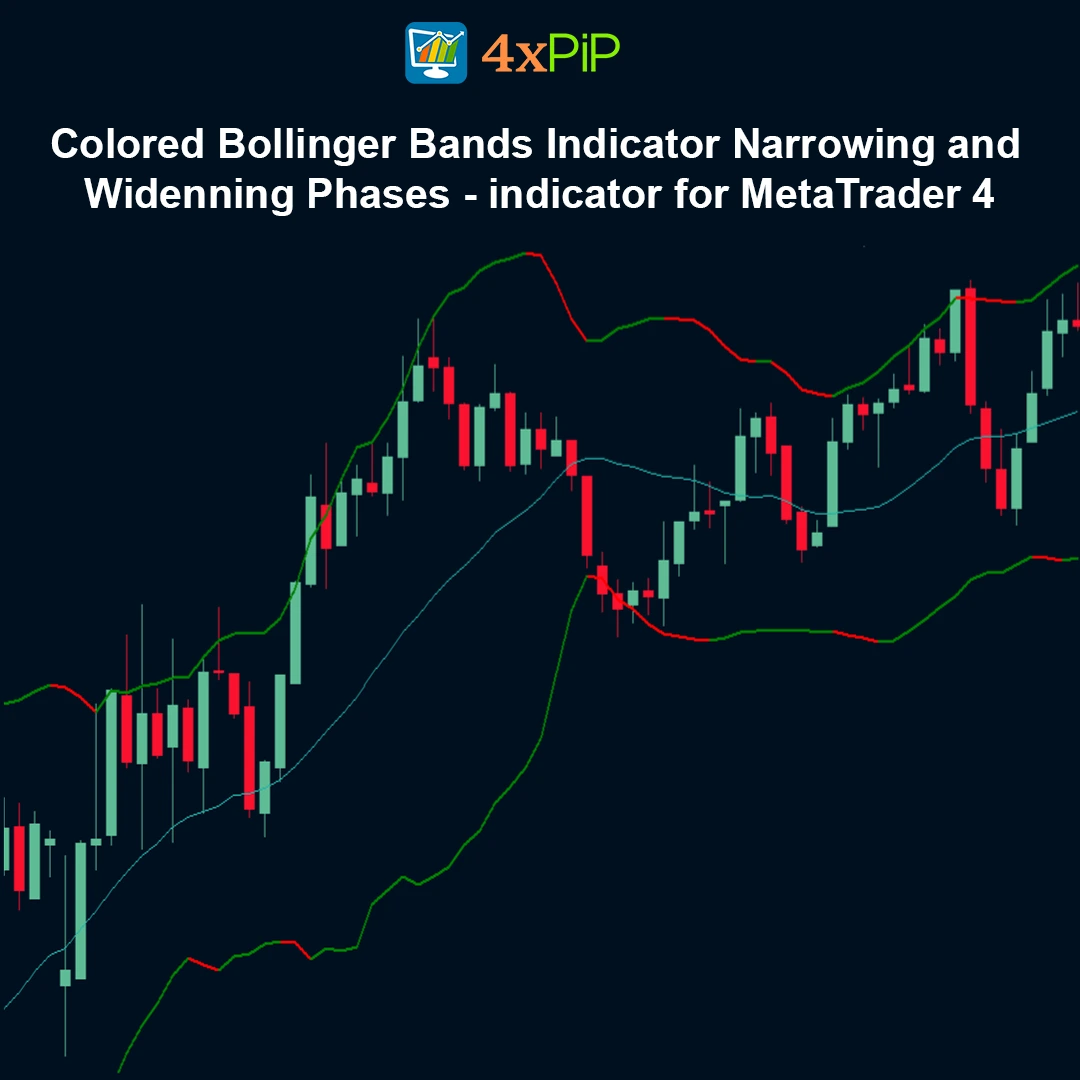
Widening bands indicate high market volatility and strong price movements, which are often seen during breakouts or trending phases. Narrowing bands indicate low volatility and consolidation periods, which typically precede significant price moves. Observing these phases helps traders anticipate potential breakout or trend continuation opportunities.
What is the significance of the band colors?
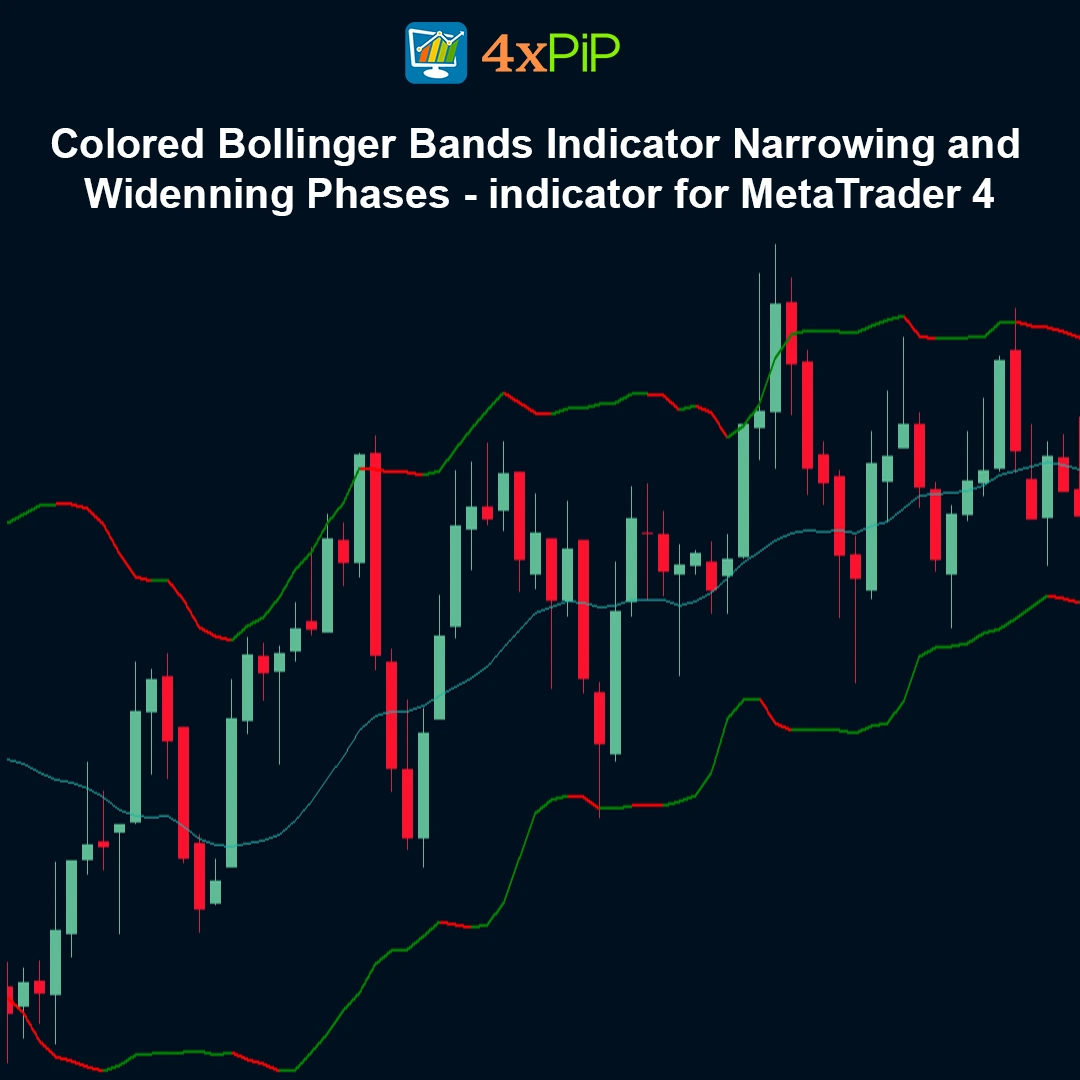
In this indicator, green bands represent a bullish bias, signaling that upward price movement is more likely, while red bands represent a bearish bias, signaling potential downward movement. The color coding provides a visual cue for trend direction, helping traders make quicker and more confident trading decisions.
What role does the middle moving average play?
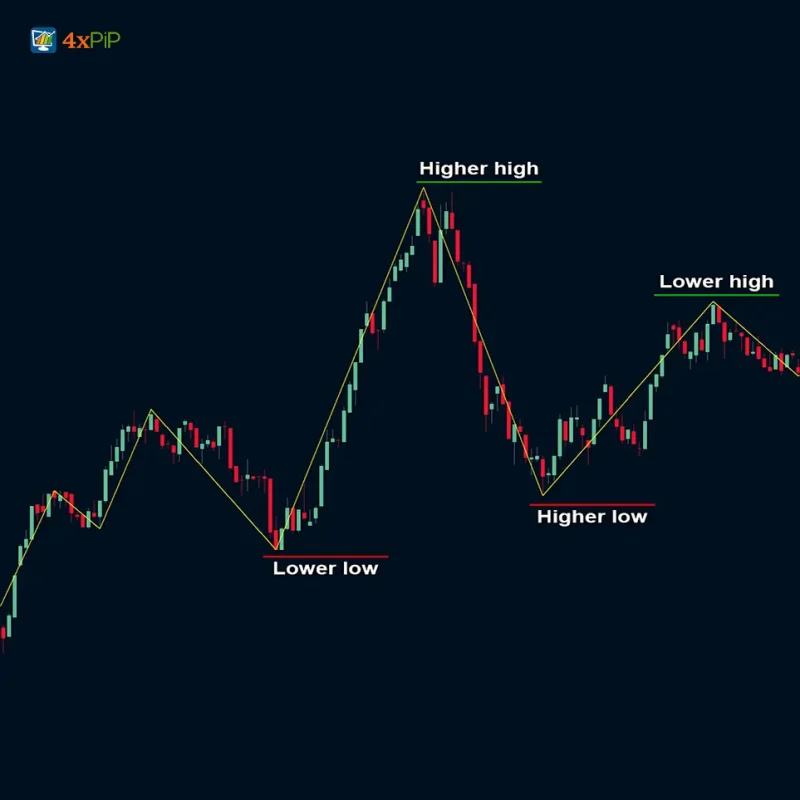
The middle moving average acts as a trend confirmation filter. When price is above the middle moving average, it confirms a bullish bias, and when price is below, it confirms a bearish bias. This helps traders align their entries with the prevailing market trend and avoid trading against momentum.
Advantages
- Clear visualization of volatility changes
- Automatic color-coded signals
- Suitable for all trading styles
- Works on all MT4 instruments
- Beginner-friendly interface
- Detects breakout opportunities
- Helps filter ranging markets
- Customizable settings
- Based on proven Bollinger Bands logic
- Free to download and use
Features
- Standard Bollinger Bands calculation
- Dynamic band color change
- Volatility expansion detection
- Volatility contraction detection
- Middle moving average trend filter
- Buy/Sell bias indication
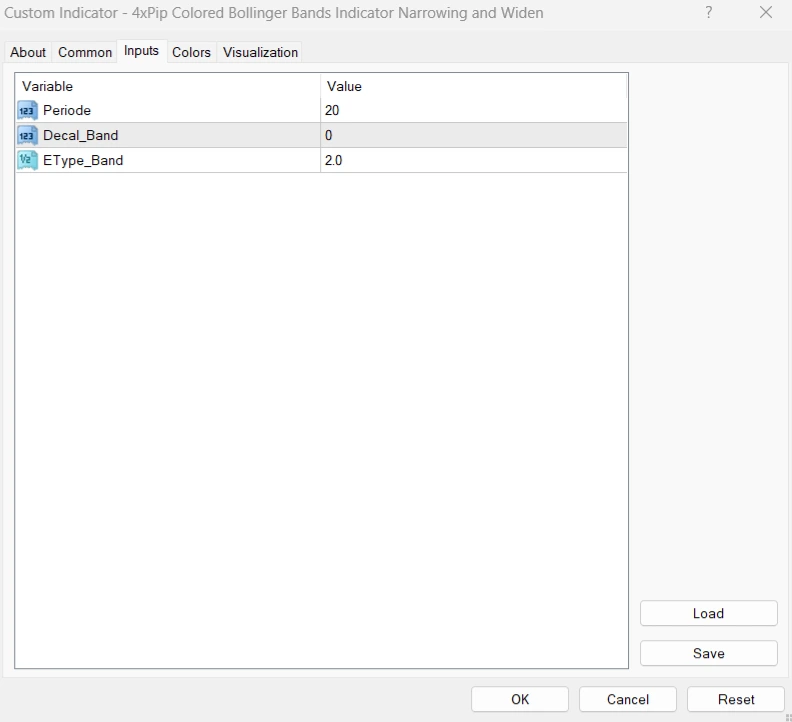
- Adjustable period and deviation settings
- Displayed on main chart window
- Compatible with all MT4 brokers
- Fast processing and low resource usage
How to Trade
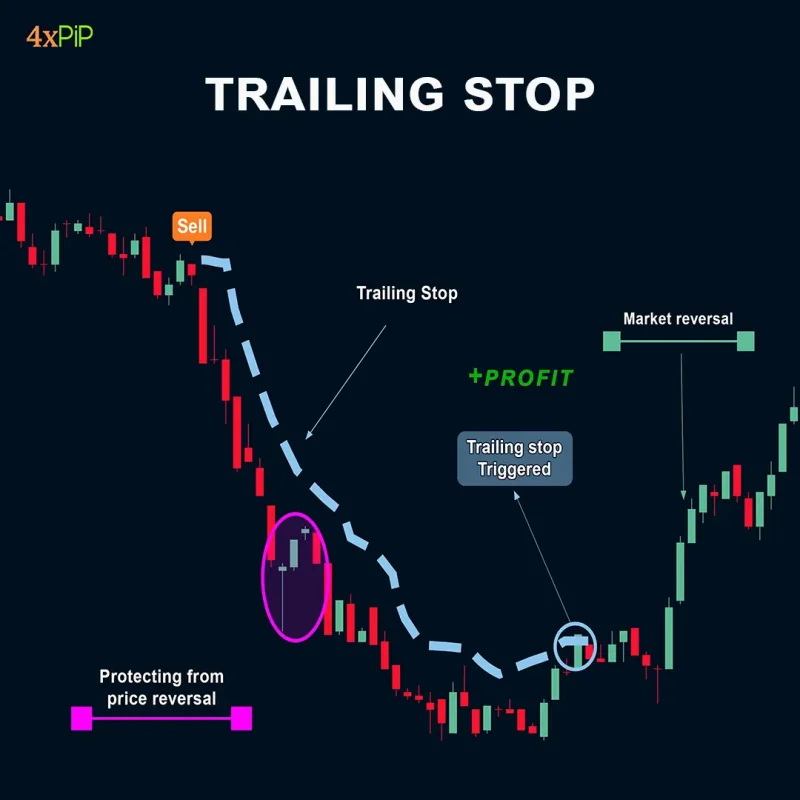
For a Bullish Setup (BUY), wait until the price closes above the middle moving average and confirm that both Bollinger Bands have turned green, then enter a buy position with a stop-loss placed below the recent swing low. Conversely, for a Bearish Setup (SELL), wait for the price to close below the middle moving average and ensure both bands have turned red, then enter a sell position with a stop-loss placed above the recent swing high. This approach combines trend confirmation with band color signals to optimize entry points while managing risk effectively.
Formula
Middle Band = 20-period Simple Moving Average (SMA)
Upper Band = SMA + (Standard Deviation × Multiplier)
Lower Band = SMA – (Standard Deviation × Multiplier)
Volatility Width = Upper Band – Lower Band
Conclusion
The Colored Bollinger Bands Indicator for MetaTrader 4 transforms traditional Bollinger Bands into a visually intuitive volatility tool. It helps traders quickly identify trends, consolidations, and breakout opportunities using simple color-based signals.
DOWNLOAD NOW Reach Us on WhatsApp
 Fly Over to Telegram
 Drop Us an Email
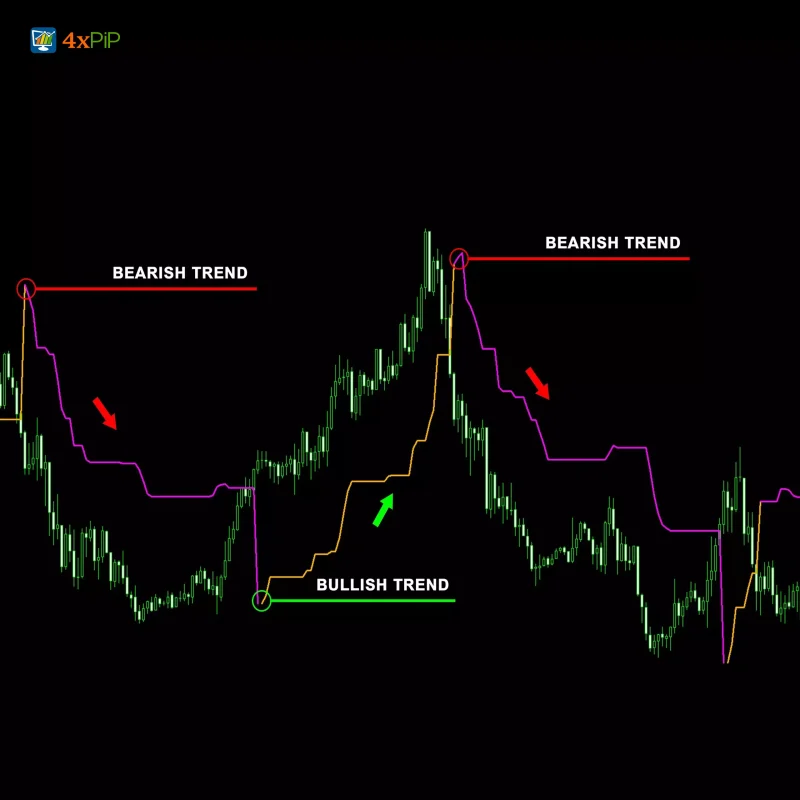
Reviews
There are no reviews yet