Wick Rejection Scanner Dashboard – Multi-Symbol Multi-TF MT5 Indicator | FREE
$0.00
Wick Rejection Scanner Dashboard is a professional multi-symbol, multi-timeframe scanner for MetaTrader 5 that detects high-quality wick rejection candles and displays them in a ranked on-chart dashboard. It acts as a real-time setup radar for price action traders.
Description
What is Wick Rejection Scanner Dashboard – Multi-Symbol Multi-TF MT5 Indicator?
The Wick Rejection Scanner Dashboard for MT5 is an advanced trading tool that scans multiple symbols and timeframes to detect candles with strong upper or lower wick rejections. These wick rejections often indicate potential price reversals or strong reactions from support and resistance levels. Instead of analyzing each chart manually, the indicator automatically identifies these signals and displays them in a dashboard. This helps traders quickly locate important price action setups across several markets at the same time.
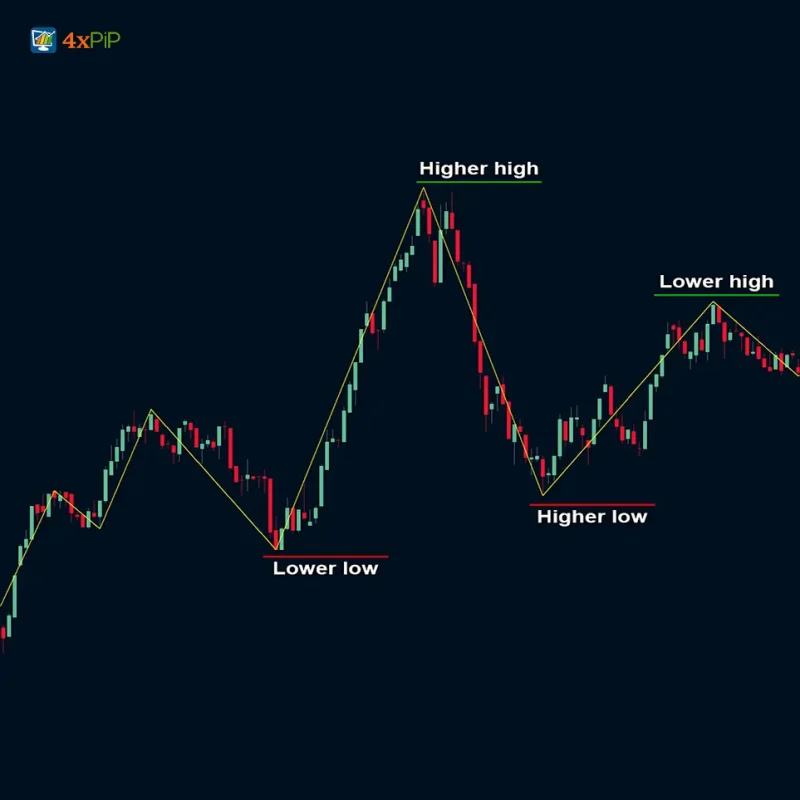
How does the indicator detect wick rejection signals?
The indicator analyzes the structure of each candle and measures the size of its wick relative to the body and total range. When a candle forms a large upper wick, it suggests sellers pushed the price back down after buyers tried to move it higher. A large lower wick indicates buyers rejected lower prices. The scanner continuously evaluates these patterns across selected symbols and timeframes, allowing traders to quickly identify potential reversal signals without manually checking each chart.
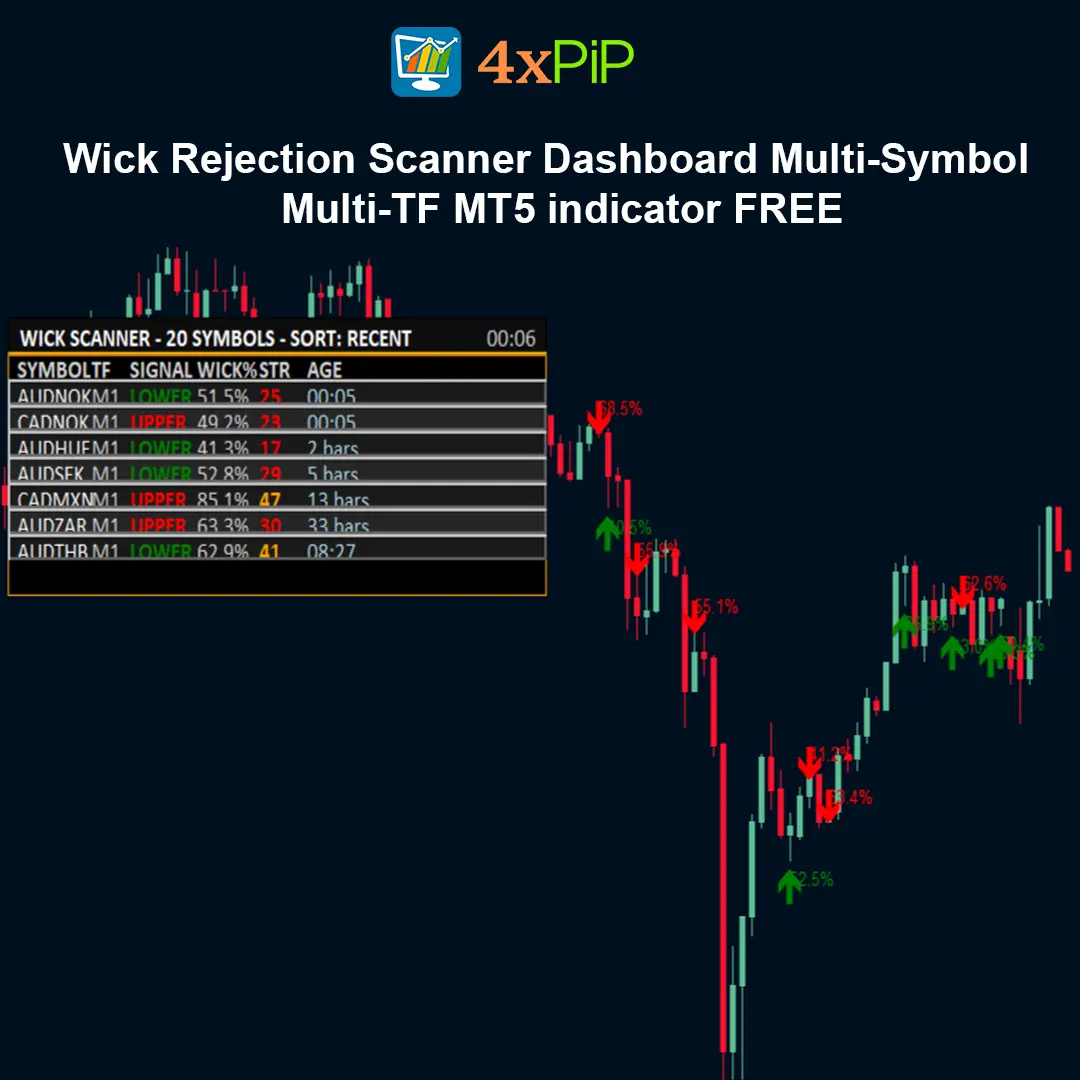
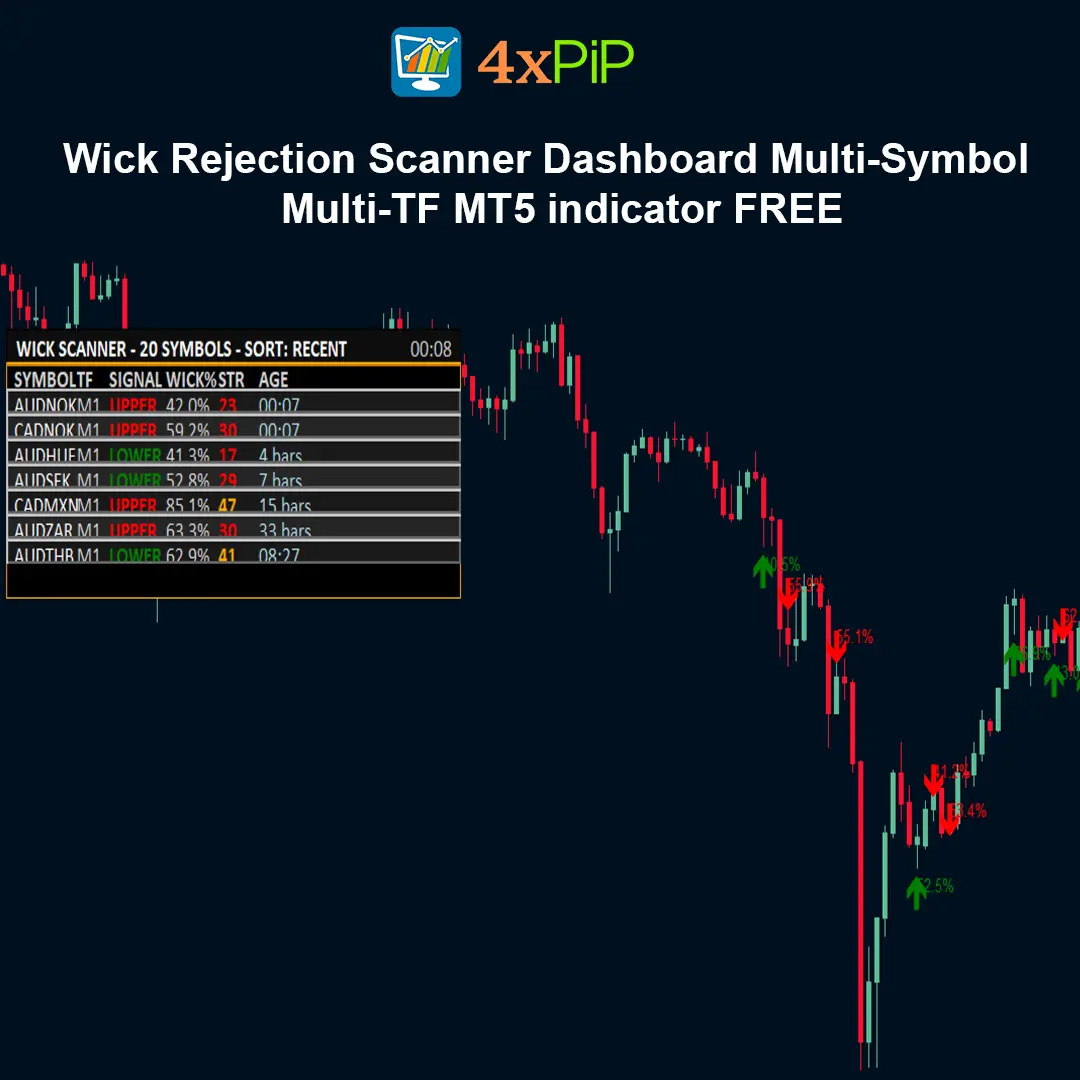
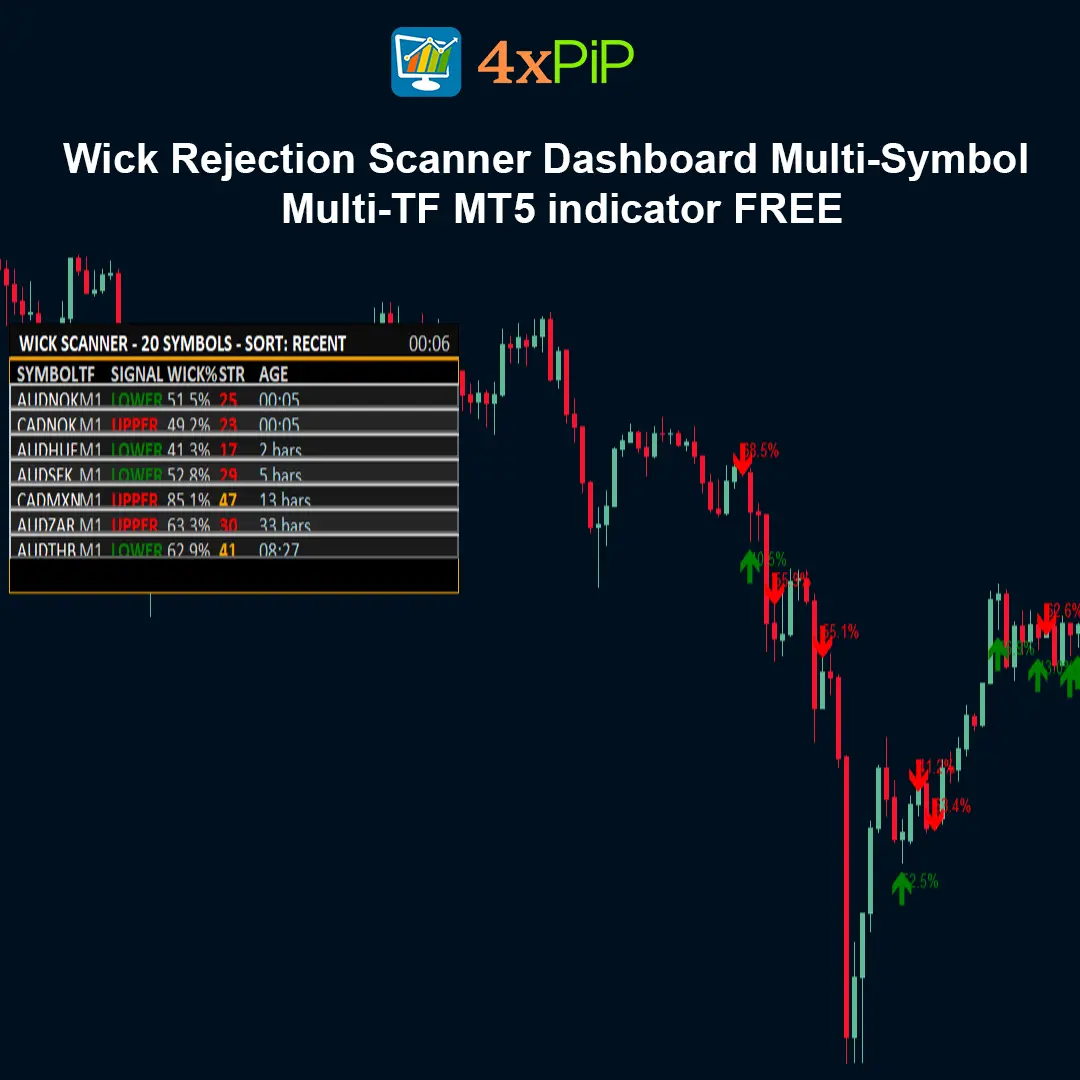
What information is displayed on the scanner dashboard?
The dashboard provides a clear table that displays important details about each detected signal. It includes the Symbol, Timeframe, Signal Type (upper or lower wick rejection), Wick Percentage, Strength Score, and Signal Age. This organized display helps traders quickly evaluate the quality and relevance of each signal. By seeing all this information in one place, traders can prioritize stronger setups and avoid spending time on weaker signals.
How does the clickable dashboard help traders analyze signals faster?
One of the most useful features of the indicator is its interactive dashboard. Traders can simply click on any signal listed in the table, and the platform will instantly switch the chart to the corresponding symbol and timeframe. This eliminates the need to manually search for the chart where the signal appeared. As a result, traders can quickly review price action, confirm setups, and make faster trading decisions.
Advantages
- Saves time by scanning multiple charts automatically.
- Filters weak or noisy rejection candles.
- Strength-based ranking system.
- Multi-symbol and multi-timeframe support.
- Click-to-switch chart functionality.
- Optional ATR-based volatility filter.
- Trend context scoring for smarter filtering.
- Customizable dashboard UI.
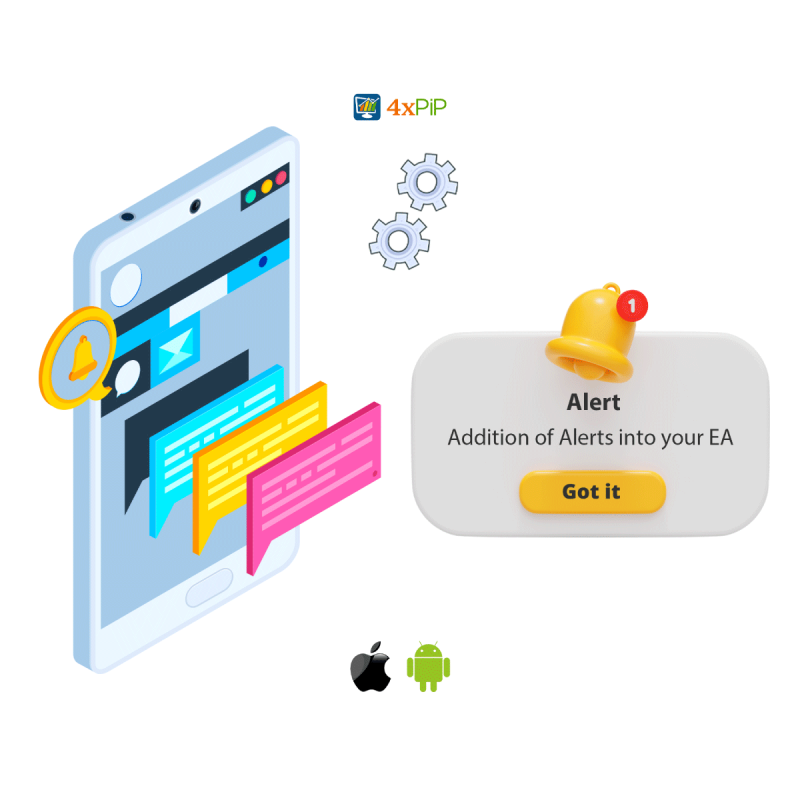
- Optional alerts with cooldown control.
- Lightweight and performance-conscious design.
Features
- Multi-symbol scanner (Market Watch or custom list).
- Multi-timeframe scanning support.
- Configurable wick dominance threshold (%).
- Minimum candle range and body size filters.
- Opposite wick cap filter.
- Optional ATR validation.
- Trend context scoring system.
- Professional sortable dashboard UI.
- Optional on-chart arrows and labels.
- Popup, push, and email alerts.
Detection Logic
A signal is generated when a candle meets defined rejection criteria including wick dominance percentage, minimum range, minimum body size, opposite wick cap, optional ATR validation, and optional trend context scoring.
How to Trade
- Use the dashboard as a setup radar.
2. Confirm with support/resistance and trend structure.
3. Align with higher timeframe bias.
4. Consider session timing and volatility.
5. Apply proper risk management.
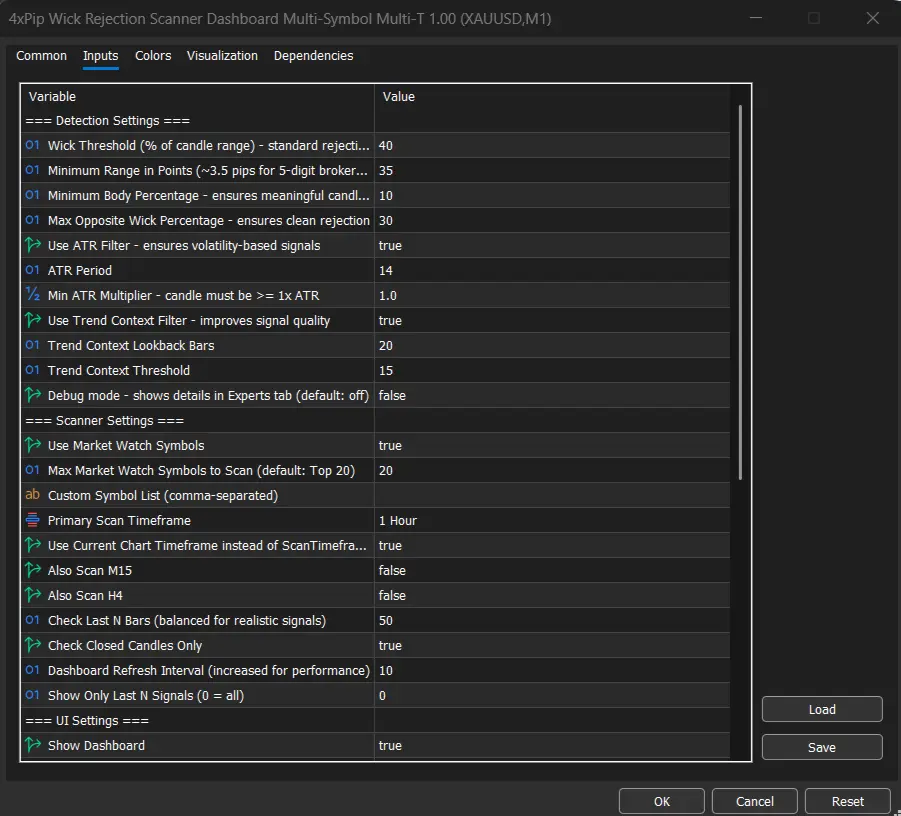
Inputs (Configurable Settings)
Detection Settings: Wick threshold %, Minimum range, Minimum body %, Opposite wick cap, ATR settings, Trend scoring.
Scanner Settings: Symbol list, Timeframe selection, Bars to check, Refresh interval, Max signals.
UI & Alerts: Dashboard position, font size, marker visibility, alert channels, cooldown.
Conclusion
Wick Rejection Scanner Dashboard improves workflow by scanning multiple charts, filtering noise, and ranking setups so traders can focus on high-quality price action opportunities.
DOWNLOAD NOW Reach Us on WhatsApp
 Fly Over to Telegram
 Drop Us an Email
FAQ's
Q & A
Related products
-
 Premium
Forex Scanner: Dashboard Scanner for MT5 | Market Scanner
Original price was: $299.00.$199.00Current price is: $199.00. Select options -
 Premium
MT5 EA to send Signal Alerts to Telegram channel
Original price was: $199.00.$49.00Current price is: $49.00. Select options -
 Free
FreeMT5 Zigzag Indicator
$0.00 Select options
Reviews
There are no reviews yet