Volume MA with Candle Color Tracking Indicator for MetaTrader 5 | Download FREE
$0.00
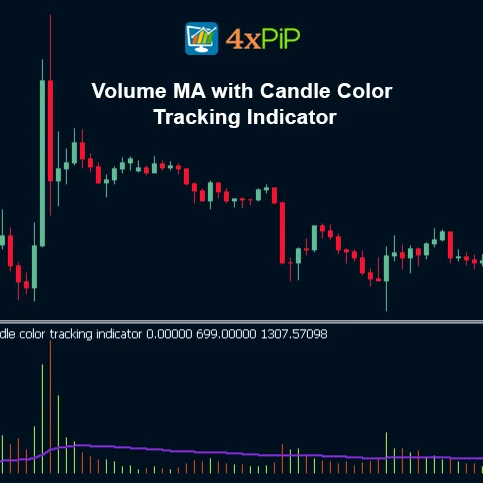
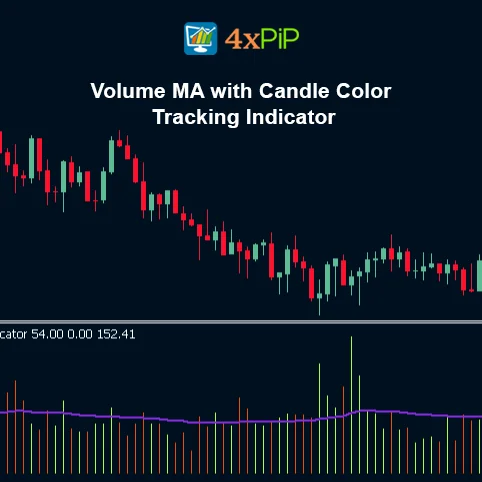
The Volume MA with Candle Color Tracking Indicator for MetaTrader 5 uses a moving average line on tick volume instead of price. It helps traders see when trading activity is increasing or decreasing. The indicator colors the volume histogram bars based on candle direction, green for bullish candles and red for bearish candles. It’s useful for identifying strong trends, volatility spikes, and low-liquidity phases in the market.
Description
What is the Volume Moving Average Indicator?
The Volume Moving Average Indicator is a technical analysis tool that measures the average tick volume over a specific period. Instead of calculating averages on price like most indicators, it focuses on the volume of trades (tick volume). This helps traders understand how much market activity supports a price move. The indicator shows histogram bars colored according to price direction, helping visualize both volume and trend strength together.
How Does Volume Moving Average Indicator Work?
The indicator calculates a moving average line based on the tick volume data of each candle. When the tick volume rises above this moving average, it indicates increased market participation meaning traders are actively entering the market, which often leads to stronger trends or volatility. When the tick volume remains below the average, it shows reduced activity, signaling possible sideways movement or consolidation.
How Can Traders Use It to Make More Profit?
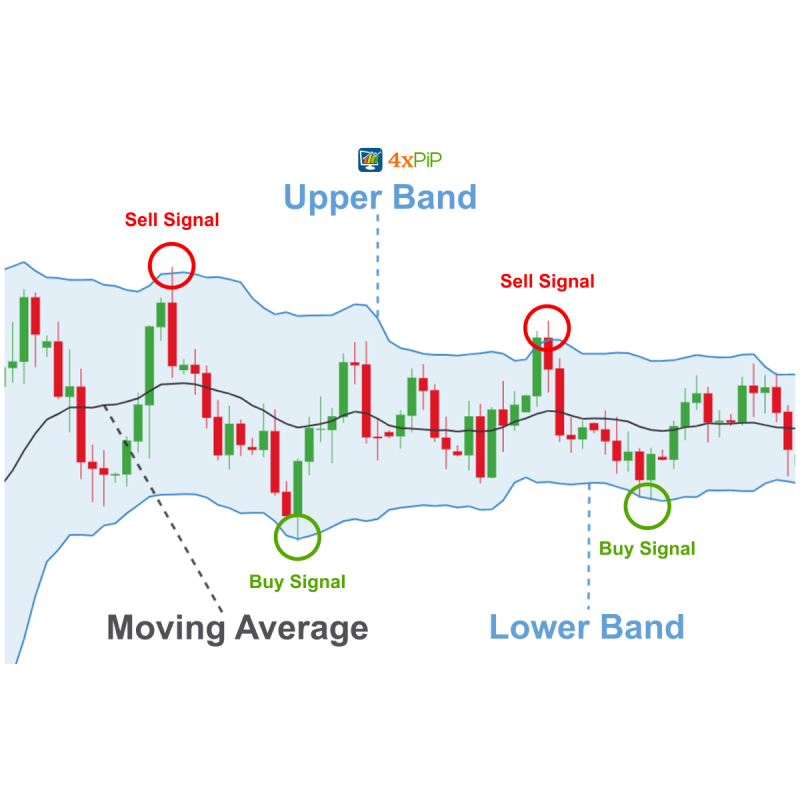
This indicator can be used to confirm trend strength, detect breakout opportunities, and identify low-volume zones where the market may lack direction. Scalpers and intraday traders can use it to time entries during high-activity periods, while swing traders can use it to avoid quiet sessions. It can also be combined with price action or momentum indicators to filter false signals and improve trade accuracy.
The indicator also tracks candle colors, aligning the volume bars with price direction—bullish bars turn green, bearish bars red, providing instant visual context between price movement and volume behavior. This combination helps traders confirm trends, detect momentum shifts, and time entries or exits more precisely.
It’s a modern MQL4 to MQL5 conversion of a classic tool, optimized for today’s trading platforms and compatible with all currency pairs, timeframes, and broker conditions.
How to Spot Strong Trends on MT5 using Volume MA With Candle Color Tracking Indicator?
Spotting strong trends on MT5 becomes easier when using the Volume MA With Candle Color Tracking Indicator. This tool reads both price movement and volume strength at the same time. When the candle color changes and the volume stays above its moving average, it means buyers or sellers are fully in control. This helps traders know if the trend is strong, not just a small price move.
The indicator also shows when a trend is getting weak. If candle color changes but volume stays low, the breakout is not reliable. Traders use this to avoid false entries and wait for real momentum. By watching color changes and volume spikes together, users can make safer decisions and catch strong moves early.
Advantages
- Enhances understanding of market participation through tick volume analysis.
- Helps confirm trend strength by comparing volume activity against price movement.
- Detects momentum surges and volatility spikes early.
- Filters out low-liquidity periods to avoid false entries.
- Visually links volume dynamics with candle behavior.
- Supports multiple timeframes and trading instruments.
- Assists in identifying breakout or reversal zones.
- Works effectively with other indicators for confluence analysis.
- Simple to interpret and ideal for manual and semi-automated strategies.
- Lightweight MQL5 coding ensures smooth performance on MetaTrader 5.
Features
- Volume-based Moving Average: calculates the MA from tick volume instead of price.
- Candle Color Synchronization: aligns volume bar colors with bullish/bearish candles.
- Dynamic Histogram Display: visualizes volume intensity per candle.
- Customizable MA Periods: adjust smoothing level to suit trading style.
- Adjustable Colors and Widths: personalize the indicator for chart visibility.
- Real-time Updates: recalculates automatically with each tick.
- Cross-Platform Compatibility: optimized for MT5’s latest build.
- Low CPU Usage: efficient MQL5 design for stable performance.
- Supports Multiple Chart Types: usable with candlestick, bar, or line charts.
- Free Download and Easy Installation: install via drag-and-drop from the Navigator panel.
Formula
VMA (n) = (sum of N volume bars) / N
Conclusion
The Volume MA with Candle Color Tracking Indicator for MetaTrader 5 is a powerful visualization tool that merges volume activity with price dynamics. By applying a moving average to tick volume and color-coding bars based on candle direction, it gives traders a deeper understanding of market strength, liquidity, and volatility conditions. Whether you’re confirming trend continuations or spotting early shifts in participation, this free indicator enhances both clarity and accuracy in your trading decisions.
DOWNLOAD NOW Reach Us on WhatsApp
 Fly Over to Telegram
 Drop Us an Email
FAQ's
Q & A
Related products
-
 Free
FreeAuto Risk-Based Lot for MT5 EA
$30.00 Select options -

Two Line MACD Histogram Indicator for MT5 – Free Download
$0.00 Select options -
 Free
FreeMT5 EA Bollinger Band
Original price was: $100.00.$20.00Current price is: $20.00. Select options -
 Premium
MT5 License System for Trading bots EA
Original price was: $199.00.$99.00Current price is: $99.00. Select options
Reviews
There are no reviews yet