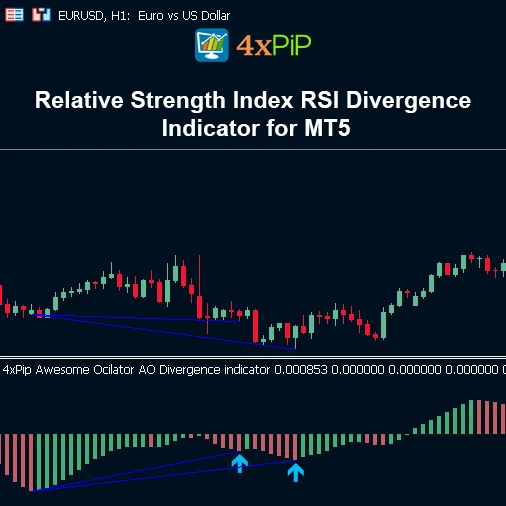
Relative Strength Index RSI Divergence Indicator for MT5 | Download FREE
$0.00
The RSI Divergence Indicator for MT5 automatically detects bullish and bearish divergences between price action and the Relative Strength Index (RSI) oscillator. It helps traders identify early signs of potential reversals or trend continuations by marking divergence signals directly on the chart with clear visual cues and optional alerts.
Description
How to Trade with the RSI Divergence Indicator in MT5?
The Relative Strength Index (RSI) Divergence Indicator for MetaTrader 5 is a powerful technical analysis tool that simplifies the process of spotting divergences — one of the most reliable price action strategies for anticipating market reversals. Divergence occurs when price forms higher highs or lower lows, while the RSI oscillator moves in the opposite direction, signaling a potential weakening of the current trend.
This indicator automates that entire process. It scans charts in real-time, comparing price swings with RSI readings, and identifies both bullish and bearish divergences. When a valid signal is detected, it plots directional arrows and labels directly on the chart at the point of divergence. Traders no longer need to manually analyze every high and low the indicator does it instantly and accurately.
Ideal for forex, stocks, crypto, indices, and commodities, this tool suits scalpers, swing traders, and long-term investors alike. It’s especially effective when used at key support/resistance levels, overbought/oversold zones, or in combination with other strategies. With user-friendly customization, non-repainting signals, and real-time alerts, this indicator is an essential addition to any MT5 trading setup.
Advantages
- Automatically Detects RSI Divergence: Saves time and eliminates manual analysis.
- Works with Bullish and Bearish Signals: Captures both reversal types.
- Increases Reversal Accuracy: Identifies weakening trends before they shift.
- Non-Repainting Signals: Signals remain fixed once confirmed.
- Great for All Market Conditions: Works in trending or ranging markets.
- Supports All Asset Classes: Use with forex, crypto, indices, stocks, and metals.
- Enhances Risk Management: Signals allow better placement of stop-loss and targets.
- Real-Time Alerts: Receive instant notifications for new divergence opportunities.
- Customizable Settings: Tailor RSI period, sensitivity, and visuals to match your strategy.
- Free to Download: No cost, high-value addition to your MT5 toolbox.
Features
- RSI-Based Divergence Engine: Tracks price and RSI for regular and hidden divergences.
- Directional Arrows and Labels: Visually marks bullish or bearish divergence points.
- Configurable RSI Period: Customize the indicator to your trading strategy.
- Signal Filtering Sensitivity: Adjust the minimum swing strength and divergence depth.
- Pop-Up & Sound Alerts: Optional real-time notifications.
- Supports Regular & Hidden Divergence: Use both for trend reversals or continuations.
- Works on Any Timeframe: From 1-minute to monthly charts.
- Minimal CPU Load: Optimized for fast chart performance.
- Fully Visual Interface: All elements plotted directly on the chart.
- Multi-Asset Compatibility: Use across any symbol in the MT5 terminal.
Formula
RSI Calculation:
RSI = [100 – (100/{1+ RS})]
Optional inclusion of hidden divergence:
- Hidden Bullish: Price makes higher lows, RSI makes lower lows.
- Hidden Bearish: Price makes lower highs, RSI makes higher highs.
How To Use
Download the .ex5 file and place it in your MQL5 > Indicators folder. Restart MT5.
Open any chart and drag the indicator from the navigator panel.
Set your preferred RSI period (e.g., 14) and divergence sensitivity.
Arrows and labels indicate potential reversal points:
- Up arrow / label = Bullish divergence
- Down arrow / label = Bearish divergence
Use the signals alongside price structure, support/resistance, or other tools.
Turn on sound/pop-up alerts for hands-free divergence notifications.
How To Trade
A practical way to implement the RSI Divergence Indicator is to first focus on identifying bullish divergences at key support zones. For example, when the price forms lower lows but the RSI makes higher lows, the indicator will plot an up-arrow signal. Traders can enter a long position once the divergence is confirmed and ideally after a bullish candlestick pattern (like a hammer or engulfing) appears near support. Stop-loss can be placed just below the recent swing low, while take-profit targets can be set at the next resistance level or using a fixed risk-reward ratio such as 1:2. This allows traders to capture potential reversals early while managing downside risk.
On the other hand, bearish divergences are highly effective near resistance zones or after extended bullish runs. When the indicator detects price forming higher highs while RSI prints lower highs, it signals possible weakening momentum. Traders can take short positions at the divergence point or wait for additional confirmation, such as a bearish candlestick pattern or break of minor support. Stop-loss should be placed above the recent swing high, with profit targets set at the next key support level. Combining these divergence signals with support/resistance, moving averages, or trendlines greatly improves accuracy and helps filter out false setups.
Conclusion
The RSI Divergence Indicator for MetaTrader 5 combines simplicity with advanced functionality, making it an indispensable tool for any trader who uses momentum and reversal strategies. It automates the detection of both bullish and bearish divergences, plots them clearly on the chart, and validates them with RSI momentum all without repainting. Whether you’re trading breakouts, reversals, or using it as a filter in a broader strategy, this indicator enhances timing, accuracy, and decision-making. Best of all, it’s completely free and fully customizable to your needs.
DOWNLOAD NOW Reach Us on WhatsApp
 Fly Over to Telegram
 Drop Us an Email

Reviews
There are no reviews yet