
ZeroLag MACD Indicator for MetaTrader 4 – FREE Download
$0.00
The ZeroLag MACD is an enhanced momentum-based technical indicator designed to provide faster and more accurate MACD signals for traders using MetaTrader 4. It is based on the classic MACD indicator included in the MetaTrader platform but applies a zero-lag calculation method to reduce delay in signal generation.
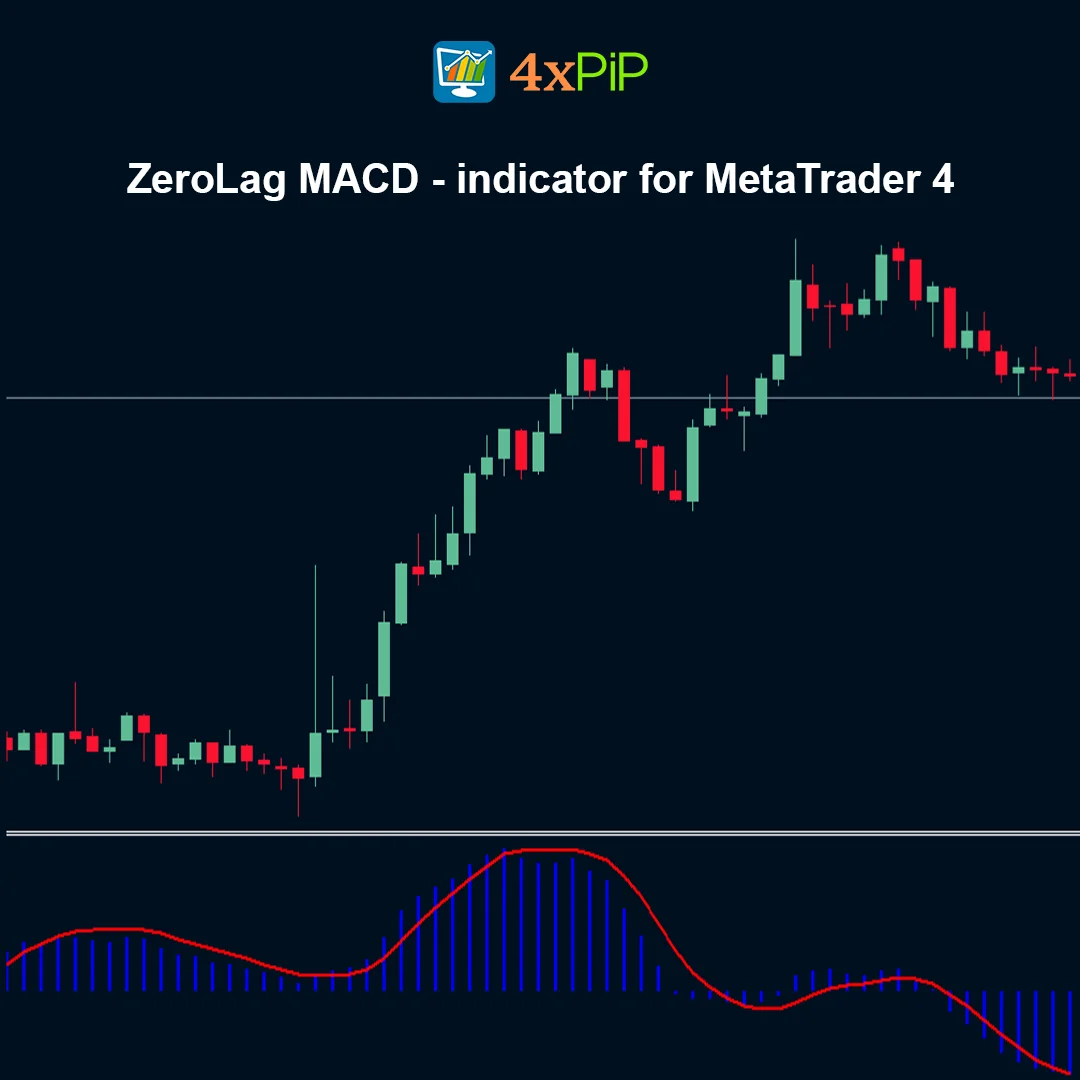
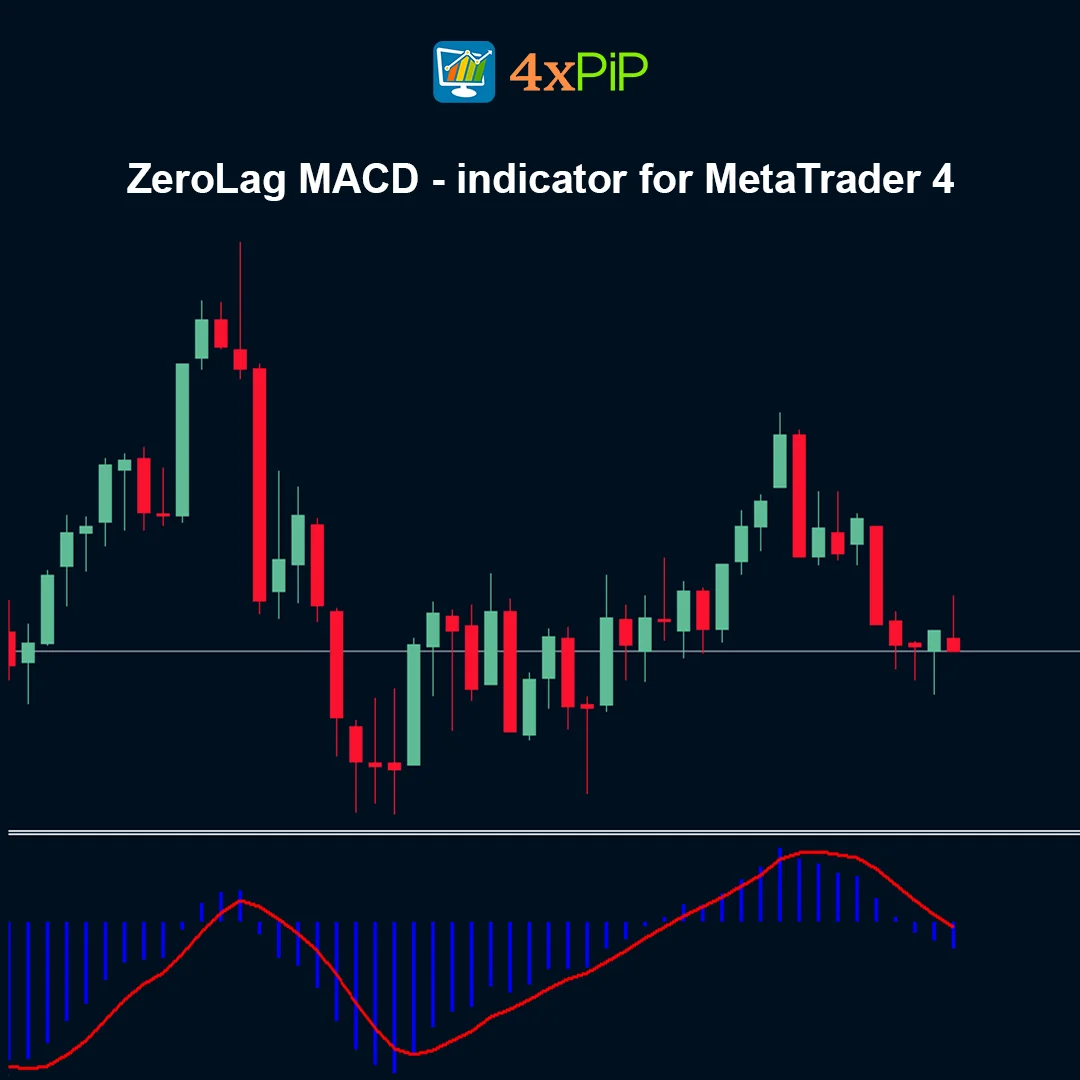
One of the visual improvements of the ZeroLag MACD is that the histogram is colored according to the previous bar, making it easier for traders to identify changes in market momentum and trend strength. This visual feature allows traders to quickly detect shifts in bullish or bearish pressure.
Unlike the traditional MACD, which can sometimes react slowly to sudden market movements, the ZeroLag MACD aims to minimize lag and improve responsiveness, helping traders identify potential trading opportunities earlier.
Description
What is the ZeroLag MACD indicator?
The ZeroLag MACD is a modified version of the traditional MACD indicator that is designed to reduce lag and react faster to price changes. It retains the structure of the classic MACD but uses a zero-lag technique to improve responsiveness.
What is the MACD indicator?
MACD stands for Moving Average Convergence Divergence. It is a widely used momentum indicator that shows the relationship between two moving averages of price and helps traders identify trend direction, momentum strength, and potential reversals.
How is ZeroLag MACD different from the standard MACD?
The ZeroLag MACD reduces the delay that normally occurs in moving average calculations. This allows the indicator to react more quickly to price movements compared to the standard MACD.
How does the ZeroLag MACD work?
The indicator calculates the difference between a fast and a slow moving average similar to the traditional MACD. However, the moving averages are adjusted using a zero-lag technique that reduces smoothing delay. The histogram displays momentum changes and is colored according to the value of the previous bar to make momentum shifts easier to identify.
What does the histogram represent?
The histogram represents the difference between the MACD line and the signal line. Larger histogram bars indicate stronger momentum, while smaller bars suggest weakening momentum.
Why is the histogram colored by the previous bar?
Coloring the histogram according to the previous bar helps traders visually detect momentum changes faster. This makes the indicator easier to interpret during live trading.
Why is the ZeroLag MACD useful for traders?
The ZeroLag MACD helps traders identify momentum changes earlier than the traditional MACD. This faster reaction to market movements can improve trade timing and help traders respond quickly to changing market conditions.
Advantages
- Reduces lag compared to the traditional MACD indicator.
- Provides faster momentum signals for active traders.
- Histogram coloring improves visual interpretation of momentum shifts.
- Helps traders detect trend changes earlier.
- Maintains the familiar structure of the classic MACD indicator.
- Suitable for multiple trading strategies including trend and momentum trading.
- Works with Forex, stocks, indices, and other financial markets.
- Compatible with multiple trading timeframes.
- Easy to combine with other technical indicators.
- Completely free indicator for MetaTrader 4 users.
Features
- Zero-lag version of the classic MACD indicator.
- Built based on the traditional MACD concept.
- Designed to reduce delay in signal generation.
- Displays a histogram showing market momentum.
- Histogram color is based on the previous bar value.
- Helps traders detect changes in bullish and bearish momentum.
- Appears in a separate indicator window for clear visualization.
- Optimized for smooth performance on the MetaTrader 4 platform.
- Compatible with multiple financial markets and timeframes.
- Can be used with manual trading strategies or automated systems.
How to Trade
The ZeroLag MACD indicator is commonly used to identify momentum changes and potential trend reversals. Traders monitor the histogram relative to the zero line. When the histogram moves above the zero line, it indicates strengthening bullish momentum and traders may consider buying opportunities. When the histogram moves below the zero line, it suggests increasing bearish momentum and traders may consider selling opportunities. Because the ZeroLag calculation reduces the delay found in traditional MACD indicators, traders may receive earlier signals. Many traders also combine the ZeroLag MACD with trend indicators such as moving averages or support and resistance levels for additional confirmation.
Formula
The ZeroLag MACD modifies the traditional MACD calculation by applying zero-lag exponential moving averages.
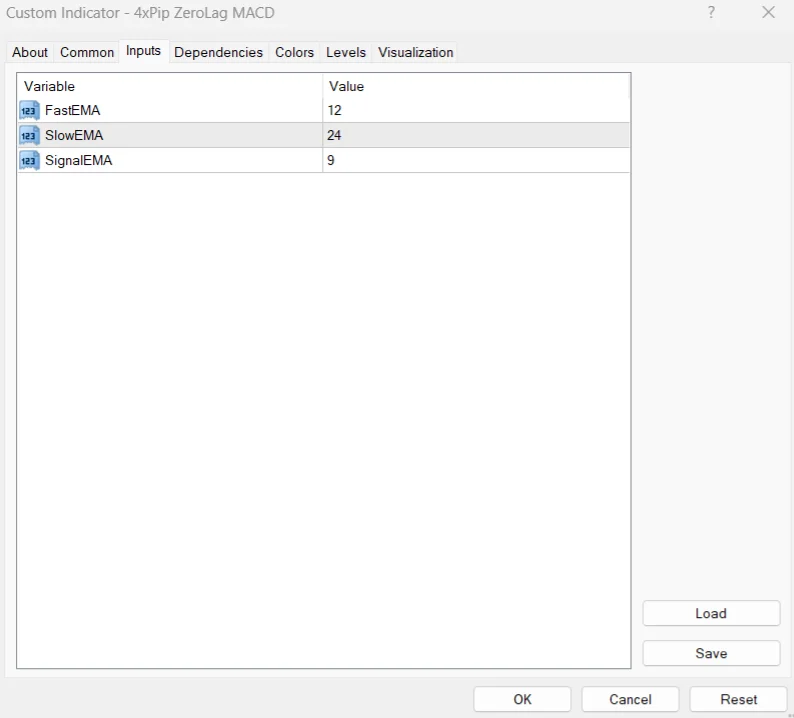
MACD Line = ZeroLag EMA(Fast Period) − ZeroLag EMA(Slow Period)
Signal Line = EMA(MACD Line)
Histogram = MACD Line − Signal Line
Where:
- Fast EMA — Short-period exponential moving average
- Slow EMA — Long-period exponential moving average
- Signal Line — Moving average of the MACD line
- Histogram — Difference between MACD line and signal line representing momentum strength
Conclusion
The ZeroLag MACD indicator is a powerful improvement over the traditional MACD by reducing lag and providing faster momentum signals. Its colored histogram and responsive calculations help traders identify market momentum and potential trend changes more quickly. By combining the familiar MACD structure with zero-lag techniques, the indicator becomes a valuable tool for technical analysis on the MetaTrader 4 platform.
DOWNLOAD NOW Reach Us on WhatsApp
 Fly Over to Telegram
 Drop Us an Email
Reviews
There are no reviews yet