SFX Arrow Lines indicator MT4 | Divergence | HH HL LH LL
$0.00
The 4xPip SFX Arrow Lines indicator for MT4 is a comprehensive tool designed to streamline technical analysis and potentially improve trade identification. It combines the power of four popular indicators: Divergence, Stochastic Oscillator, RSI (Relative Strength Index), and Bollinger Bands, to generate clear visual signals directly on your price chart.
Description
Technical analysis relies on interpreting signals from individual indicators. While valuable, analyzing multiple indicators can be time-consuming and lead to information overload. Moreover, the SFX Arrow Lines indicator addresses this challenge by cleverly integrating four powerful indicators:
What is Divergence? A valuable tool for identifying potential trend reversals. Divergence occurs when the price action moves in one direction, while the indicator value goes in the opposite direction (e.g., RSI divergence where the price keeps rising but RSI falls, indicating a weakening uptrend). Furthermore, there are four types of divergence, Bullish, Bearish, Regular, and Hidden Divergence. Moreover, this indicator shows all types of divergence.
How does a Stochastic Oscillator work?
The stochastic oscillator is a widely used technical tool that creates signals indicating overbought or oversold conditions. Also, this momentum indicator, which was developed in the 1950s, is favored for its ability to measure the velocity of price movements by comparing a particular closing price of an asset or security to its price range over a certain period. Typically, stochastic oscillators fluctuate around a central value, reflecting their dependency on historical price data of the asset.
Also, this indicator helps traders measure overbought and oversold conditions, potentially confirming reversal signals identified by Divergence.
RSI (Relative Strength Index) strategy
RSI measures the momentum and strength of a trend. Analyzing RSI values and slopes can reveal potential turning points in price movements.
Bollinger Bands Strategy
These bands depict channel boundaries around the price action. Band expansion often indicates increased volatility, while price movement near the bands can suggest potential breakouts or pullbacks.
4xPip SFX Arrow Lines indicator MT4 is an accurate and non-repainting indicator of MT4. Moreover, the SFX Arrow Lines indicator takes these individual indicators and weaves them into a unified analysis, presenting a holistic view of the market directly on your MT4 charts. It draws accurate uptrend/downtrend arrows on the chart and identifies Higher high, higher low, lower high, and lower low. It also draws lines according to bullish, bearish, regular, and hidden divergence on the chart.
How to trade with SFX Arrow Lines Indicator?
4xPip SFX Arrow Lines indicator for MT4 can simplify your trading by combining four popular tools into one. It analyzes Divergence, which is a fancy way of saying when price movement disagrees with an indicator’s reading. Furthermore, this can be a sign of a potential trend change. This indicator is very helpful in trading as it identifies divergence through lines on the chart. The indicator also considers Stochastic Oscillator, which helps identify overbought and oversold zones, and RSI which gauges trend strength. Finally, Bollinger Bands shows price volatility.
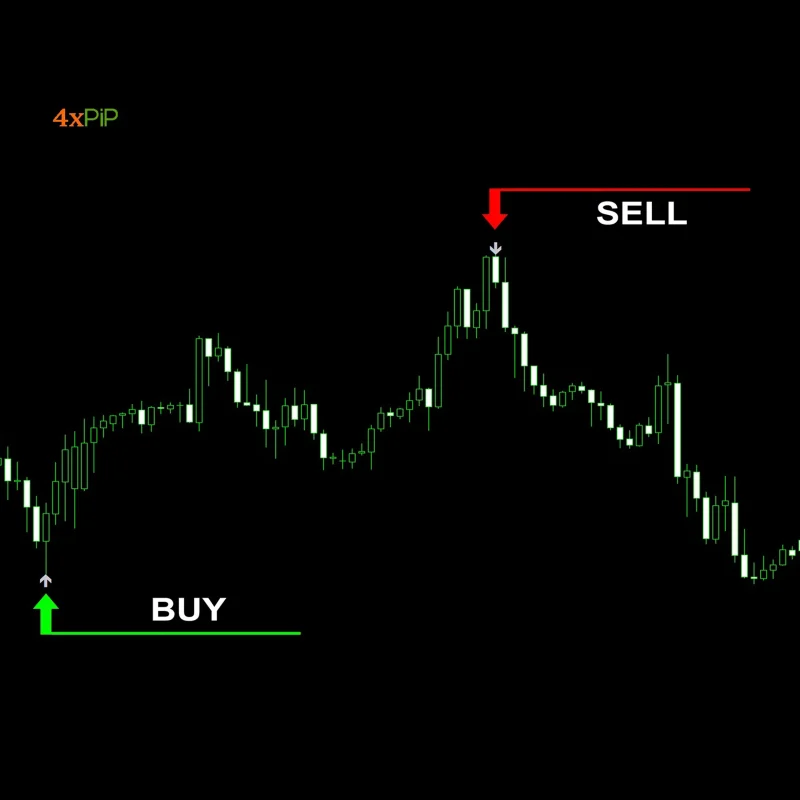
Moreover, by combining these elements, the SFX Arrow Lines indicator generates arrows directly on your charts. Also, these arrows can be a starting point for your entry and exit decisions. Look for arrows aligned with the current trend and RSI readings that support the trend for potential trend continuation. Lastly, if arrows point against trend and Divergence is confirmed by the Stochastic Oscillator, a trend reversal might be brewing.
Features:
Following are the key features of 4xPip SFX Arrow Lines indicator MT4:
- Multi-Indicator Convergence: Indicator goes beyond limitations of single indicators by incorporating Divergence, Stochastic, RSI, and Bollinger Bands into unified analysis.
- Divergence Detection: Identify potential trend reversals by highlighting inconsistencies between price action and indicator readings (e.g., RSI divergence where price keeps rising but RSI falls).
- Stochastic Confirmation: Utilize the Stochastic Oscillator’s overbought/oversold zones to validate potential reversals signaled by Divergence.
- RSI Strength: Leverage RSI values and slopes to assess trend strength and potential turning points.
- Bollinger Band Visualization: Bollinger Bands depict channel boundaries, with expansion indicating increased volatility and price movement near the bands suggesting potential breakouts or pullbacks.
- Simplified Trade Signals: The SFX Arrow Lines indicator eliminates the need to analyze multiple charts simultaneously. It generates clear arrowed signals directly on the price chart, saving time and effort.
- Early Trend Reversal Identification: The combined analysis of Divergence and other indicators may enable you to spot potential trend reversals sooner, allowing for timely exits from losing positions and entries into profitable ones.
- Enhanced Trade Confirmation: The confluence of signals from Stochastic, RSI, Bollinger Bands, and Divergence can provide increased confidence in your trading decisions.
- Streamlined Chart Analysis: This indicator declutters your charts by presenting a comprehensive view derived from multiple indicators, potentially reducing analysis time and improving focus.
- Highs and Lows Identification: The indicator identifies key market turning points by pinpointing higher highs (HH), higher lows (HL), lower highs (LH), and lower lows (LL). By highlighting these critical price levels, traders can better understand the market dynamics and make more informed trading decisions.
- Arrow Line Visualization: The SFX Arrow Lines indicator visualizes divergence patterns and key market levels using arrow lines on the price chart. This clear and intuitive representation makes it easy for traders to interpret signals and take action accordingly.
- Customizable: Traders have the flexibility to customize the indicator’s parameters according to their trading preferences and strategies. They can adjust settings such as several candles for divergence, Bollinger bands, and RSI to optimize performance and adapt to changing market conditions.
- Multi-Timeframe Analysis: The indicator supports multi-timeframe analysis, allowing traders to analyze divergence patterns and market trends across different timeframes simultaneously. This feature enables traders to identify high-probability trading opportunities and confirm signals with greater confidence.
- User-Friendly Interface: The SFX Arrow Lines indicator features a user-friendly interface that is easy to install and use on the MetaTrader 4 platform. Traders of all experience levels can quickly integrate the indicator into their trading setups and start utilizing its powerful features without any hassle.
- Alerts: The indicator provides alerts like desktop alerts, and mobile and email notifications, making it easier for traders to spot potential trading opportunities. These alerts can help traders stay informed and act promptly on emerging market sentiment signals.
Conclusion
In conclusion, the SFX Arrow Lines indicator offers a comprehensive solution for traders seeking to enhance their technical analysis and make more informed trading decisions in the financial markets. With its accurate features, intuitive interface, and customizable parameters, this indicator empowers traders to identify high-probability trading opportunities and trade with confidence. Download the 4xPip SFX Arrow Lines indicator MT4 now for free.
DOWNLOAD NOW Reach Us on WhatsApp
 Fly Over to Telegram
 Drop Us an Email
Settings
- Number of Candles for Divergence Touch: Adjust the Number of Candles for Divergence Touch
- Stochastic K: Set the Stochastic K according to your need
- Stochastic D: Set the Stochastic D according to your need
- Stochastic Period: Set the Stochastic Period for indicator
- RSI Period: Adjust the RSI Period for SFX Arrow Lines indicator
- RSI Applied Price: Set the RSI Price according to your need
- Bollinger Bands Period: Adjust the RSI Period for SFX Arrow Lines indicator
- Bollinger Bands Shift: Adjust the Bollinger Bands Shift
- Bollinger Bands Deviation: Adjust the Bollinger Bands Deviation
- Bollinger Bands Apply To: Set the Bollinger Bands price according to your need
- Desktop Alerts: True/False; True => It will show the alert on the desktop. False => It will not show the alert on the desktop.
- Mobile Notification: True/False; True => It will show the Mobile Notification as an alert. False => It will not show the Mobile Notification as an alert.
- Email Notification: True/False; True => It will show the Email Notification as an alert. False => It will not show the Email Notification as an alert.
42 reviews for SFX Arrow Lines indicator MT4 | Divergence | HH HL LH LL
| 5 star | 57% | |
| 4 star | 42% | |
| 3 star | 0% | |
| 2 star | 0% | |
| 1 star | 0% |
Q & A
Over six months, trading divergences with the MACD indicator achieved a success rate of 74%.
Divergence in stock indicates diminishing momentum in the current price trend and can signal the start of a trend reversal.
Divergence by itself may not provide a robust signal, and solely relying on divergences for trading has led to unsatisfactory outcomes for many traders. 4xPip SFX Arrow Lines indicator is the combination of four popular indicators that is an accurate and non-repainting indicator.
Some of the best technical indicators to pair with stochastic are moving average crossovers, moving average convergence divergence (MACD), and relative strength index (RSI).
When the two are combined, the RSI acts to either support or dispel possible price trends.

Martingale Forex EA turned my trading game around. The 100% winning rate claim is no joke. I’ve experienced consistent profits, and the counter trades are a lifesaver. Highly recommended!
Martingale EA is a reliable performer. The 100% winning rate may not be guaranteed, but it significantly improves your trading odds. Use it wisely, and it can be a game-changer.
Downloaded Martingale Forex EA, and my trading has never been better. The EA’s ability to identify optimal entry points is remarkable. It’s a must-have for serious traders.
Martingale EA has brought more consistency to my trades. It’s not without risks, but if used wisely, it can be a powerful tool in your trading journey. Thumbs up!
Martingale Forex EA is a solid performer. I’ve seen a significant reduction in drawdown, and the counter trades have saved me on multiple occasions. Make sure to stay disciplined in your approach.