RSI Slope Divergence Indicator for MetaTrader 5 | Relative Strength Index | Download FREE
$0.00
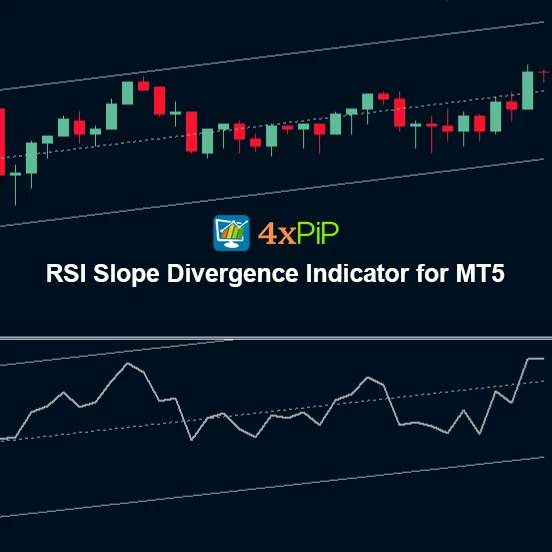
The RSI Slope Divergence Indicator for MetaTrader 5 automatically detects divergences between price movement and the RSI (Relative Strength Index) using a linear regression channel. It highlights potential reversal zones by comparing the slope of RSI and price in real time. When their slopes differ, the indicator changes the channel color, signaling a possible entry or exit point. Traders can use it to identify trend reversals and market turning points without waiting for bar confirmations.
Description
What is the RSI Slope Divergence Indicator?
The RSI Slope Divergence Indicator is a technical analysis tool that identifies when price action and RSI momentum move in opposite directions — a common sign of a potential trend reversal. Unlike traditional divergence tools that rely on fixed highs and lows, this indicator uses a linear regression model for a more precise, real-time analysis.
How does RSI Slope Divergence Indicator Work?
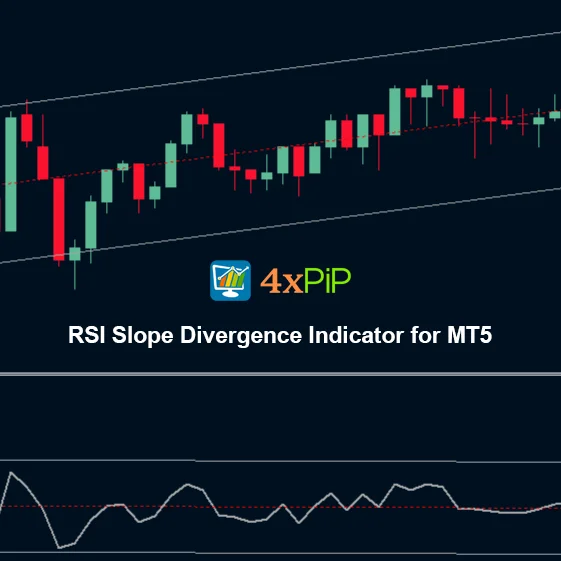
It applies linear regression channels to both price and RSI. When the slope direction of these two channels differs, the indicator highlights it by changing the color of the middle channel line. This visual cue indicates a divergence, helping traders spot possible buy or sell opportunities faster. Since linear regression doesn’t require closed bars for calculation, it provides instant detection of new divergences.
How to Use The RSI Slope Divergence Indicator Work Effectively?
Use the indicator the same way as any divergence detector. When the channel color changes, it means the RSI and price slopes are no longer aligned. Traders can then take action according to their strategy, such as entering a counter-trend position, adjusting existing trades, or setting tighter stop-loss levels. This tool is best used with trend confirmation indicators like moving averages or MACD.
How to Use the RSI Slope Divergence Indicator for More Accurate Divergence Signals in MetaTrader 5?
The RSI Slope Divergence Indicator for MetaTrader 5 helps traders find stronger and more reliable divergence signals by using both price action and the slope of the RSI line. Unlike the standard RSI, this tool focuses on the direction and angle of the RSI movement, making it easier to spot early trend reversals or hidden momentum changes. It automatically marks bullish and bearish divergences on the chart, saving time and reducing the chance of missing key setups.
To use it, simply attach the indicator to your MT5 chart and watch for signals where price and the RSI slope move in opposite directions. A bullish divergence forms when the price makes a lower low but the RSI slope forms a higher low, while a bearish divergence occurs when the price makes a higher high but the RSI slope shows a lower high. Traders can confirm these signals with candlestick patterns or support/resistance levels before entering trades. This approach helps increase the accuracy of divergence trading and improve overall decision-making.
Advantages
- Detects hidden and regular divergences in real time.
- No need for closed candles or confirmation bars.
- Works on any timeframe and any market (forex, crypto, stocks).
- Reduces false divergence signals through linear regression precision.
- Helps identify early trend reversals with clear visual alerts.
- Fully customizable colors and parameters for personal setups.
- Simplifies chart reading for both beginners and professionals.
- Improves entry and exit accuracy for divergence-based trading.
- Can be combined with other RSI or momentum indicators.
- Lightweight and optimized for fast MT5 performance.
Features
- Linear Regression Channel applied to both RSI and price.
- Dynamic color change when slope divergence occurs.
- Real-time divergence detection without delay.
- Adjustable sensitivity for divergence strength.
- Supports all chart types (candlestick, line, bar).
- Works on multiple symbols and timeframes simultaneously.
- On-chart alerts when slope changes are detected.
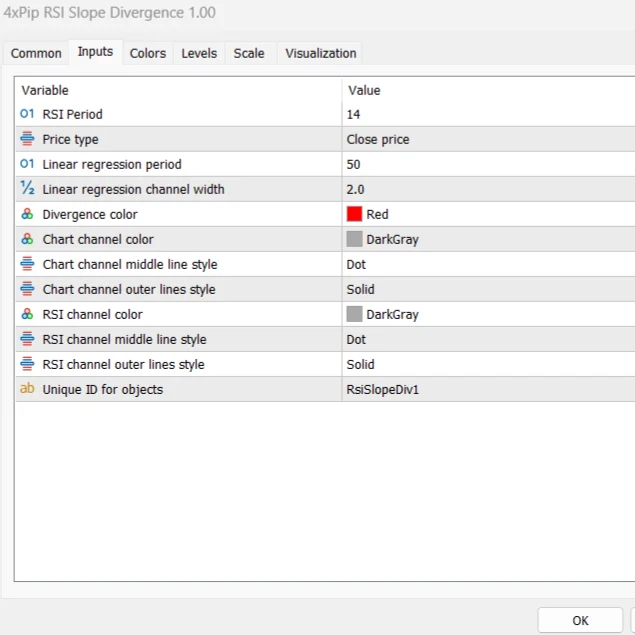
- Easy-to-use parameters for slope color, width, and RSI period.
- Non-repainting algorithm for reliable signals.
- Free download and instant installation for MetaTrader 5.
How to Trade
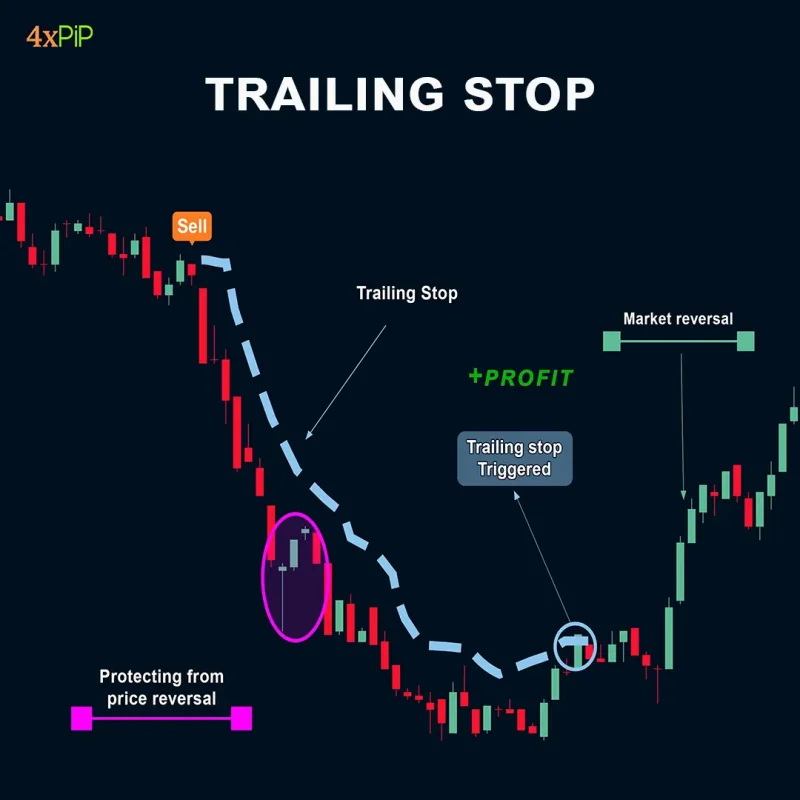
To trade with the RSI Slope Divergence Indicator, monitor the chart for color changes in the regression channel, which signal slope divergence between price and RSI. When the indicator highlights a divergence, prepare for a potential trend reversal. Enter a trade in the direction opposite to the current move once price confirms momentum loss, and set stop-losses just beyond recent highs or lows.
Combine the indicator with a trend filter like a moving average or MACD for confirmation. In strong uptrends, use bullish divergences to time entries; in downtrends, watch for bearish divergences to exit or short. This approach enhances precision and minimizes false reversals while maintaining early trade positioning.
Formula
RSI = 100 − 1001 + RS
RS = Average Gain (n periods)Average Loss (n periods)
Conclusion
The RSI Slope Divergence Indicator for MetaTrader 5 gives traders a smarter way to detect divergence between price and momentum. By using linear regression channels, it provides fast and accurate divergence signals without waiting for bar confirmation. It’s a simple yet powerful tool that helps identify trend reversals, improve trade timing, and increase confidence in RSI-based strategies.
DOWNLOAD NOW Reach Us on WhatsApp
 Fly Over to Telegram
 Drop Us an Email
FAQ's
Q & A
Related products
-
 Premium
MT5 Trailing Stop EA
Original price was: $99.00.$10.00Current price is: $10.00. Select options -
 Free
FreeMT5 Super Trend Indicator
$0.00 Select options -
 Free
FreeMT5 EA Drawdown Limiter
Original price was: $100.00.$10.00Current price is: $10.00. Select options -
 Premium
Forex Scanner: Dashboard Scanner for MT5 | Market Scanner
Original price was: $299.00.$199.00Current price is: $199.00. Select options
Reviews
There are no reviews yet