
QQE Averages Histogram with Arrows for MetaTrader 4
$0.00
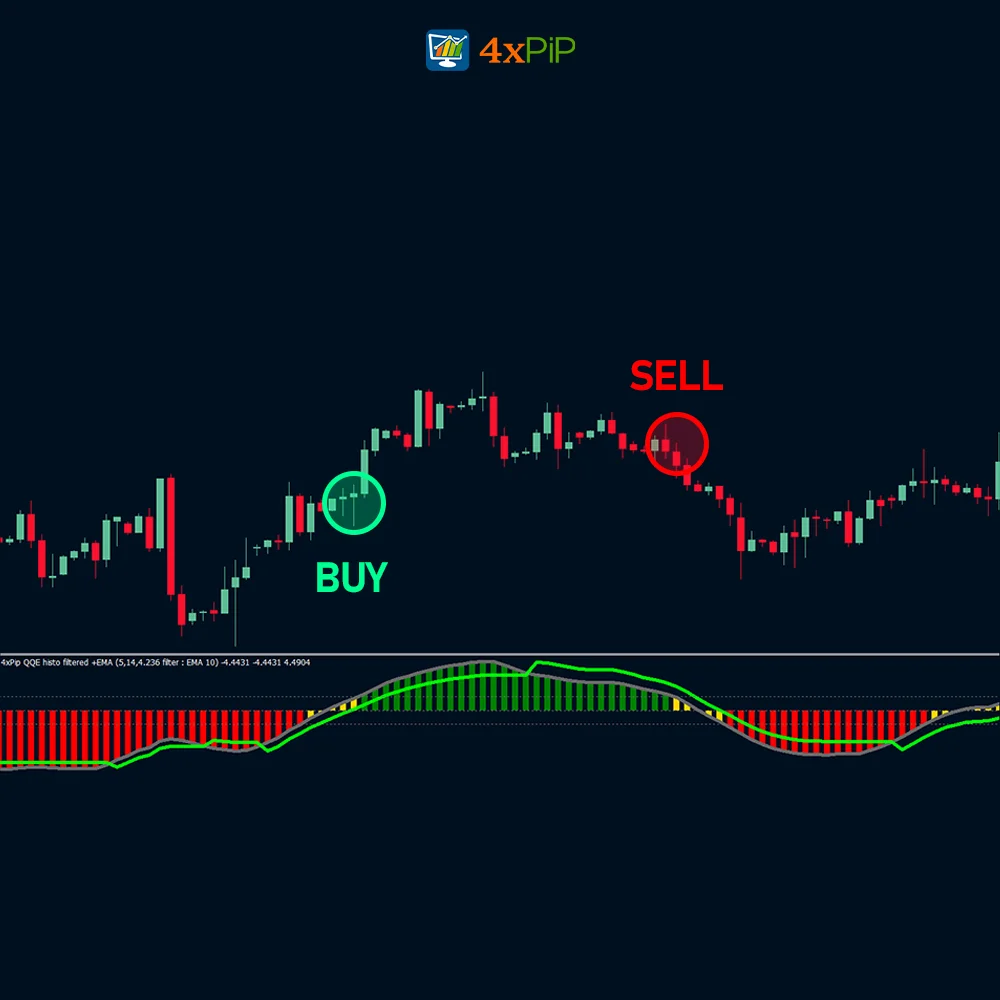
Quantitative Qualitative Estimation Indicator is a highly accurate MetaTrader 4 indicator that provides entry and exit points for traders. It shows arrows on the histogram which indicates potential buying and selling opportunities in the market. It helps traders to make calculated decisions that result in profits.
Description
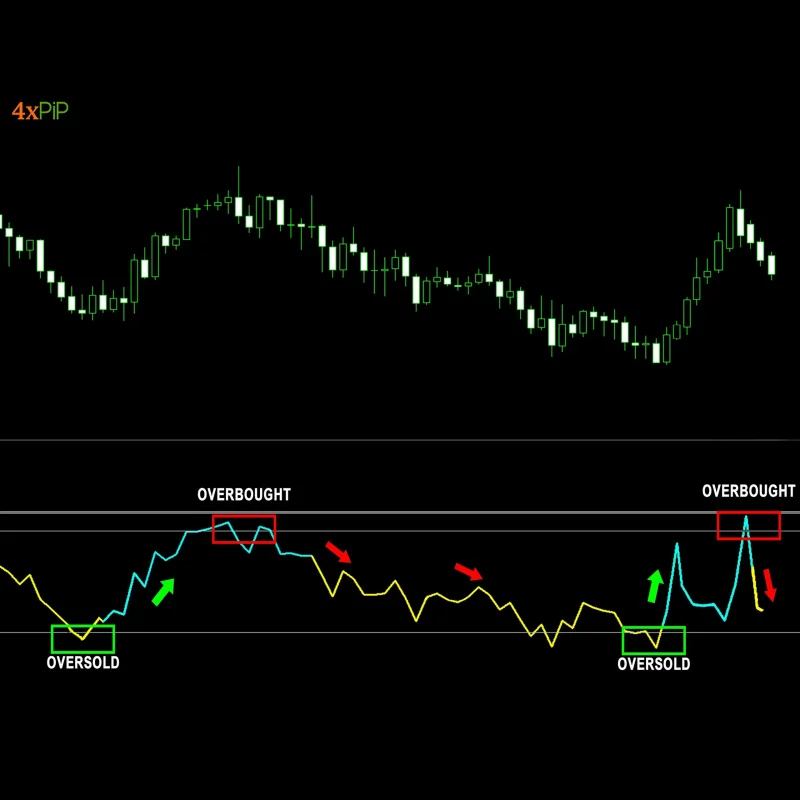
What is the QQE Indicator? QQE stands for Qualitative Quantitative Estimation. It’s an indicator that helps traders predict market trends. It’s made by improving RSI with smoothing. QQE is reliable even during volatile times, like after the 2008 financial crisis. It doesn’t delay and hardly gives wrong signals. The histogram in this indicator shows the QQE value. The bars go up and down around a middle line, sometimes in different colors for plus and minus values. Arrows are overlaid on the histogram to visually represent potential buy and sell signals. Upward arrows might suggest bullish momentum, while downward arrows indicate bearish momentum.
By combining the QQE’s momentum measurement with a histogram and directional arrows, this indicator aims to provide traders with a clearer visual representation of potential buying and selling opportunities based on the QQE’s signals. This indicator allows customization of parameters like the moving average periods for the QQE and the conditions for displaying the arrows.
Trend Identification:
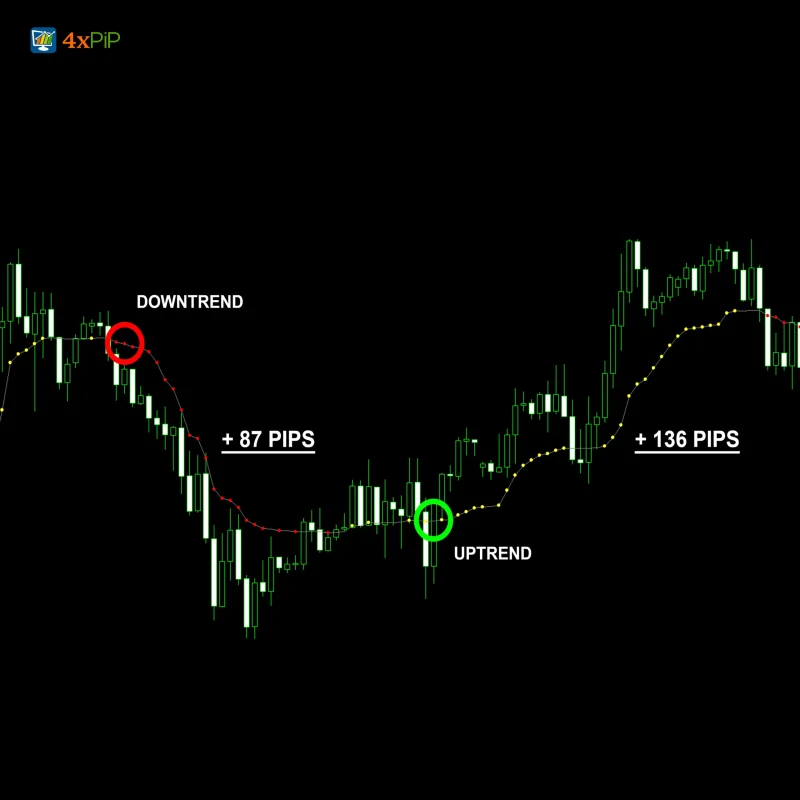
The indicator helps figure out if the trend is going up or down. When the indicator is above 50, it means the trend is going up. So, it’s a good time to buy. You can use the indicator to decide when to buy or sell: go long (buy) when it’s above 50 and go short (sell) when it’s below 50.
Overbought and Oversold Conditions:
You can use the indicator to identify when the price is in oversold and overbought positions. Therefore, when the indicator surpasses the 70 levels, it is a sign of a strong market perfect for a long position. Similarly, you can take a short position if the indicator goes towards negative values.
Formula
Wilder’s smoothing = Previous MA value + (1/n periods * (Close — Previous MA)).
How to Trade with the QQE Indicator?
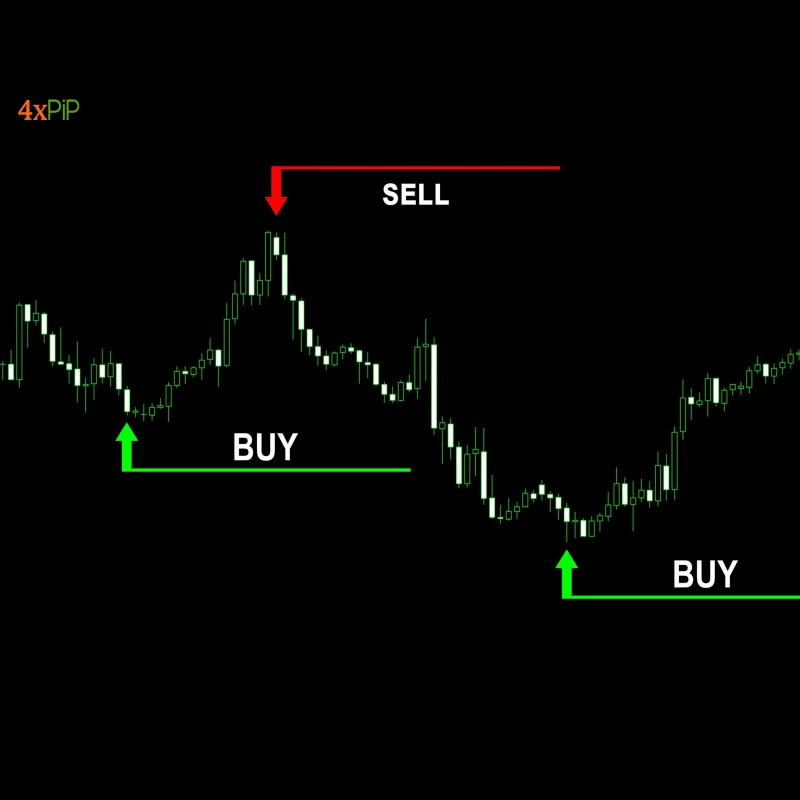
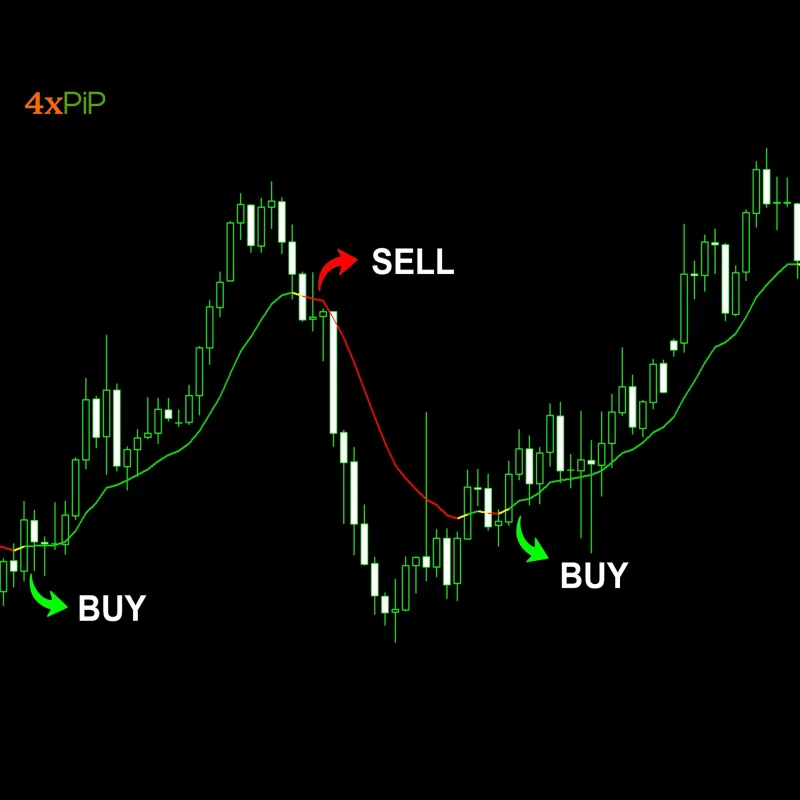
The green line (smoothed RSI) shows how prices are moving. When prices go up, the green line goes up quickly too. And when prices drop, the green line goes down too. Notice how prices change direction after hitting high or low points.
When the green line crosses below the red line, it’s a signal to sell (marked by red arrows). Likewise, when the green line crosses above the red line, it shows prices are going up. After these lines cross, prices tend to move strongly in one direction.
Features:
Here are some features offered by QQE Indicator:
- Momentum Oscillator: Similar to the Relative Strength Index (RSI), the QQE is a momentum indicator that measures the speed and strength of price movements. It helps identify potential overbought and oversold conditions.
- Volatility-Based Trailing Stops: Unlike RSI which uses a fixed averaging period, the QQE incorporates volatility by utilizing trailing stop levels derived from the Average True Range (ATR). This aims to adapt to changing market conditions and potentially smooth out the indicator’s readings.
- Fast and Slow Trailing Levels: The QQE indicator often calculates two trailing stop levels: a fast and a slow level. These levels fluctuate based on volatility and can provide additional insights into momentum shifts.
- Signal Line: Many versions of the QQE include a signal line plotted alongside the main oscillator line. This signal line is typically a moving average of the QQE, which can help identify potential trading signals when it crosses the main oscillator line.
- Crossover Signals: Traders may use crossovers between the QQE line and the signal line or the trailing stop levels as buy and sell signals. For instance, a bullish crossover might involve the QQE line rising above the signal line or the fast-trailing level.
- Threshold Levels: Some QQE variations might incorporate horizontal lines at specific RSI levels (e.g., 70 and 30) to represent overbought and oversold zones. These zones can be used in conjunction with the QQE’s movement and crossovers for further signal confirmation.
- Potential Trend Confirmation: The QQE’s behavior can potentially help confirm existing trends. When the QQE oscillates within a range during an uptrend, it might suggest continued buying pressure. Conversely, a downtrend may see the QQE consistently staying below the centerline.
- Customization Options: MetaTrader4 allows customization of the QQE indicator’s parameters. This includes adjusting the moving average periods for the signal line, the ATR multiplier for the trailing stops, and potentially the RSI threshold levels if used.
Conclusion
The QQE Averages Histogram with Arrows Indicator for MetaTrader 4 is an indicator designed to help traders in identifying potential buying and selling opportunities in the market. Utilizing the Qualitative Quantitative Estimation (QQE) indicator, it offers a visual representation through a histogram and directional arrows. By analyzing momentum, overbought/oversold conditions, and trend identification, traders can make more informed decisions. The indicator includes features such as momentum oscillators, volatility-based trailing stops, signal lines, crossover signals, threshold levels, and customization options.
DOWNLOAD NOW Reach Us on WhatsApp
 Fly Over to Telegram
 Drop Us an Email
Settings
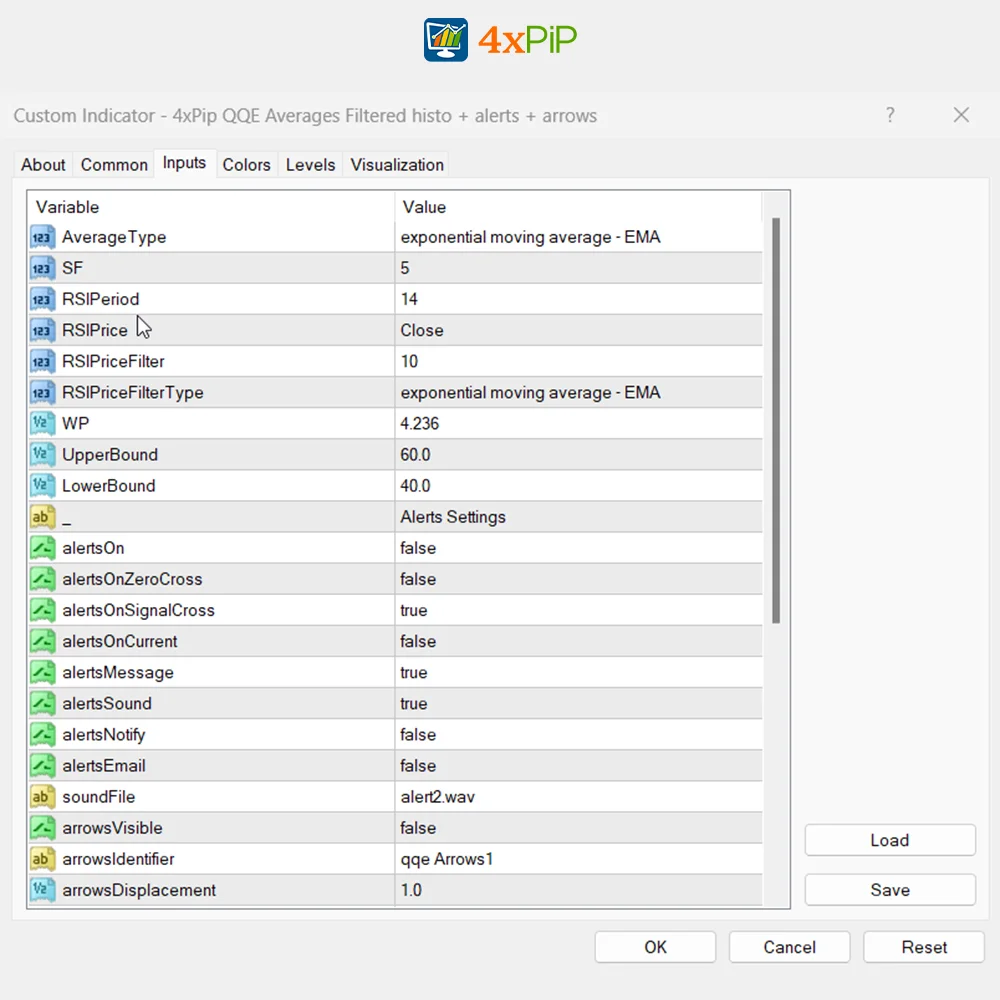
- AverageType: options = {Simple Moving Average, Exponential Moving Average, Double smoothed exponential moving average, Tripple exponential moving average}
- SF: The smoothing factor is the average used to smooth the RSI set at five by default. The lower the number, the fewer the false signals (value = 5)
- RSIPeriod: (value = 6)
- RSIPrice: options = {Open, High, Low, Close, Median, Typical, Weighted, Average, Trend Biased, Heiken Ashi}
- RSIPriceFilter
- RSIPriceFilterType
- WP: Allows changing Wilder’s period moving average that helps determine the RSI bias, (value = 4.236)
- UpperBound: It allows you to set the highest value of the indicator range, (value = 60.0)
- LowerBound: It allows you to set the lowest value of the indicator range, (value = 40.0)
- alertsOn: Used to enable or disable notifications, (value = true)
- alertsOnZeroCross: True => sends alerts on zero crosses, False => Does not send alerts on zero crosses.
- alertsOnSignalCross: True => Gives a signal when line intersects, False => does not give a signal when line intersects.
- alertsOnCurrent: True => produces a signal when the indicator and zero level intersect, False => Does not produce a signal when the indicator and zero level intersect
- alertsMessage: True/False => Enables or Disables receiving alert messages
- alertsSound: True => Turns on sound alerts, False => does not turn on sound alert
41 reviews for QQE Averages Histogram with Arrows for MetaTrader 4
| 5 star | 65% | |
| 4 star | 34% | |
| 3 star | 0% | |
| 2 star | 0% | |
| 1 star | 0% |
Q & A
The QQE Indicator is designed to be reliable even during volatile times and aims to provide accurate signals, but as with any trading tool, it's essential to combine it with other forms of analysis and exercise caution.
Yes, MetaTrader 4 allows customization of parameters such as moving average periods for the signal line, ATR multiplier for trailing stops, and potentially RSI threshold levels if used.
Traders may use crossovers between the QQE line and the signal line or trailing stop levels as buy and sell signals, indicating potential shifts in momentum.
The signal line, typically a moving average of the QQE, helps identify potential trading signals when it crosses the main oscillator line, aiding in trend confirmation.
The QQE often calculates two trailing stop levels: a fast and a slow level, fluctuating based on volatility and offering insights into momentum shifts
Martingale Forex EA is a powerful tool for serious traders. The 100% winning rate is not an exaggeration. It adapts well to market conditions, making it a valuable addition to any trading strategy.
Martingale EA is a gem in the Forex world. The Takeprofit feature is spot-on, and the counter trades work wonders. My trading has become more profitable and less stressful.
As a beginner, Martingale EA has been a game-changer for me. The automatic trading and counter trades make it easy to navigate the market. My confidence in trading has soared.
Martingale Forex EA is effective, but the 100% winning rate claim should be taken with caution. It’s a valuable tool, but like any strategy, it requires careful consideration and risk management.
Martingale Forex EA is a true winner. The 100% winning rate is backed by solid performance. It adapts well to market changes, and the counter trades are a lifesaver. Highly recommended.