MACD RSI Oscillator Indicator for MetaTrader 4 – FREE Download
$0.00
The MACD RSI Oscillator for MetaTrader 4 is a hybrid technical analysis tool that combines the momentum sensitivity of the Relative Strength Index (RSI) with the trend-following capabilities of MACD. Designed for multi-timeframe analysis, it helps traders detect divergences, evaluate market momentum, and identify potential reversal zones for high-probability trade entries.
Description
MACD RSI Oscillator
The MACD RSI Oscillator merges two of the most widely used technical indicators into a single, unified tool. By combining:
RSI – to detect momentum strength and overbought/oversold conditions.
MACD – to follow trend structure and identify crossovers.
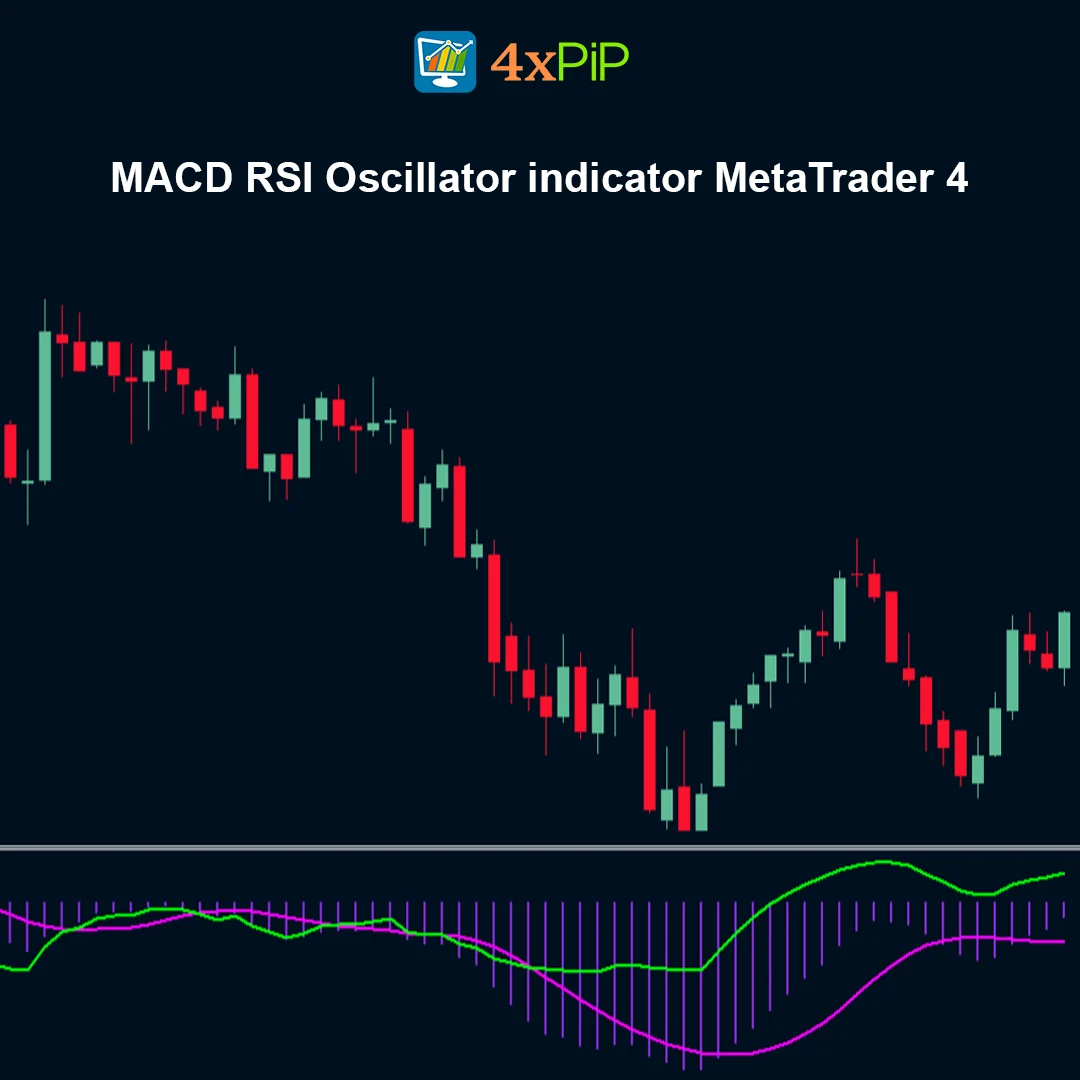
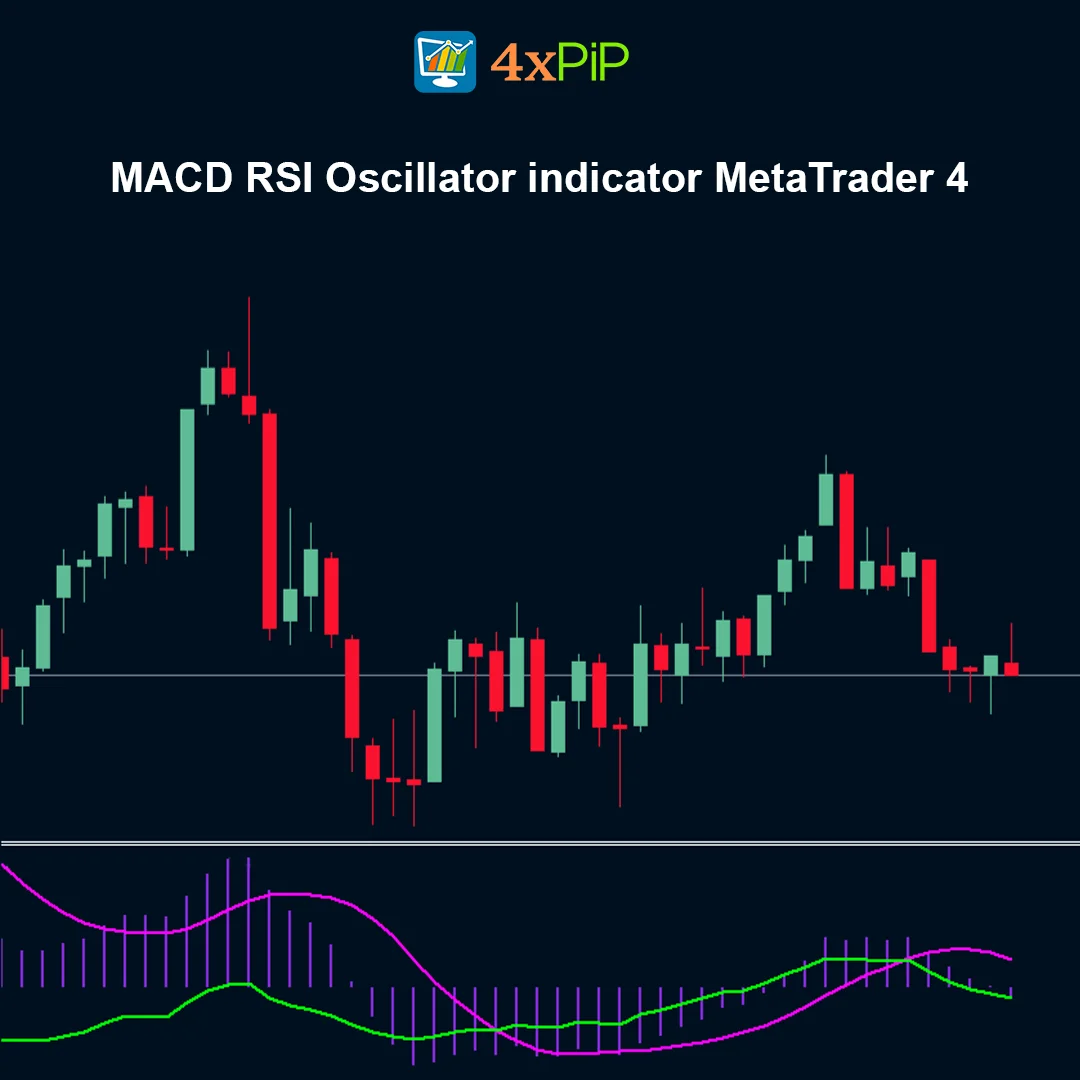
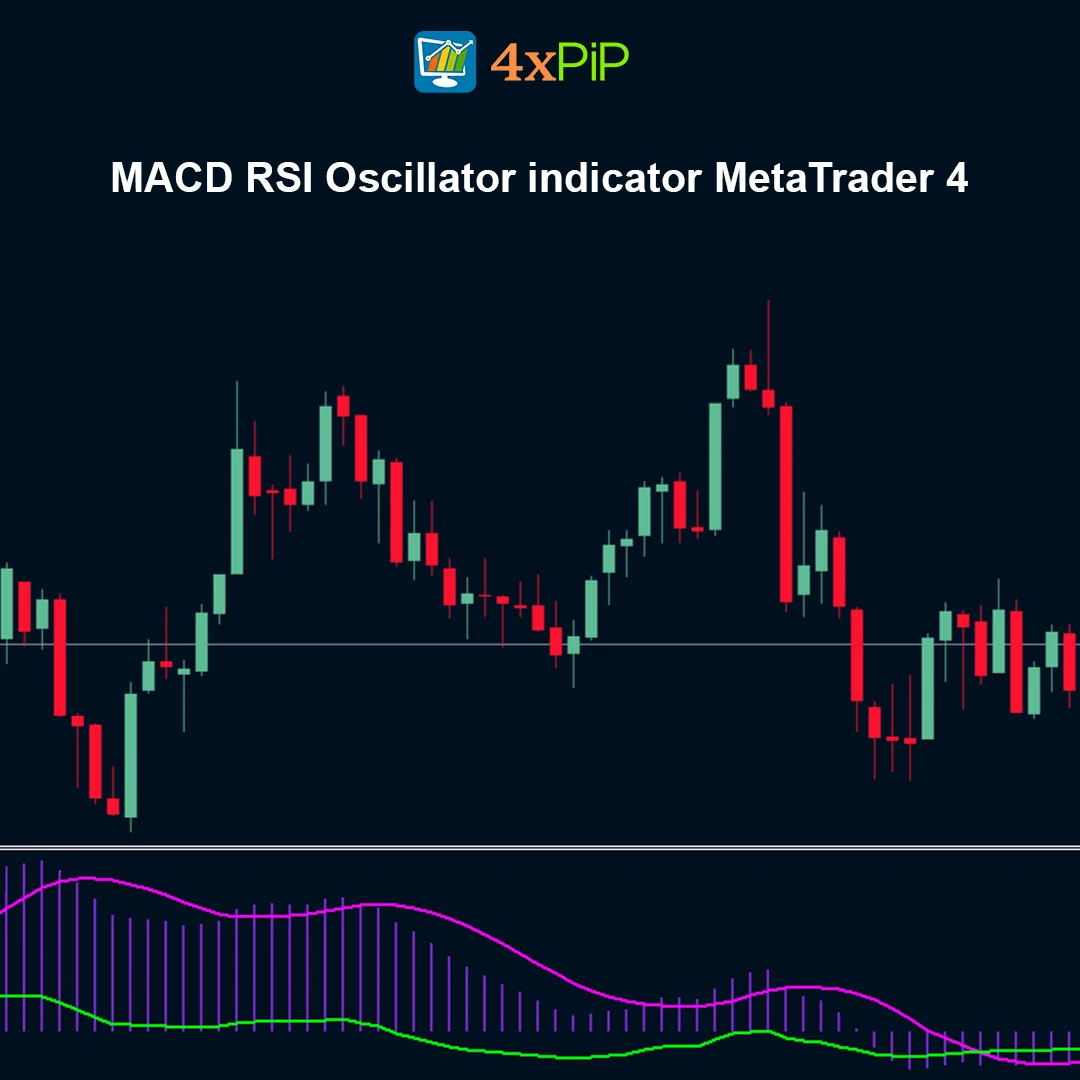
This indicator produces a multi-dimensional oscillator that provides clear visual signals using histogram bars and EMA crossovers.
It is particularly effective in:
* Spotting divergences between price and momentum.
* Confirming trend continuation or reversal points.
* Enhancing intraday decision-making with visual cues.
The histogram phase, combined with Fast and Slow EMA crossovers, generates high-probability buy or sell signals depending on market conditions.
Advantages
- Combines momentum (RSI) and trend-following (MACD) in one oscillator.
- Detects divergences for early reversal signals.
- Multi-timeframe compatible for robust analysis.
- Visual histogram and EMA lines simplify entry and exit decisions.
- Supports Forex, cryptocurrencies, stocks, indices, and commodities.
- Ideal for day trading and intraday strategies.
- Customizable parameters for flexible use.
- Reduces reliance on multiple separate indicators.
- Highlights trend strength and market momentum.
- Free and easy to install on MetaTrader 4.
Features
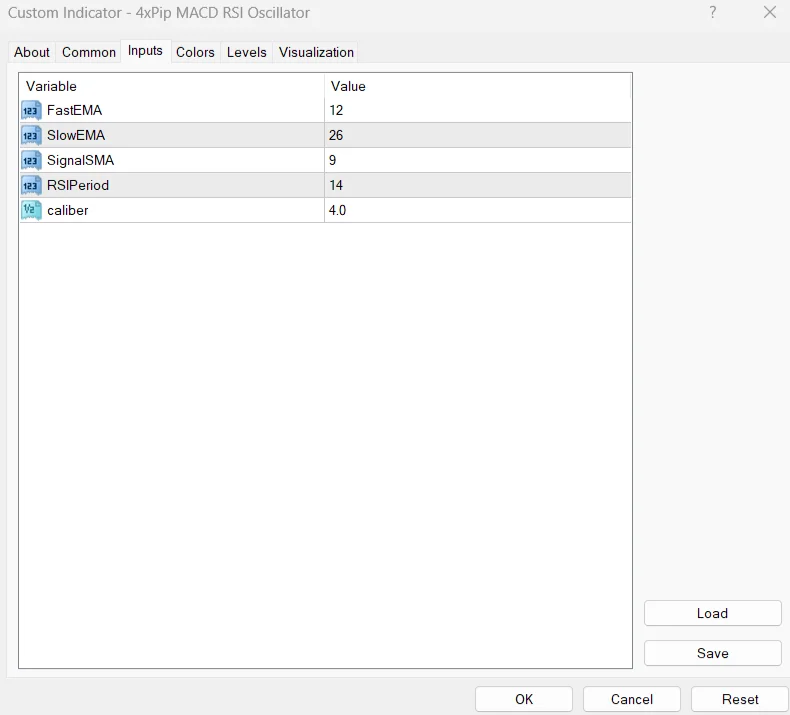
- Fast EMA for short-term trend sensitivity.
- Slow EMA for long-term trend identification.
- Signal SMA to smooth the MACD line.
- RSI period for momentum calculation.
- Caliber setting to adjust divergence detection sensitivity.
- Histogram visualization for phase shifts.
- Multi-timeframe support for trend confirmation.
- Buy and sell signals based on EMA crossovers and histogram behavior.
- Visual representation of bullish and bearish momentum.
- Optimized for MT4 performance and real-time updates.
How to Trade
- Buy Signal
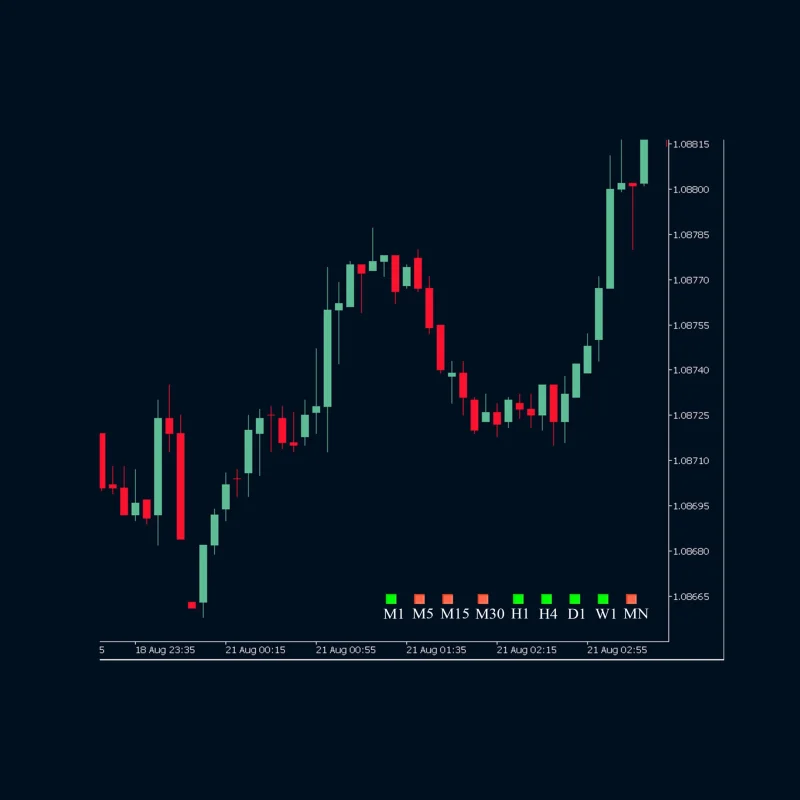
* Example: AUD/USD, 30-minute chart.
* Green EMA crosses above pink EMA.
* Histogram bars shift from negative to positive zone.
* Combined crossover and histogram phase shift → high-probability buy entry.
- Sell Signal
* Example: GBP/USD, 1-hour chart.
* Green EMA crosses below pink EMA.
* Histogram shifts from positive to negative.
* Confirms bearish momentum → high-probability sell entry.
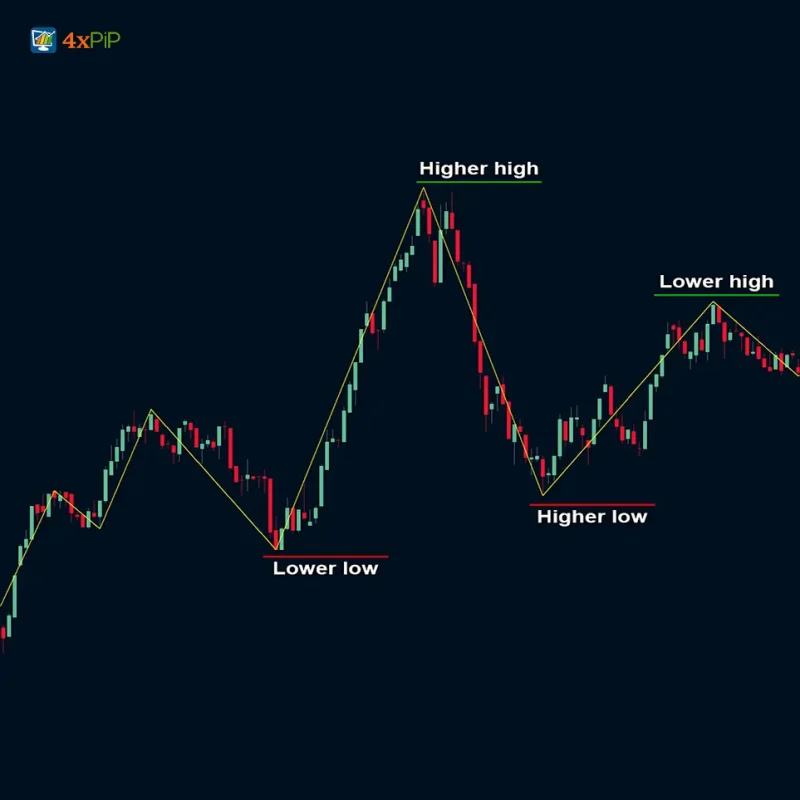
- Divergence Detection
* Compare price action with oscillator direction.
* If price makes a lower low but oscillator makes a higher low → bullish divergence.
* If price makes a higher high but oscillator makes a lower high → bearish divergence.
Formula / Logic
- RSI Calculation: Standard RSI formula over defined period.
- MACD Calculation:
* MACD Line = Fast EMA − Slow EMA
* Signal Line = SMA of MACD Line
* Histogram = MACD Line − Signal Line
- Oscillator Output: Combine RSI momentum with MACD histogram phase.
- Divergence Adjustment: Caliber parameter adjusts sensitivity to divergence detection.
Conclusion
The MACD RSI Oscillator for MetaTrader 4 is a multi-dimensional trading tool that merges trend-following and momentum analysis. By combining RSI and MACD into one oscillator, it provides layered confirmation signals, helping traders pinpoint high-probability entries and exits. Compatible with Forex, crypto, stocks, indices, and commodities, it is an excellent choice for traders seeking simplified yet powerful technical insight.
DOWNLOAD NOW Reach Us on WhatsApp
 Fly Over to Telegram
 Drop Us an Email
FAQ's
Q & A
Related products
-
 Free
FreeMT4 EA Drawdown Limiter
Original price was: $100.00.$10.00Current price is: $10.00. Select options -
 Free
FreeMT4 Indicator MTF bar detector
$0.00 Select options -
 Free
FreeMT4 Zigzag Indicator
$0.00 Select options -
 Premium
MT4 BreakEven EA
Original price was: $99.00.$10.00Current price is: $10.00. Select options
Reviews
There are no reviews yet