
Half Trend Indicator for MetaTrader 4
$0.00
A half-trend indicator is a technical analysis indicator that uses moving averages and price data analysis. It helps traders spot when a trend might change direction. It does this by looking at past prices and moving averages and then showing arrows on a chart where the market might change direction.
Description
What is the Half Trend Indicator? The Half Trend MT4 Indicator is an excellent indicator for online forex traders. It helps you figure out the direction of a trend accurately. This indicator gives you signals to buy or sell currency, shown with arrows on your chart. It’s also good at telling you when to exit a trade.
It works by using moving averages to figure out these signals. You can use it on any time frame to trade throughout the day. Forex traders like it because it gives clear signals without repainting.
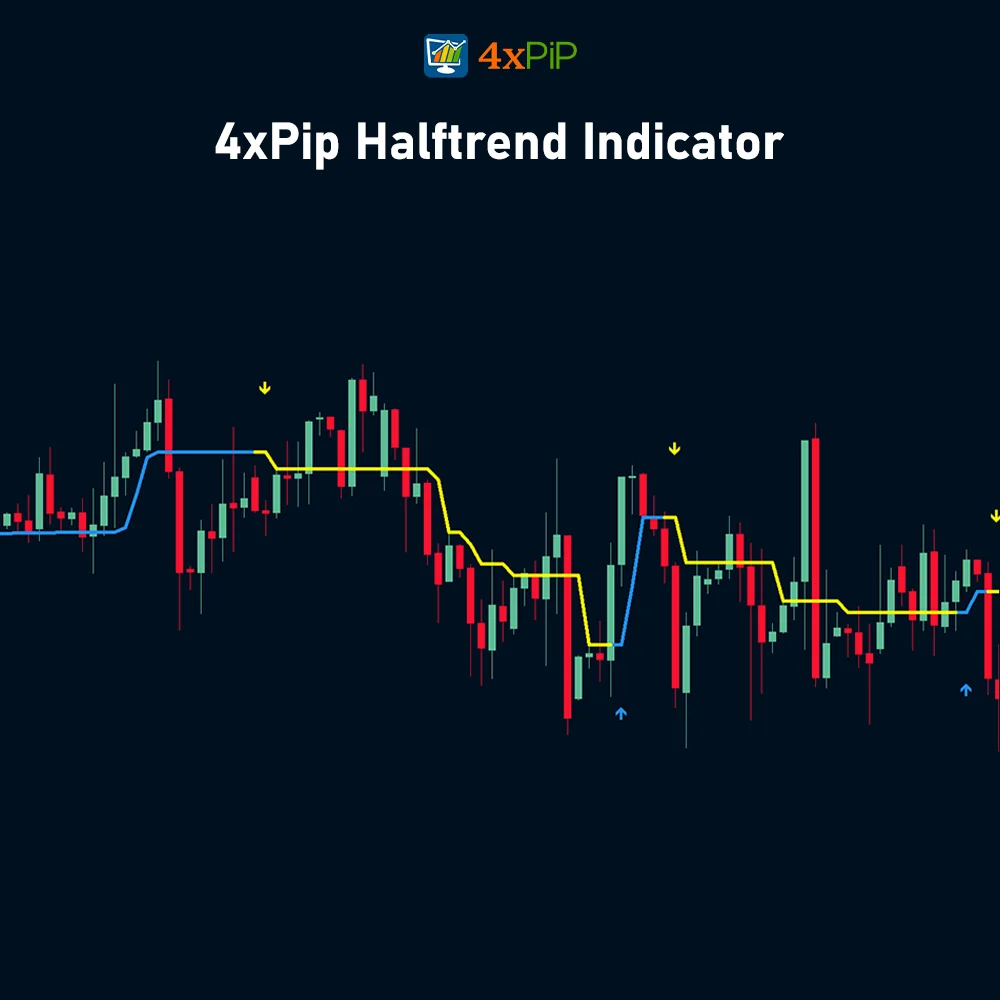
This indicator also shows how strong a trend is. If there’s no trend, it stays flat. But if there’s a trend, it slopes in that direction. A steeper slope means a stronger trend. When there’s a strong uptrend, the indicator turns blue and slopes sharply upward. In a strong downtrend, it turns red and slopes steeply downward.
Components of a Half Trend indicator:
There are two main components of a half-trend indicator.
Half trend line:
Half trend line represents this indicator on a candlestick chart. This line shows the trend of a chart in real time. A half-trend line is based on the moving averages. There are two further components of a half-trend line. A red line represents a bearish trend. When the half-trend line turns red, a trend is facing a dip. It is time for the bears to take control of the market. A bearish control of the market represents the domination of sellers in the market. On the other hand, the blue line represents the bullish nature of the market. It tells a trader that the bullish sentiment of the market is prevailing. A bullish market means the number of buyers is significantly greater than the number of sellers. Moreover, a trader can change these colors to his choice by customization.
Arrows:
There are two types of arrows in this indicator which help a trader with the entry and exit points. A blue arrow signals a buying trade; on the other hand, a red arrow tells a trader about the selling of the assets. These arrows work with the moving average line to formulate a trading strategy.
Formula:
Buy Signal = When price changes from Consolidation or Downtrend to Uptrend using price action calculations, EMA, and Amplitude
Sell Signal = When price changes from Consolidation or Uptrend to Downtrend using price action calculations, EMA and Amplitude
How to Trade with Half Trend Indicator?
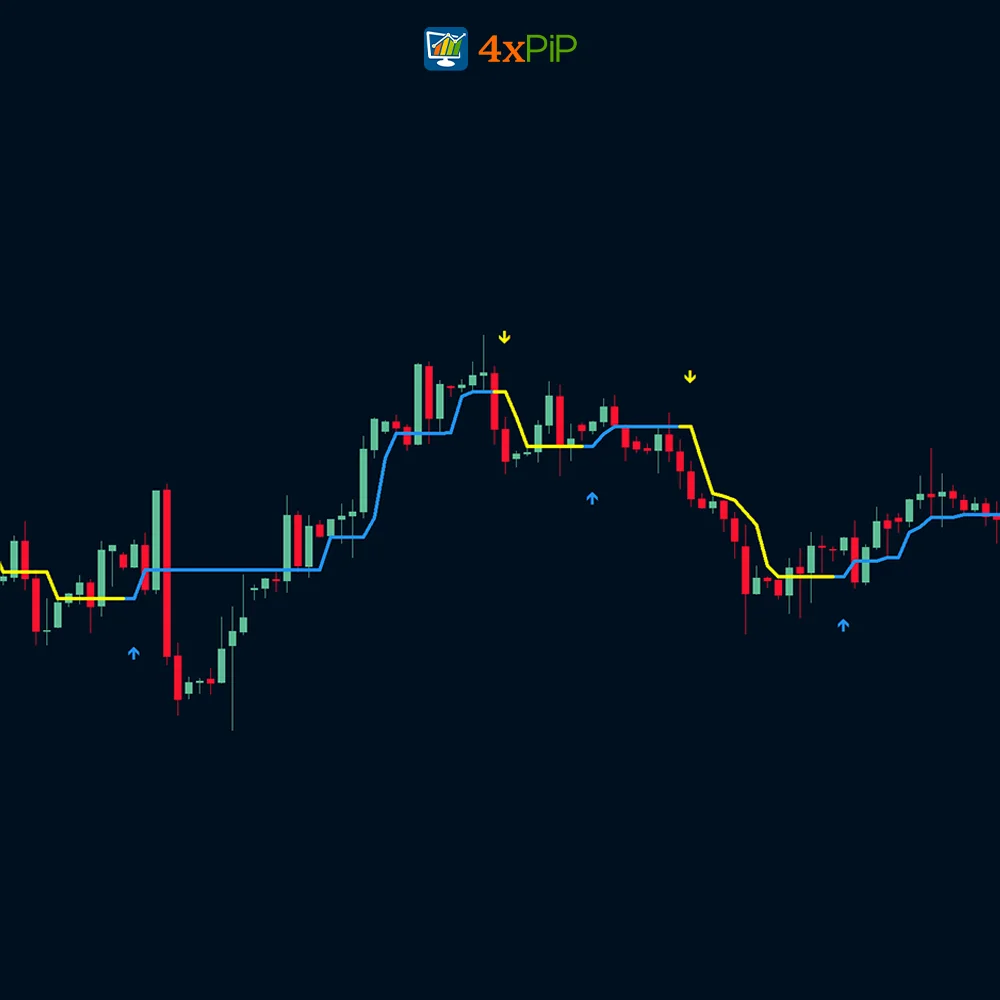
The chart shows the buy and sell arrow signals provided by the indicator. For a buy situation, firstly, the price has to go above the indicator. Secondly, the indicator has to be in blue. Thirdly, the blue color arrow signal must appear from below the indicator.
Oppositely for a sell Situation, the price has to be below the indicator. The indicator color should be red, and the red arrow’s appearance will validate a sell Signal. Once an entry is confirmed and trade is placed successfully. Traders can continue to hold the position and ride the trend with an exit at an opposite signal.
A stop-loss can be placed below the previous swing low for a buy position. Oppositely for a sell signal, traders can place the stops above the previous high. As the indicator is simple to visually understand the entry and exit signals and validate the trend strength. It is best suitable for new and experienced online forex intraday traders and swing traders.
Features:
- Trend Direction: The Half Trend indicator provides a clear visual representation of the current trend direction by using a colored line. The line turns blue when the market is in a bullish trend and red when it’s bearish. This makes it easy for traders to identify potential entry and exit points for their trades.
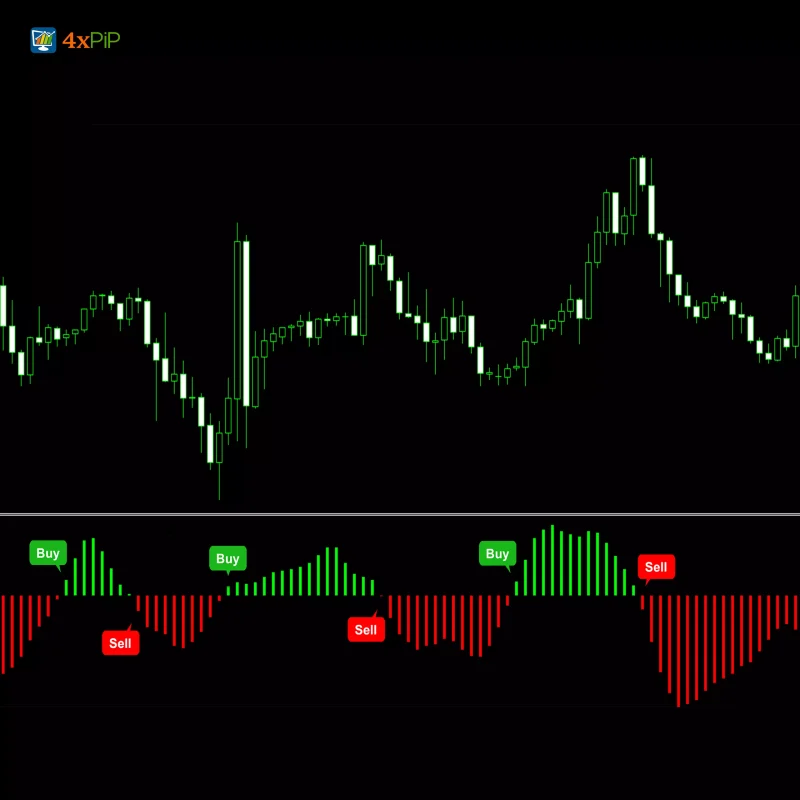
- Buy/Sell Signals: The indicator generates arrows to signal potential buy and sell opportunities. These arrows appear when the trend changes direction, making it easier for traders to time their entries and exits.
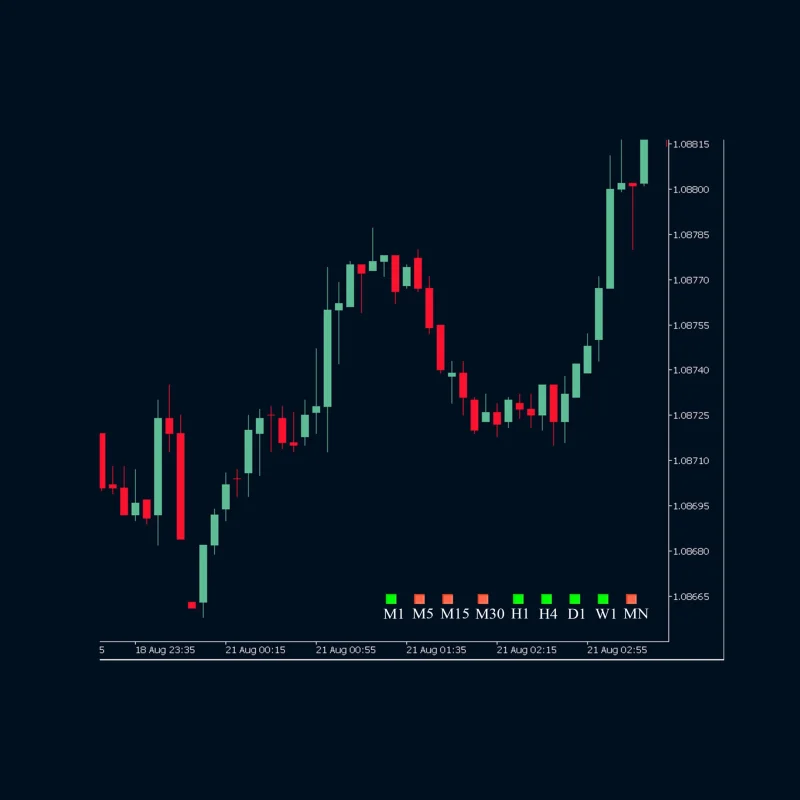
- Multiple Timeframes: The Half Trend indicator can be used on any timeframe, from short-term charts like 1-minute to long-term charts like daily or weekly. This allows traders to adapt the indicator to their specific trading style and risk tolerance.
- User-Friendly: The Half Trend indicator is relatively simple to use, even for beginner traders. The indicator’s clear visual signals and lack of complex parameters make it easy to understand and implement in a trading strategy.
- Customization: While user-friendly, the Half Trend indicator also offers some customization options. Traders can adjust the indicator’s settings to fine-tune its sensitivity and filter out false signals. Some common customization options include the lookback period, ATR multiplier, and ATR period.
- Alerts: The Half Trend indicator can be set to generate alerts when it generates a buy or sell signal. This can be helpful for traders who want to be notified of potential trading opportunities even if they are not actively watching their charts.
- Works with All Markets: The Half Trend indicator can be used on any market, including forex, stocks, futures, and commodities. This makes it a versatile tool that can be used by traders of all asset classes.
- Moving Average Customization: Many Half Trend Indicators allow customization of the moving average used in its calculations, allowing you to adjust its sensitivity to price movements.
Conclusion
The Half Trend Indicator is a useful tool for forex traders using MetaTrader 4 (MT4). It helps traders spot trends and decide when to enter or exit trades. The indicator uses moving averages to show trend strength and direction with colored lines and arrows for buy and sell signals on the chart. It’s easy to use, good for all trader levels, and can be customized to suit different trading styles. The Half Trend Indicator works on different timeframes and markets, making it versatile for traders looking to improve their forex trading decisions.
DOWNLOAD NOW Reach Us on WhatsApp
 Fly Over to Telegram
 Drop Us an Email
Settings
- Timeframe
- Amplitude (value = 2)
- alertsOn: Turns on the MT4 alerts. (value = True)
- alertsOnCurrent: True- Alerts signals in the current candle. False – Alerts upon candle close. (value = False)
- alertsMessage: Displays the alert message. (value = True)
- alertsNotification: Shows notifications of alerts.
- alertsSound: Provides sound alerts. (value = True)
- alertsEmail: Emails the MT4 alert message. (value = False)
- ShowBars: This shows the trend bars. (value = True)
- ShowArrows: Shows signal arrows. BLUE arrows for BUY signals and a RED arrow for SELL signals. (value = True)
- arrowSize
- uparrowCode
- dnarrowCode
- ArrowsOnFirstBar
41 reviews for Half Trend Indicator for MetaTrader 4
| 5 star | 60% | |
| 4 star | 39% | |
| 3 star | 0% | |
| 2 star | 0% | |
| 1 star | 0% |
Q & A
Customizing the moving average allows traders to adjust the indicator's sensitivity to price movements, providing more accurate signals for their trading strategies.
It can be used in various markets, including forex, stocks, futures, and commodities.
Yes, it can be set to generate alerts when it generates buy or sell signals, allowing traders to be notified of potential trading opportunities.
It can be used on any timeframe, from short-term charts like 1-minute to long-term charts like daily or weekly.
Yes, it is relatively simple to use and understand, making it accessible to traders of all levels.

Martingale Forex EA is a powerful tool, especially for navigating volatile markets. The 100% winning rate is a bit optimistic, but with proper risk management, it can be a game-changer.
Martingale EA is a reliable performer. The 100% winning rate may not be guaranteed, but it significantly improves your trading odds. Use it wisely, and it can be a game-changer.
Martingale Forex EA is effective, but don’t let the 100% winning rate claim lull you into complacency. It’s a tool, not a guarantee. Use it wisely, and it can enhance your trading.
Downloaded Martingale Forex EA, and my trading has never been better. The EA’s ability to identify optimal entry points is remarkable. It’s a must-have for serious traders.
Martingale EA is a brilliant creation. The 100% winning rate is not an exaggeration. It has significantly improved my trading success, and the counter trades are a genius addition.