Dynamic Support and Resistance Daily High Low – Indicator for MT5
$0.00
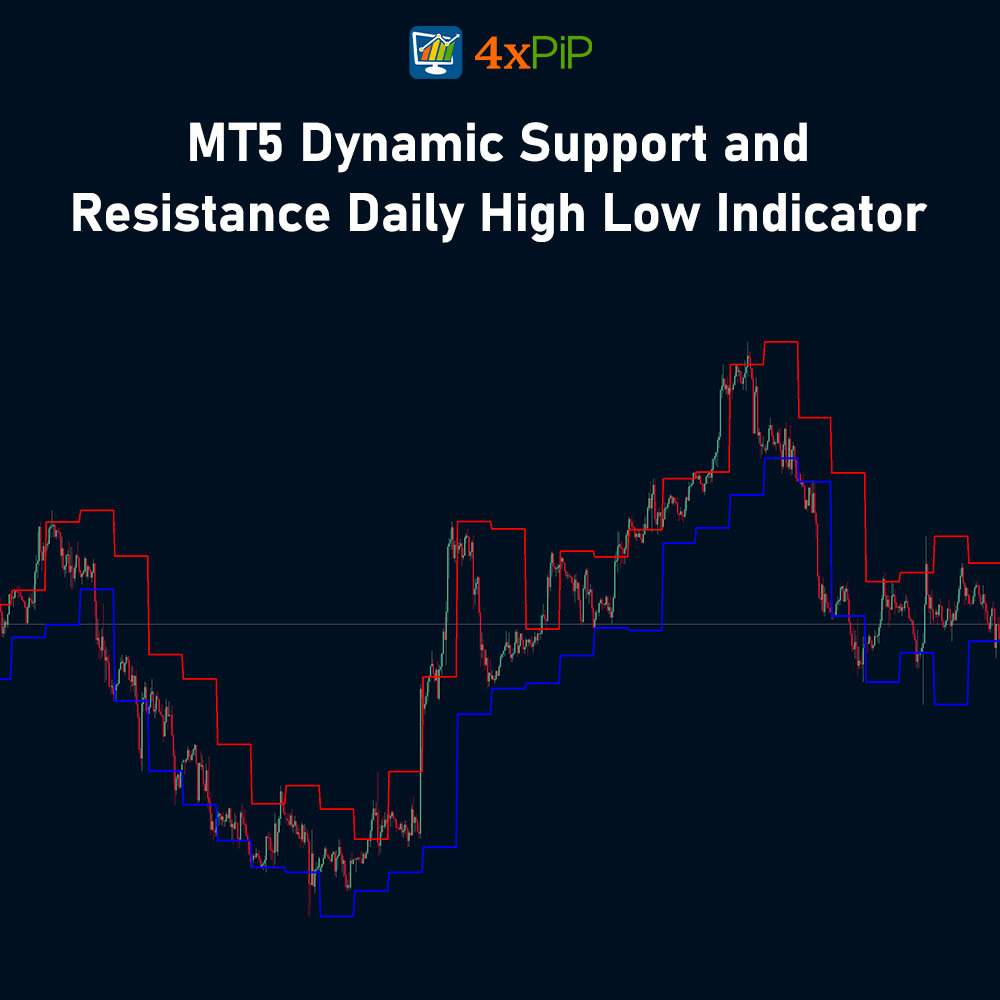
4xPip Dynamic Support and Resistance Daily High Low indicator for MT5 is an innovative tool that draws support and resistance lines based on daily high and low prices directly onto your price chart, offering a new and practical approach to analyzing the constantly changing landscape of forex trading.
Description
What is Dynamic Support and resistance? Dynamic support and resistance refer to levels or zones within the market where it can retreat and receive support without adhering strictly to horizontal support or resistance lines. This is done because of the market’s continuous change, where buying and selling interest shifts may not align with pre-established levels. Also, the dynamic support or resistance levels are moving and are not horizontal.
High Low method in Forex trading
The high-low method involves straightforward analysis with minimal calculation effort. After the initial low (L), a subsequent high (H) is followed by the second low (LL or lower low). If the price breaks the established trend structure and forms a higher high, traders should prepare to initiate a buy or long position when the price reaches a specific level. Moreover, breaking yesterday’s high or low indicates a likely continuation in the direction of the breakout.
Traders can use Pivot Points as price levels to identify intraday support and resistance levels. These points are calculated by determining a Pivot Point for the current day based on the previous day’s Open, High, and Low prices.
If evolving market dynamics frustrate you because static support and resistance levels often fail to capture them. Furthermore, 4xPip is introducing the Dynamic Support and Resistance Daily High Low indicator for MT5, your new weapon for analyzing the ever-shifting landscape of forex trading. Also, this indicator draws a support and resistance line on daily high and low prices in your price chart.
Formula of MT5 Dynamic Support and Resistance Daily High Low
Resistance Line = Today’s High
Support Line = Today’s Low
How to Trade with Dynamic Support and Resistance Daily High Low MT5 Indicator?
Utilizing the Dynamic Support and Resistance Daily High Low MT5 indicator allows for executing buy/sell trades. If the price bounces back to the resistance line, it is recommended to consider opening a sell or short trade. Set your take-profit at the support line and establish the stop-loss by the risk-reward ratio.
Also, if a price bounces back to the support line, it is recommended to consider opening a sell or short trade. Establish your take-profit level at the resistance line and set the stop-loss based on the desired risk-reward ratio. Lastly, for optimal outcomes, it is advisable to apply this indicator on timeframes of H4 or lower timeframes.
Features:
The Dynamic Support and Resistance Daily High Low indicator for MetaTrader 5 (MT5) is a technical analysis tool that redefines traditional support and resistance by incorporating real-time dynamics. Also, it provides traders with a comprehensive view of potential reversals and trend continuations.
Here are the key features of Dynamic Support and Resistance Daily High Low indicator:
- Support and Resistance: This indicator dynamically adjusts support and resistance levels based on the Daily High Low prices. Accounts for varying volatility, providing more realistic levels for potential price reversals. You can use this indicator as support and resistance.
- Moving Average Smoothing: Also, it incorporates moving averages to smooth out false signals caused by erratic price action. Highlights only the most significant support and resistance zones, reducing noise in the analysis.
- Visual Breakout Zones: This Shades the areas between support and resistance bands for clear visualization of potential breakout or pullback zones. Empower traders to anticipate price movements and make informed trading decisions.
- Intraday Trading Opportunities: Moreover, this indicator Identifies potential entry and exit points by analyzing price movements around dynamically adjusted support and resistance zones. Enables traders to capitalize on intraday trading opportunities with confidence.
- Risk Management: It Provides a visual representation of potential breakouts, facilitating strategic placement of stop-loss orders to manage risk effectively. Enhances risk management strategies by offering a dynamic view of price action.
- Customizable Parameters: Furthermore, tailor the indicator to your needs by adjusting smoothing periods and visual settings.
- Multiple Trading Applications: using this indicator for entry/exit points, confirmation of existing signals, and risk management with strategic stop-loss placement.
- Increased Market Confidence: Analyze market with greater peace of mind, knowing your Support and Resistance levels are dynamic and realistic.
- User-friendly Interface: Provides a user-friendly interface that simplifies the process of interpreting and applying support and resistance levels on daily high low prices for traders of varying experience levels.
- Trade opening, SL/TP: You can easily open trade by; either buy/sell as well as setting Stoploss/Takeprofit according to your preferences.
Conclusion
Enhance your trading experience with the 4xPip Dynamic Support and Resistance Daily High Low indicator for MT5. Moreover, by understanding its benefits and best practices, you can leverage this indicator to gain a deeper understanding of market momentum and make more informed trading decisions. Lastly, get your hands on this Dynamic Support and Resistance Daily High Low indicator for MT5 now!
Furthermore, you can contact us through the following links:
DOWNLOAD NOWQ & A
Support is evident at critical levels where a descending price trend encounters a clustering of buyers, while resistance manifests at key levels where an ascending price trend encounters a clustering of sellers.
Customer Support answered on March 15, 2024It's crucial to understand that support and resistance levels are not precise price points but zones where demand and supply shifts can occur.
Customer Support answered on March 15, 2024One needs to examine chart and pinpoint substantial pauses during price declines or rises to recognize support or resistance levels. Subsequently, observe whether the price comes to a stop and undergoes a reversal as it approaches that particular level.
Customer Support answered on March 15, 2024The Previous Day's High (PDH) and Previous Day's Low (PDL) are fundamental instruments for day traders. They provide valuable insights into market sentiment, aid in identifying potential reversal points, and function as crucial support and resistance levels.
Customer Support answered on March 15, 2024In trading, the term "Previous Open/High/Low/Close" (or previous OHLC) denotes the instrument's opening, high, low, and closing prices during the previous day. These values are commonly employed in technical analysis to recognize trends and patterns and to inform trading decisions.
Customer Support answered on March 15, 2024Sorry, no questions were found
Related products
-
 Free
FreeMT5 EA Bollinger Band
Rated 4.97 out of 5$100.00Original price was: $100.00.$20.00Current price is: $20.00. Select options -
 Free
FreeMT5 ZigZag Fibonacci Indicator
$0.00 Select options -
 Free
FreeAuto Risk-Based Lot for MT5 EA
Rated 5.00 out of 5$30.00 Select options -
 Premium
MT5 BreakEven EA
Rated 5.00 out of 5$99.00Original price was: $99.00.$10.00Current price is: $10.00. Select options


 Reach Us on WhatsApp
 Fly Over to Telegram
 Drop Us an Email
Reviews
There are no reviews yet