Colored Bollinger Bands Indicator Narrowing and Widenning Phases – indicator for MetaTrader 5
$0.00
The Colored Bollinger Bands Indicator – Narrowing & Widening Phases for MetaTrader 5 is a volatility-based trading tool that visually highlights expansion and contraction phases of Bollinger Bands using dynamic color changes. It helps traders quickly identify breakout conditions, ranging markets, and potential buy/sell opportunities.
Description
What is the Colored Bollinger Bands Indicator?
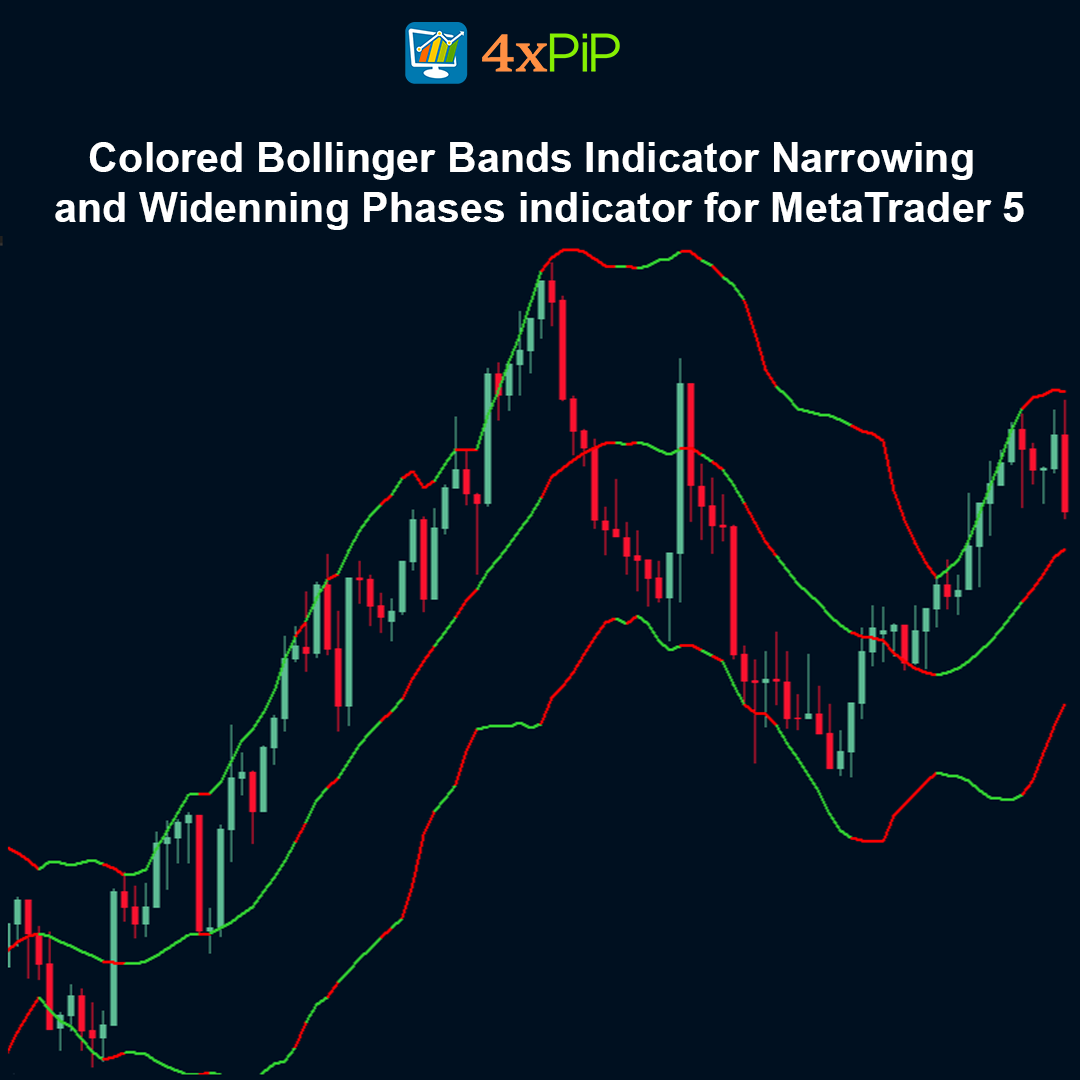
The Colored Bollinger Bands Indicator is a modified version of the classic Bollinger Bands that visually highlights market volatility using dynamic colors. Instead of displaying standard bands only, this indicator changes the color of the outer bands depending on market conditions. Green bands represent bullish volatility, while red bands indicate bearish volatility. This visual enhancement helps traders quickly understand the strength and direction of the market.
How does the Colored Bollinger Bands Indicator analyze volatility?
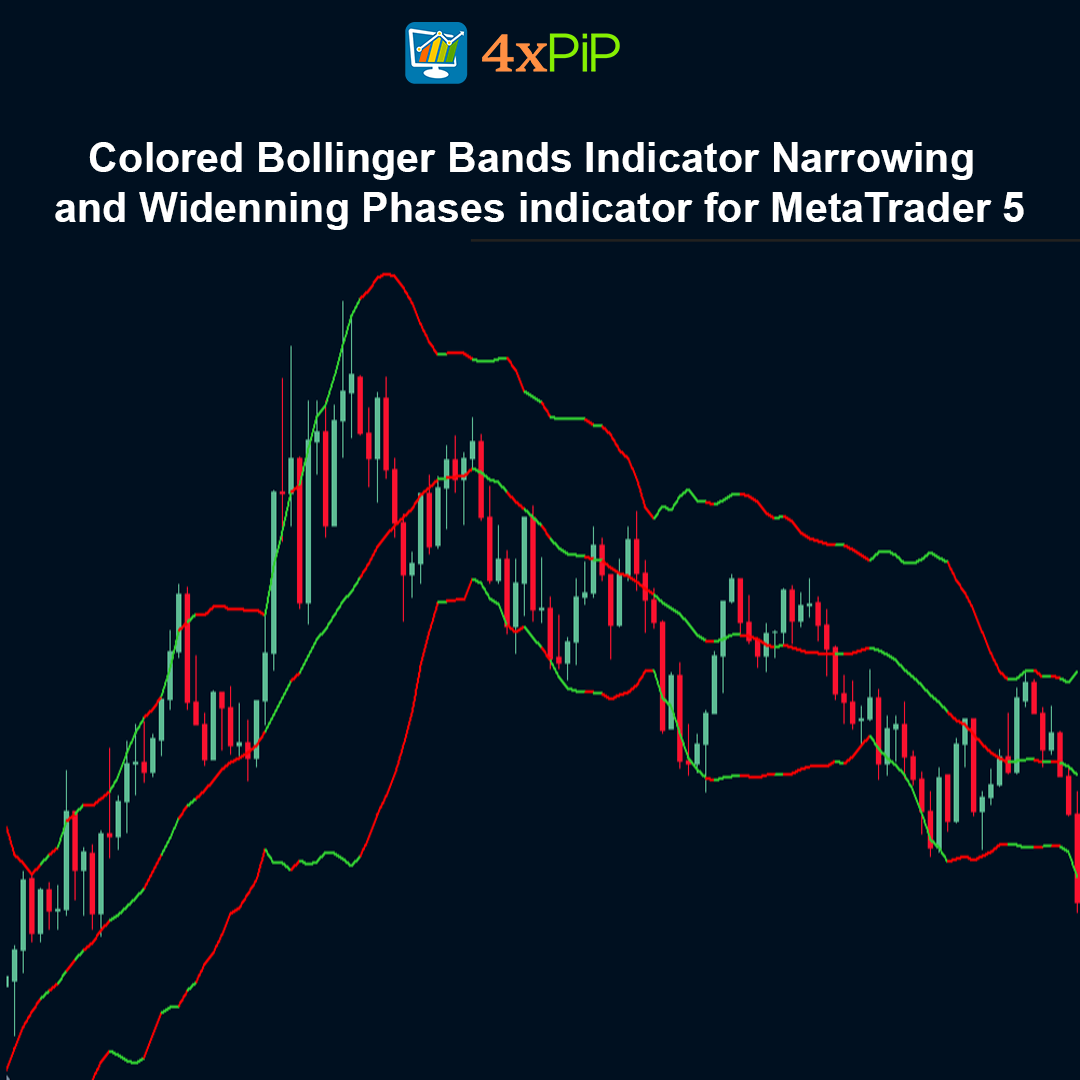
The indicator uses the traditional Bollinger Bands formula based on a moving average and standard deviation. When market volatility increases, the distance between the upper and lower bands widens, showing stronger price movement. When volatility decreases, the bands contract and move closer together, indicating consolidation. By visually highlighting these changes with colors, the indicator makes it easier for traders to identify shifts in market activity.
What do the green and red bands represent?
The colored bands provide an instant visual bias for market direction. Green bands usually indicate increasing bullish momentum and suggest that buyers are gaining control of the market. Red bands represent bearish volatility and suggest that sellers are dominating price movement. This color-based system helps traders quickly identify potential buy or sell opportunities without complex chart analysis.
How does the middle moving average help in trading decisions?
The middle line in the indicator acts as a trend filter. It represents the average price over a specific period and helps traders determine the overall market direction. If the price stays above the middle line during green band conditions, it often confirms a bullish trend. Similarly, when the price stays below the middle line during red band conditions, it can confirm bearish momentum.
Why is this indicator useful for traders?
The Colored Bollinger Bands Indicator simplifies volatility analysis by combining standard Bollinger Bands calculations with clear visual signals. Traders can quickly recognize consolidation, breakout conditions, and trend strength without interpreting complex data. Because of this simplicity, it can be useful for both beginner and experienced traders using platforms like MetaTrader 5.
Advantages
- Clear visual display of volatility phases
- Automatic color-based signal interpretation
- Works on all MT5 instruments
- Suitable for trending and ranging markets
- Helps identify breakout setups
- Beginner-friendly interface
- No complex settings required
- Supports scalping, intraday, and swing trading
- Based on proven Bollinger Bands logic
- Free to use
Features
- Built on standard Bollinger Bands formula
- Dynamic band color changes
- Volatility expansion detection
- Volatility contraction detection
- Middle moving average trend filter
- Buy/Sell color signals (Green/Red)
- Works on all timeframes
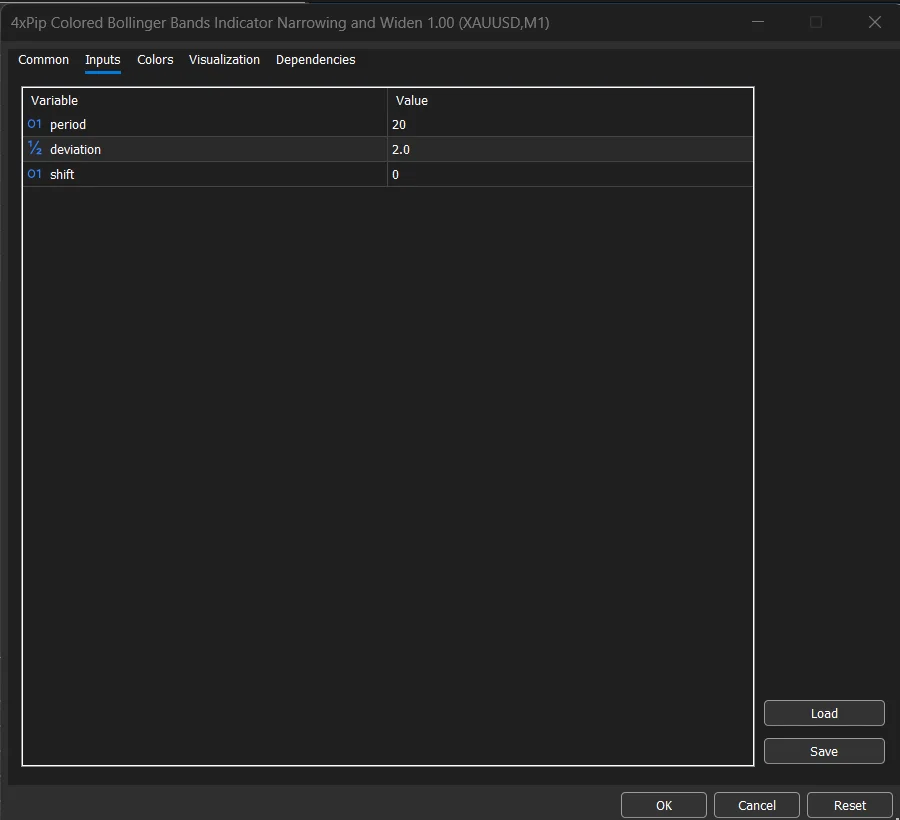
- Adjustable standard deviation settings
- Displayed directly on main chart window
- Lightweight and fast processing
How to Trade
Bullish Setup (BUY):
Wait for a candle to close above the middle moving average.Confirm both bands turn Green.Enter a LONG position with proper stop-loss below swing low.
Bearish Setup (SELL):
Wait for a candle to close below the middle moving average.Confirm both bands turn Red.Enter a SHORT position with stop-loss above swing high.
Formula
Middle Band = 20-period Simple Moving Average (SMA)
Upper Band = SMA + (Standard Deviation × Multiplier)
Lower Band = SMA – (Standard Deviation × Multiplier)
Volatility Width = Upper Band – Lower Band
Conclusion
The Colored Bollinger Bands Indicator for MetaTrader 5 simplifies market volatility analysis by converting band expansion and contraction into clear color signals. It helps traders identify trends, consolidations, and breakout opportunities with improved clarity.
DOWNLOAD NOW Reach Us on WhatsApp
 Fly Over to Telegram
 Drop Us an Email
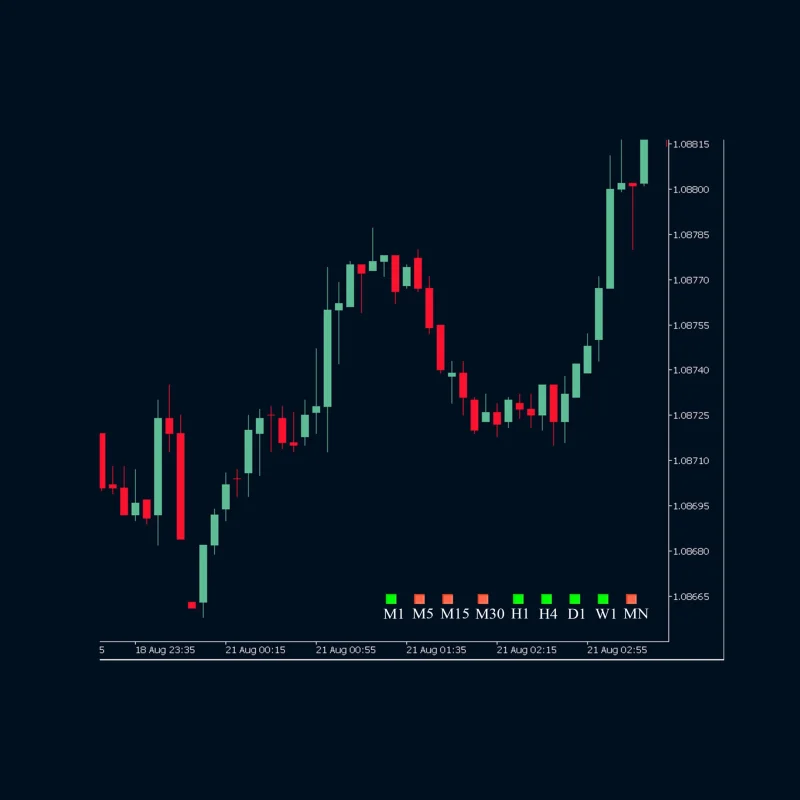
Reviews
There are no reviews yet