Bollinger Bands Squeeze – BB Trend – Bands Analysis indicator for MetaTrader 5 – FREE
$0.00
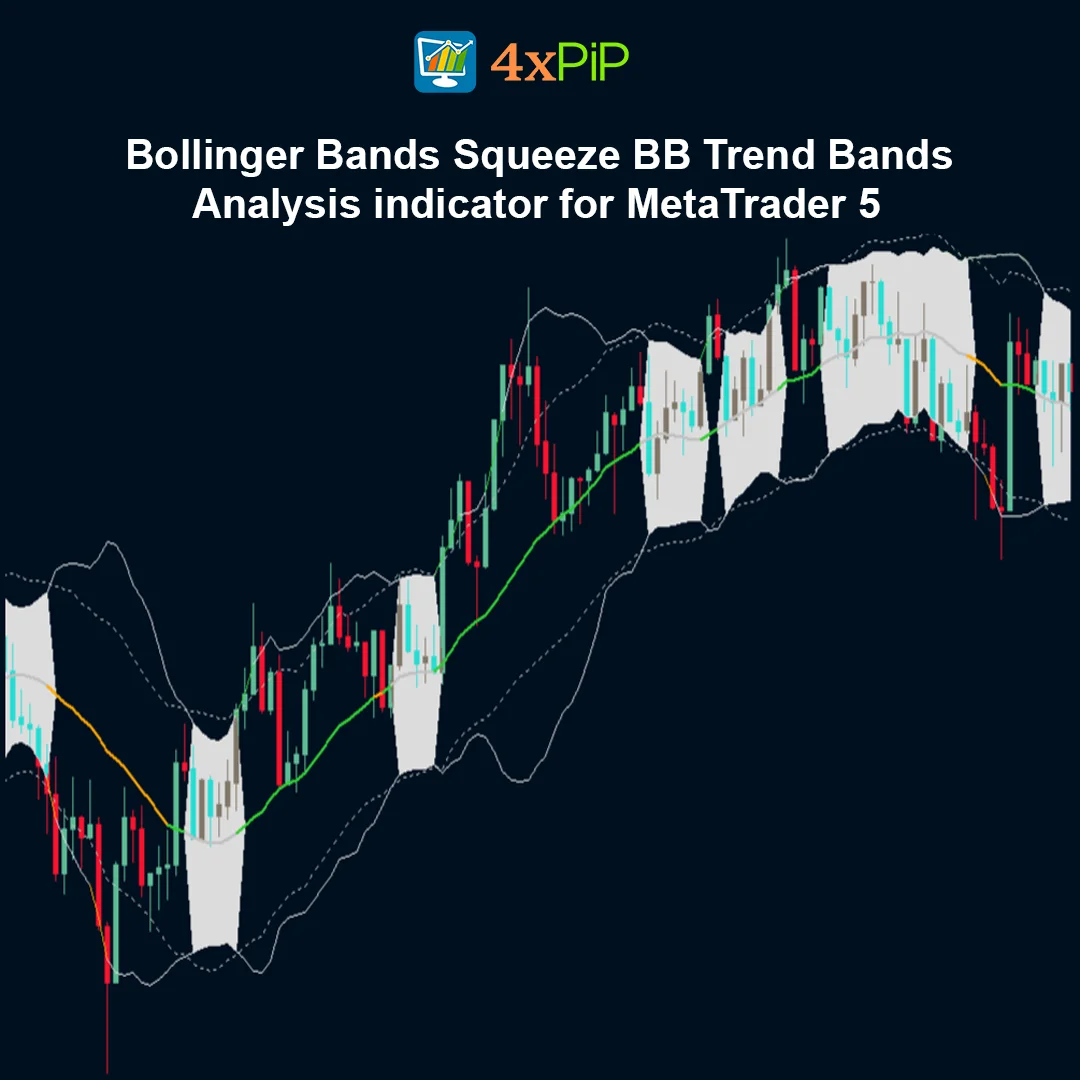
The Bollinger Bands Squeeze indicator for MetaTrader 5 is a volatility analysis tool that detects periods of extremely low market activity before strong price movements occur. When the Bollinger Bands contract tightly, the indicator highlights a “squeeze” phase, signaling that the market is consolidating and preparing for a potential breakout. Traders use this tool to identify the calm before a major price move and prepare for high-momentum trading opportunities.
Description
What is the Bollinger Bands Squeeze indicator and how does it work?
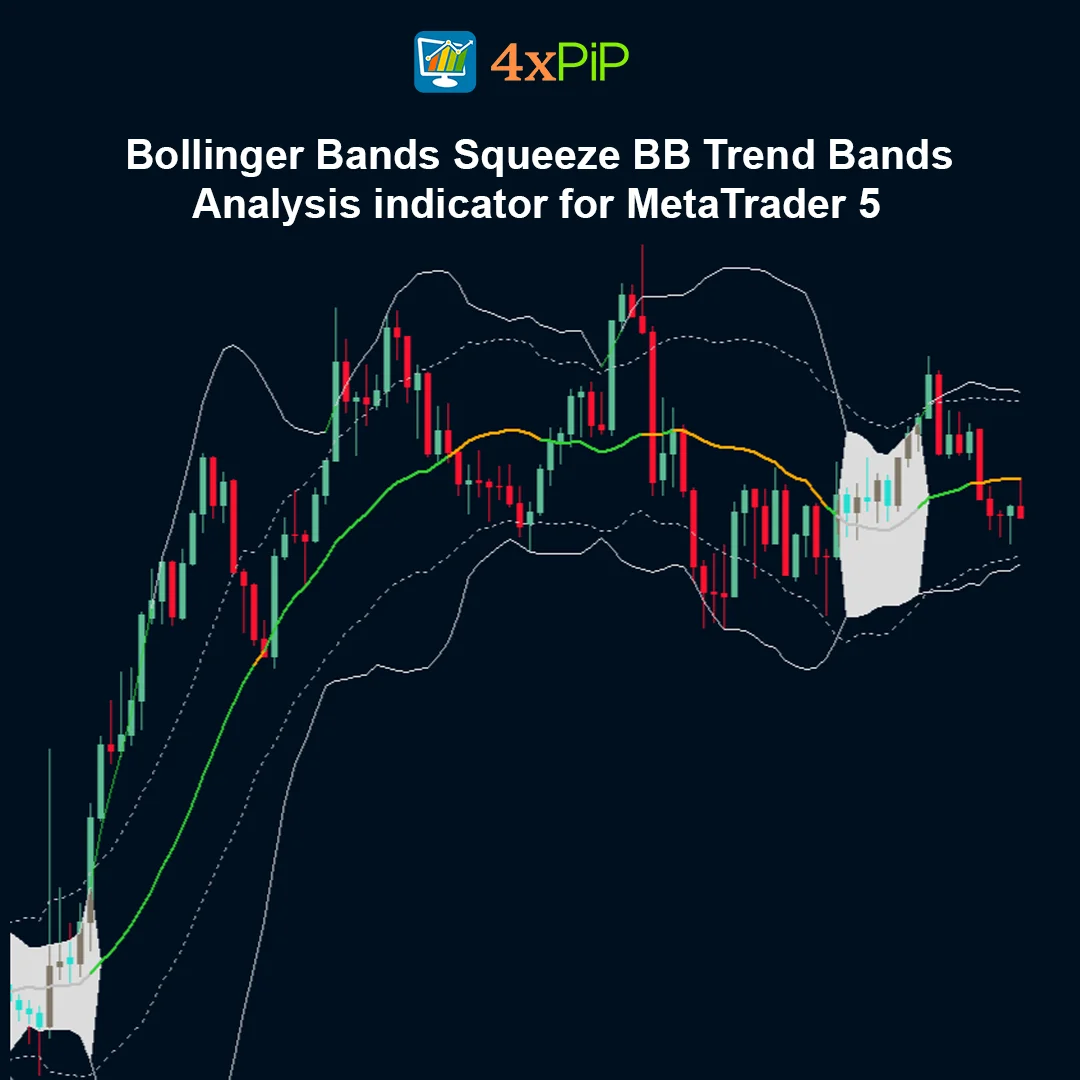
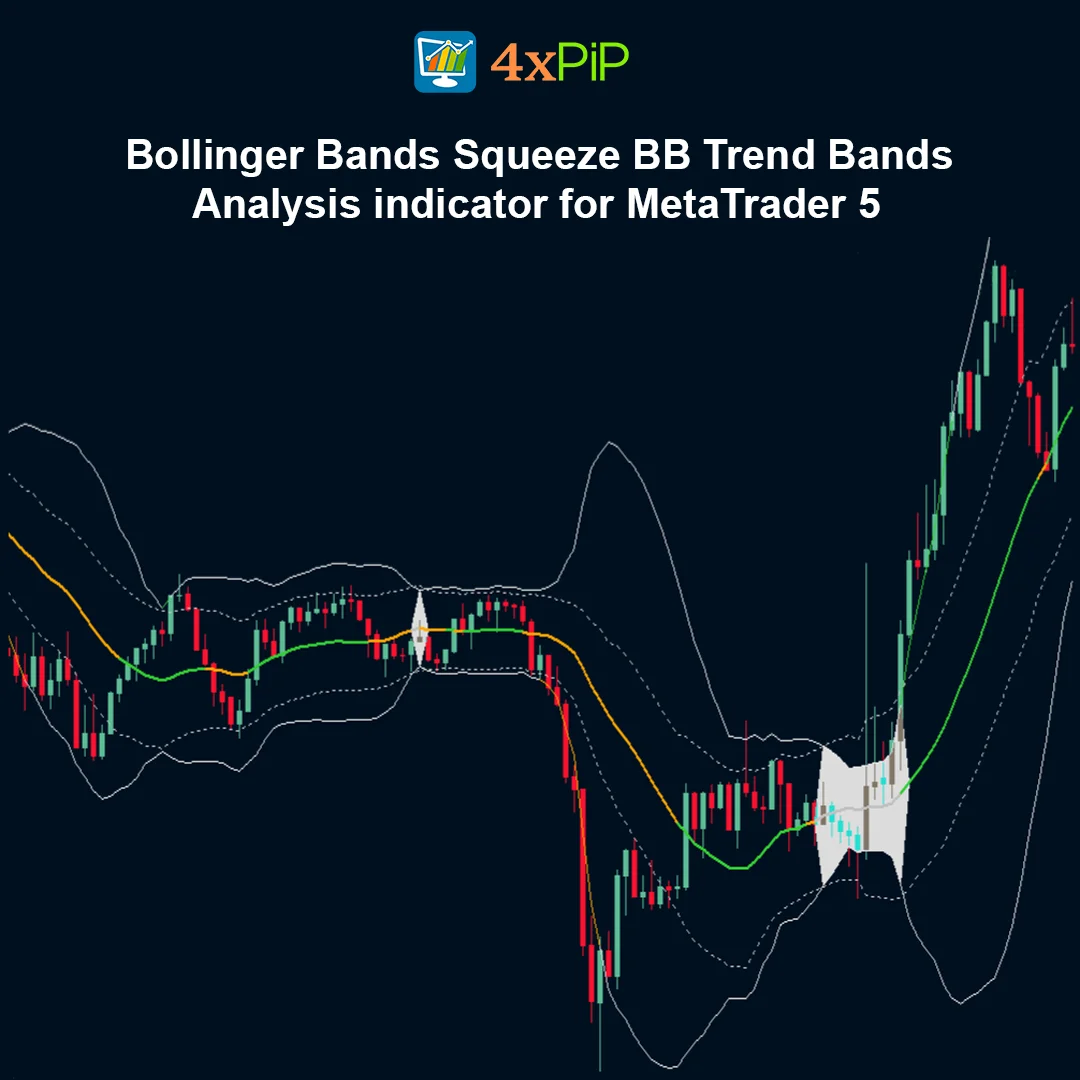
The Bollinger Bands Squeeze indicator helps traders detect moments when market volatility becomes extremely low. During these periods, the upper and lower Bollinger Bands move very close to each other, creating a compression effect. This squeeze indicates that the market is in a consolidation phase where buyers and sellers are balanced. Eventually, this balance breaks and price moves strongly in one direction, making the squeeze a valuable early signal for potential breakout opportunities.
Why do traders watch for a Bollinger Bands squeeze?
Traders monitor squeeze conditions because they often appear right before major market movements. When volatility decreases for a long period, the market stores energy similar to a compressed spring. Once volatility expands again, the price can move quickly and create strong trends. By identifying these moments early, traders can prepare entry strategies and position themselves before the market becomes highly active.
Can the Bollinger Bands Squeeze predict the direction of the move?
The squeeze itself does not determine whether the price will move upward or downward. Instead, it simply warns traders that a large move is likely to happen soon. To determine direction, traders typically use confirmation tools such as price action, trading volume, support and resistance levels, or momentum indicators. These additional signals help traders identify the most probable breakout direction.
How can traders combine the squeeze with other indicators?
Many traders combine the Bollinger Bands Squeeze with indicators such as RSI, moving averages, or candlestick pattern analysis. For example, if a squeeze occurs and the price breaks above a resistance level with strong volume, it can confirm a bullish breakout. Using multiple indicators together increases the reliability of trading signals and reduces the chances of false breakouts.
Advantages
- Helps identify low-volatility market conditions before breakouts.
- Provides early signals of potential high-momentum price movements.
- Easy to interpret visually on charts.
- Works on multiple trading timeframes.
- Suitable for Forex, crypto, stocks, and indices.
- Helps traders prepare for trend initiation phases.
- Can be combined with many other indicators.
- Supports breakout trading strategies.
- Helps avoid trading during slow consolidation periods.
- Fully compatible with MetaTrader 5 platform.
Features
- Detects Bollinger Band contraction (squeeze).
- Highlights volatility expansion phases.
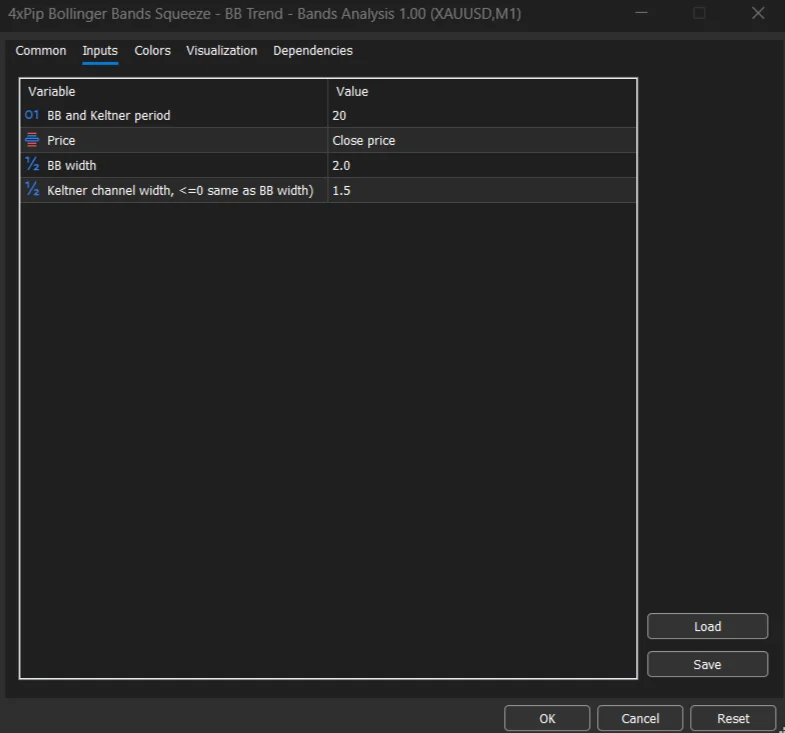
- Based on 20-period SMA and standard deviation calculations.
- Displays upper, middle, and lower bands.
- Adjustable period and deviation settings.
- Supports multi-timeframe analysis.
- Works across multiple financial markets.
- Provides clear visual representation of volatility changes.
- Lightweight indicator with fast performance.
- Easy installation on MT5 charts.
How to Trade
Identify when the Bollinger Bands contract tightly, forming a squeeze.Wait for the bands to begin expanding again.Watch for a price breakout above the upper band for a potential buy setup.Watch for a breakout below the lower band for a potential sell setup.Confirm the direction using volume, candlestick patterns, or RSI.Enter the trade once the breakout is clearly confirmed.
Formula
The Bollinger Bands are calculated using the following formula:
Middle Band
20-Period Simple Moving Average (SMA)
Upper Band
SMA + (2 × Standard Deviation)
Lower Band
SMA − (2 × Standard Deviation)
The squeeze condition occurs when the distance between the upper and lower bands becomes extremely small due to reduced market volatility.
Conclusion
The Bollinger Bands Squeeze indicator for MetaTrader 5 is an effective volatility analysis tool that helps traders detect consolidation phases before strong price movements occur. By identifying these low-volatility periods, traders can prepare for potential breakouts and take advantage of emerging trends.
When used alongside other technical indicators and price action analysis, the squeeze becomes a powerful method for spotting high-probability trading opportunities across multiple financial markets.
DOWNLOAD NOW Reach Us on WhatsApp
 Fly Over to Telegram
 Drop Us an Email
FAQ's
Q & A
Related products
-
 Free
FreeMT5 Zigzag Indicator
$0.00 Select options -
 Premium
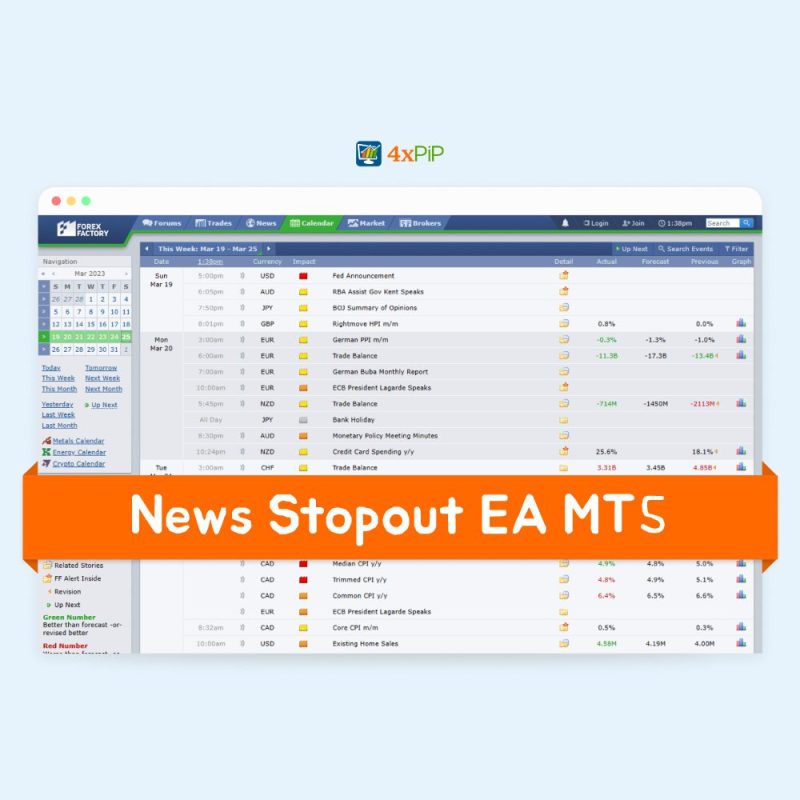
Forex News (EA) Expert Advisor for MT5 | Economic Calendar
Original price was: $199.00.$99.00Current price is: $99.00. Select options -
 Free
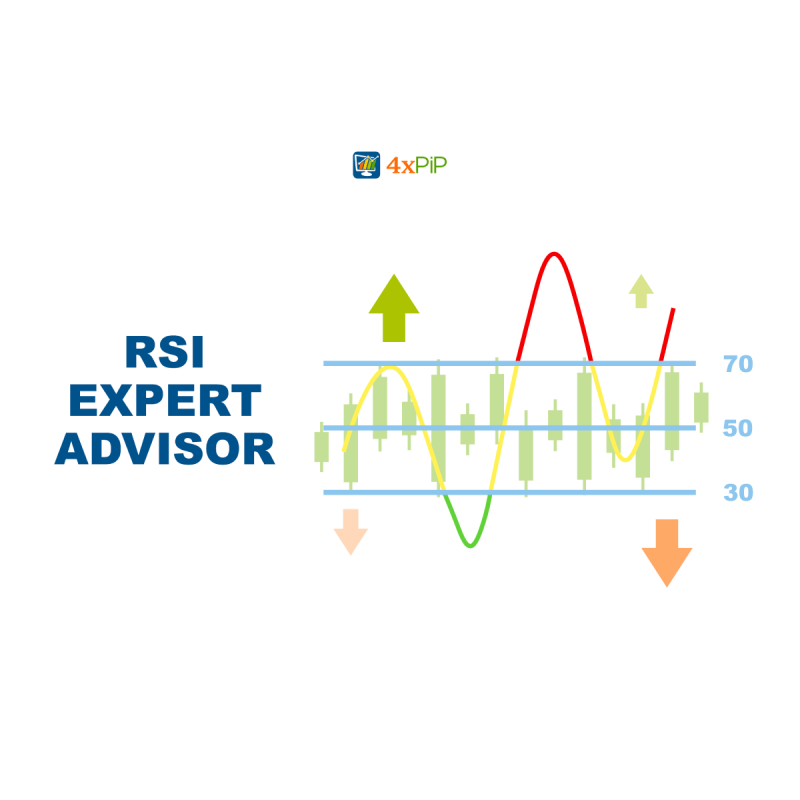
FreeMT5 EA Rsi
Original price was: $100.00.$20.00Current price is: $20.00. Select options -
 Premium
FOREX TRADE MANAGER MT5 EA
Original price was: $249.00.$49.00Current price is: $49.00. Select options
Reviews
There are no reviews yet