Bollinger Bands Squeez BB Squeez with MACD Analysis for MetaTrader 4 FREE Download
$0.00
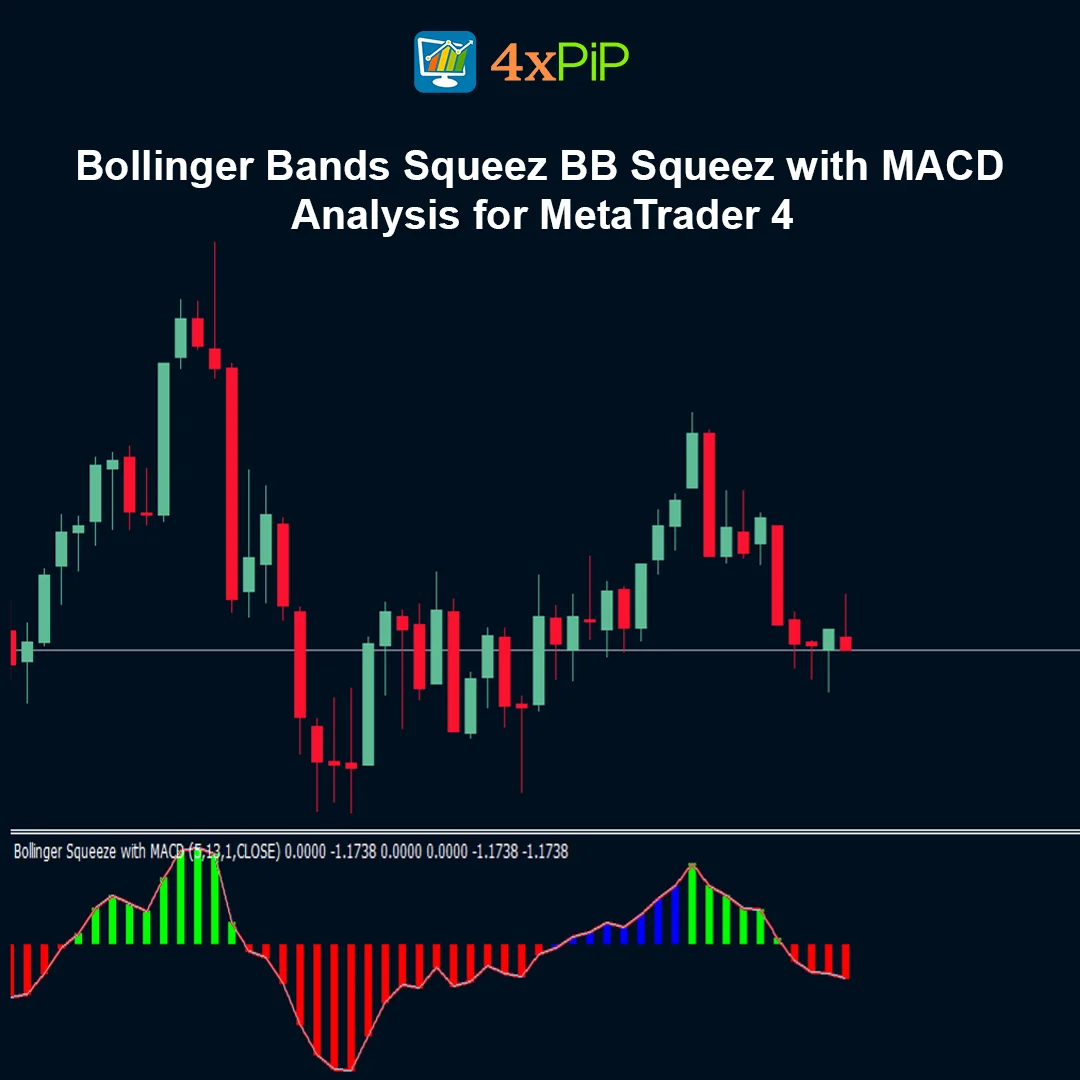
The Bollinger Squeeze Advanced indicator for MetaTrader 4 is a powerful volatility and momentum analysis tool that combines Bollinger Bands, Keltner Channels, and Moving Average Convergence Divergence to detect low-volatility squeeze conditions and potential breakout opportunities.
It highlights periods when the market is compressed and momentum is building, often signaling a powerful price movement once the squeeze releases.
Description
What is the Bollinger Squeeze Advanced indicator?
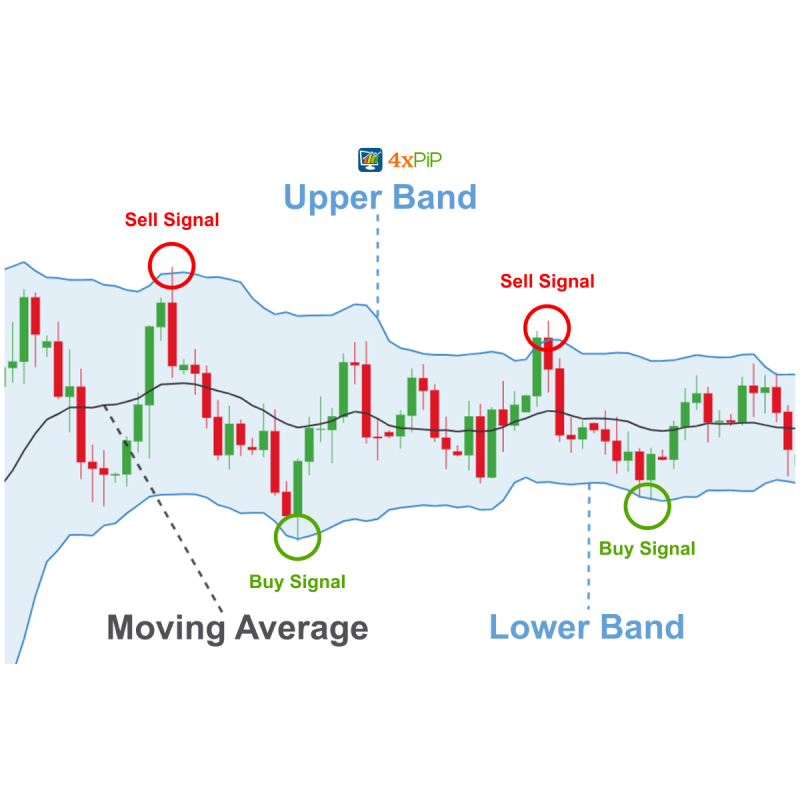
The Bollinger Squeeze Advanced indicator is a technical analysis tool designed to identify periods when the market experiences extremely low volatility. It does this by combining Bollinger Bands with Keltner Channels to detect when price movement becomes compressed. When the Bollinger Bands move inside the Keltner Channels, the market is considered to be in a squeeze condition. This phase often occurs before a strong price movement as volatility begins to increase again.
How does the indicator detect squeeze conditions?
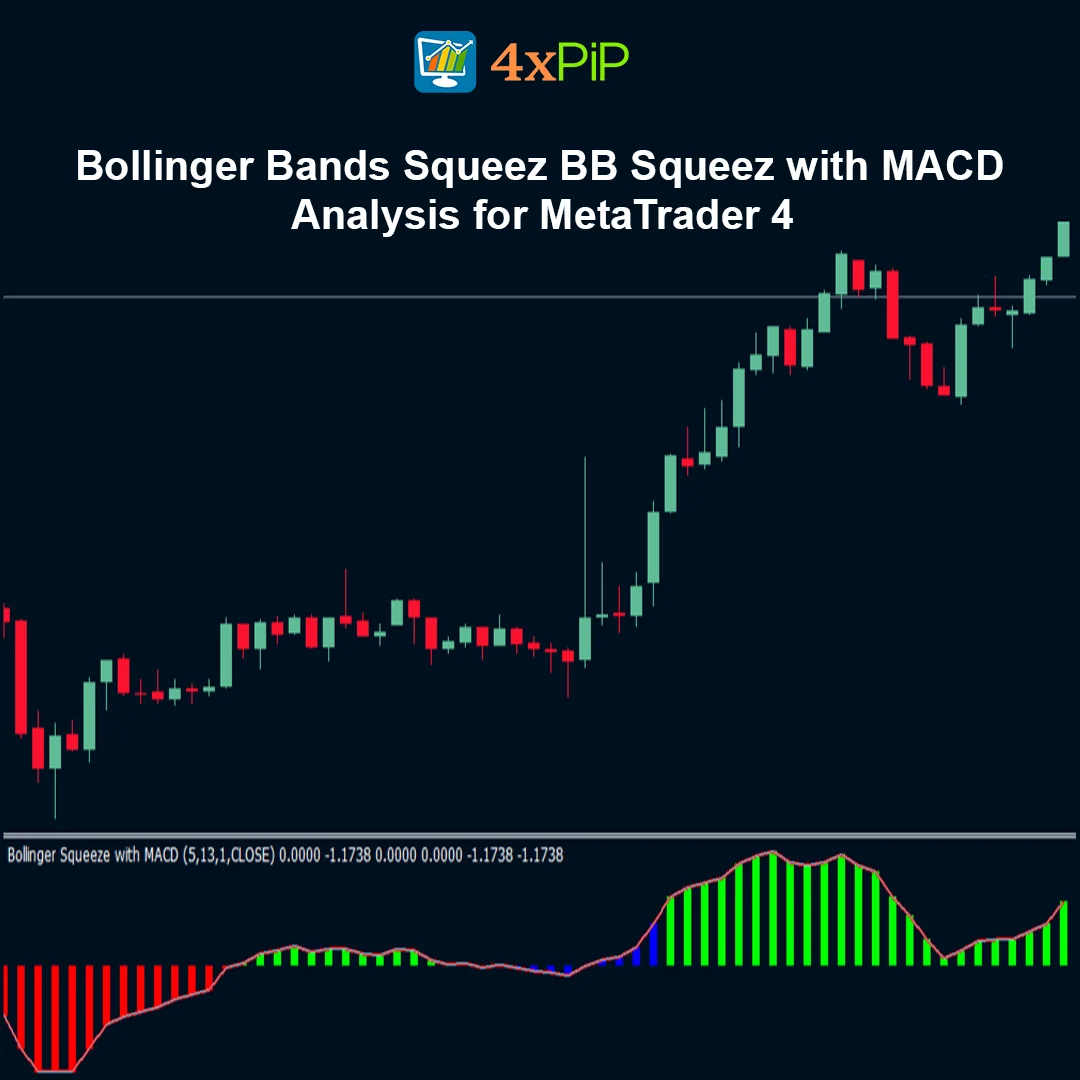
The indicator measures the relationship between Bollinger Bands and Keltner Channels. When the Bollinger Bands contract and move inside the Keltner Channels, it indicates that market volatility has decreased significantly. This compression suggests that the market is consolidating and storing energy for a potential breakout. Once the bands expand beyond the channels again, the squeeze is considered released, and the market may begin trending strongly.
Why is MACD used in this indicator?
The indicator uses the MACD histogram as a momentum filter to confirm the strength and direction of the breakout. While the squeeze identifies when volatility is building, MACD helps determine whether bullish or bearish momentum is developing. When the squeeze releases and MACD momentum increases, traders gain stronger confirmation that a trend movement is starting.
How do traders use the Bollinger Squeeze Advanced indicator?
Traders monitor the indicator for squeeze conditions during quiet market periods. When the squeeze releases and the momentum indicator confirms the trend direction, traders look for entry opportunities. This strategy helps traders catch powerful breakout moves that occur after consolidation phases. Many traders also combine this indicator with support and resistance levels or candlestick patterns to improve trading accuracy.
Advantages
- Detects low-volatility squeeze conditions before major price movements.
- Combines volatility and momentum analysis in a single indicator.
- Uses MACD confirmation to filter weak signals.
- Helps traders prepare for high-volatility breakouts.
- Suitable for Forex, stocks, crypto, and indices markets.
- Works on multiple timeframes.
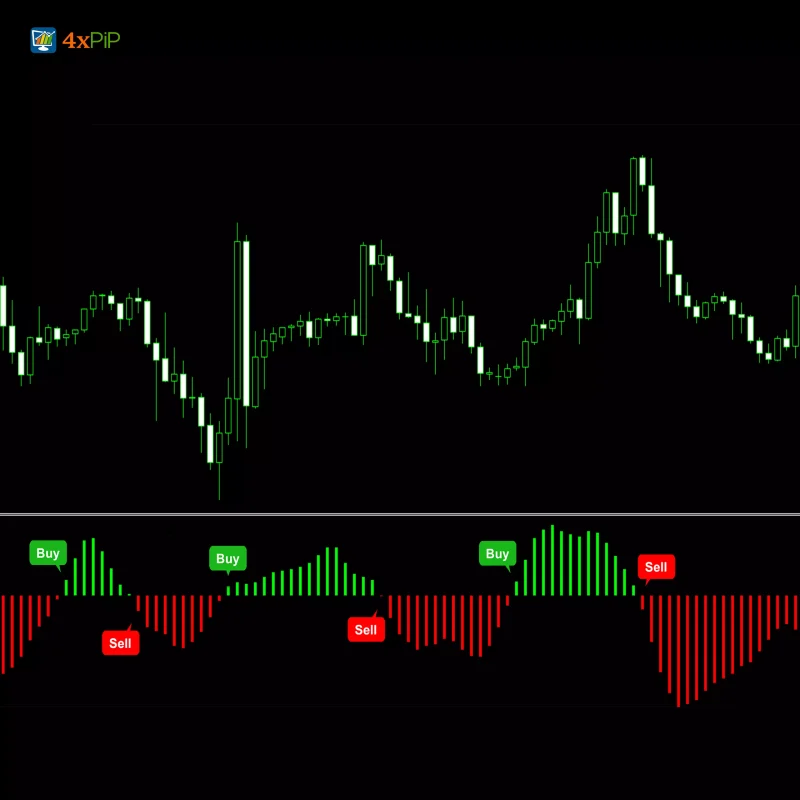
- Provides clear visual signals in a separate indicator window.
- Helps traders avoid trading during low-momentum conditions.
- Improves breakout trading strategies.
- Free and easy to install on MetaTrader 4.
Features
- Combines Bollinger Bands and Keltner Channels.
- Detects market squeeze conditions automatically.
- Integrates MACD histogram momentum filter.
- Displays signals in a separate indicator window.
- Uses color changes or dots to indicate squeeze status.
- Highlights volatility expansion phases.
- Supports multi-timeframe trading analysis.
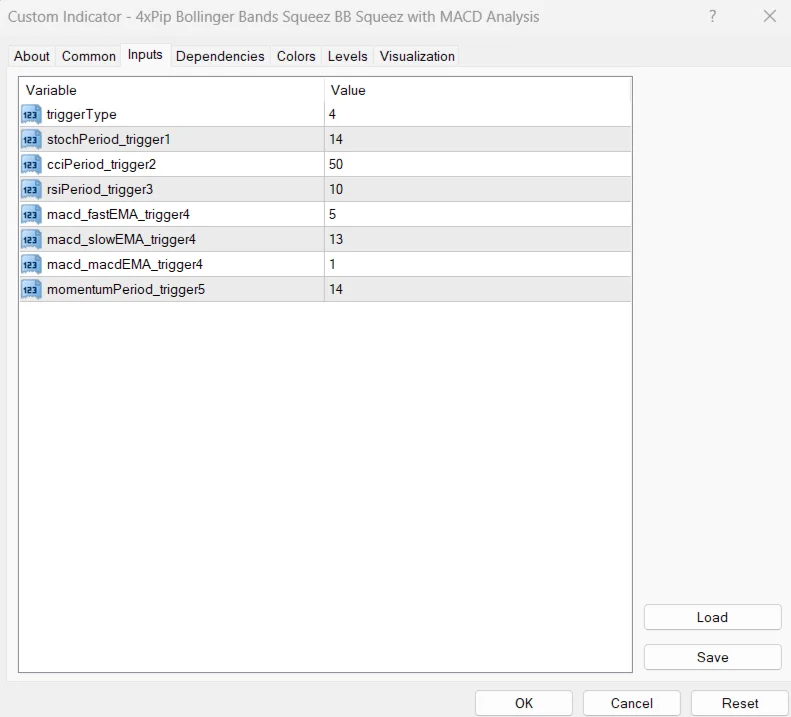
- Customizable settings for bands and momentum parameters.
- Lightweight indicator with fast calculation.
- Compatible with all MT4-supported markets.
How to Trade
Apply the indicator to your chart in MetaTrader 4.Watch for periods when the Bollinger Bands move inside the Keltner Channels(squeeze condition).Wait for the squeeze to release as volatility increases.Confirm the breakout direction using the MACD histogram momentum.Enter a buy trade when bullish momentum appears after the squeeze.Enter a sell trade when bearish momentum strengthens after the squeeze.
Formula
The indicator combines three core calculations:
Bollinger Bands
Middle Band = 20-period Simple Moving Average
Upper Band = SMA + (2 × Standard Deviation)
Lower Band = SMA − (2 × Standard Deviation)
Keltner Channels
Middle Line = Exponential Moving Average (EMA)
Upper Channel = EMA + Average True Range (ATR)
Lower Channel = EMA − Average True Range (ATR)
MACD Momentum Filter
MACD Line = Fast EMA − Slow EMA
Signal Line = EMA of MACD Line
Histogram = MACD Line − Signal Line
A squeeze occurs when Bollinger Bands move inside the Keltner Channels, indicating extremely low volatility.
Conclusion
The Bollinger Squeeze Advanced indicator for MetaTrader 4 is an effective tool for traders who want to detect consolidation phases and prepare for powerful breakout movements. By combining the volatility analysis of Bollinger Bands and Keltner Channels with the momentum confirmation of MACD, the indicator provides a comprehensive view of market conditions.
This combination makes it especially useful for traders looking to capture trend reversals, breakout trades, and high-momentum price movements during quiet market periods.
DOWNLOAD NOW Reach Us on WhatsApp
 Fly Over to Telegram
 Drop Us an Email
FAQ's
Q & A
Related products
-
 Free
FreeMT4 Fisher Indicator
$0.00 Select options -
 Free
FreeMT4 EA Bollinger Band
Original price was: $100.00.$20.00Current price is: $20.00. Select options -
 Free
FreeMT4 EA Drawdown Limiter
Original price was: $100.00.$10.00Current price is: $10.00. Select options -
 Premium
Forex News (EA) Expert Advisor for MT4 | Economic Calendar
Original price was: $199.00.$99.00Current price is: $99.00. Select options
Reviews
There are no reviews yet