Bollinger Bands Crossover Signals – BB Buy BB Sell – indicator for MetaTrader 5 – FREE Download
$0.00
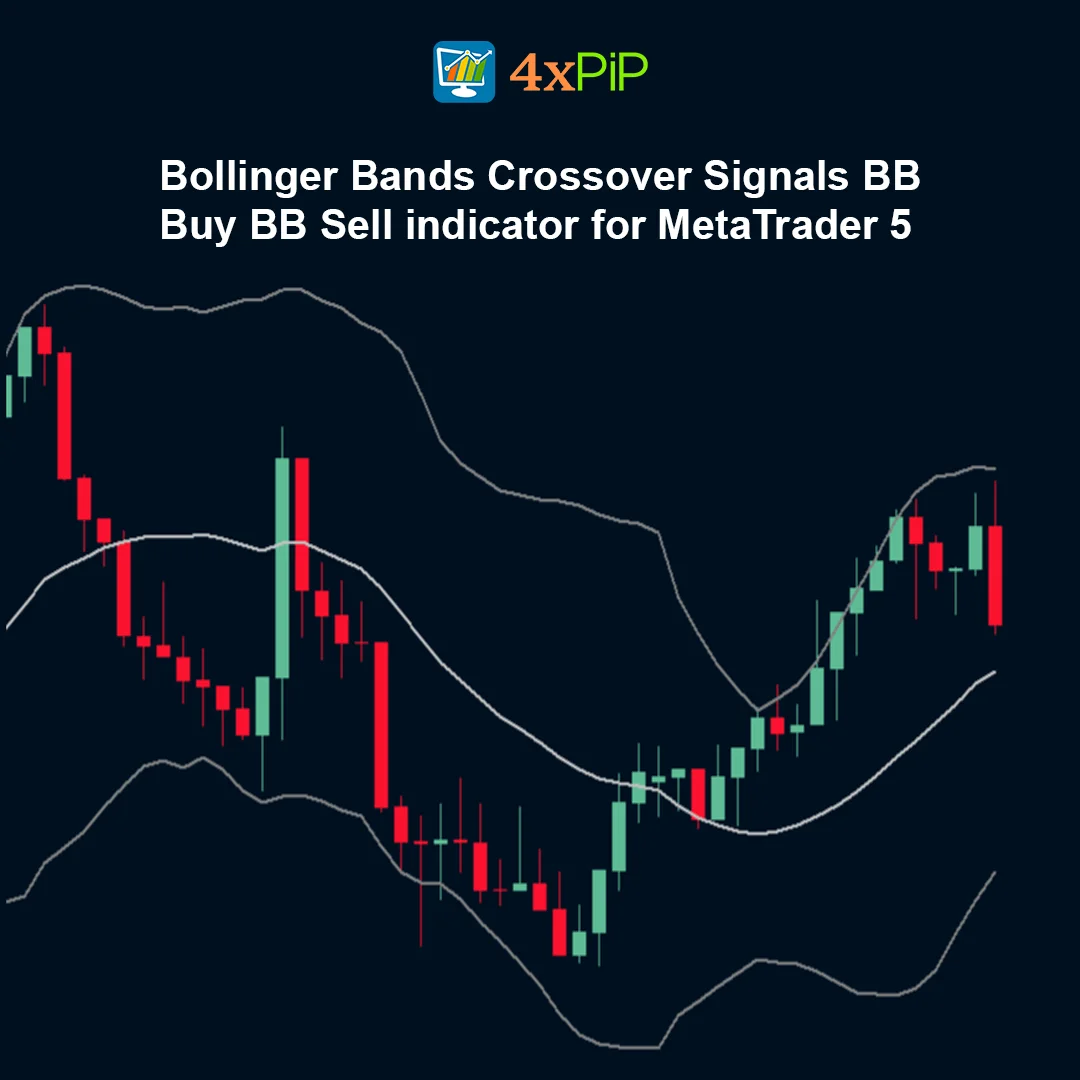
The Bollinger Bands Crossover Signals indicator for MetaTrader 5 is a powerful trading tool that combines Bollinger Bands with automatic Buy and Sell arrow signals. It detects when the price crosses above the lower band or below the upper band and plots clear arrows on the chart. This helps traders quickly identify potential market reversals, volatility extremes, and entry opportunities without manually analyzing price movements.
Description
What is the Bollinger Bands Crossover Signals indicator?
The Bollinger Bands Crossover Signals indicator is designed to simplify trading decisions by automatically detecting when price interacts with Bollinger Bands. Instead of manually watching for crossovers, the indicator plots visual arrows on the chart whenever a confirmed signal appears. These arrows indicate potential buy or sell opportunities when the price moves beyond the volatility boundaries defined by Bollinger Bands and then returns back inside.
How does the indicator generate trading signals?
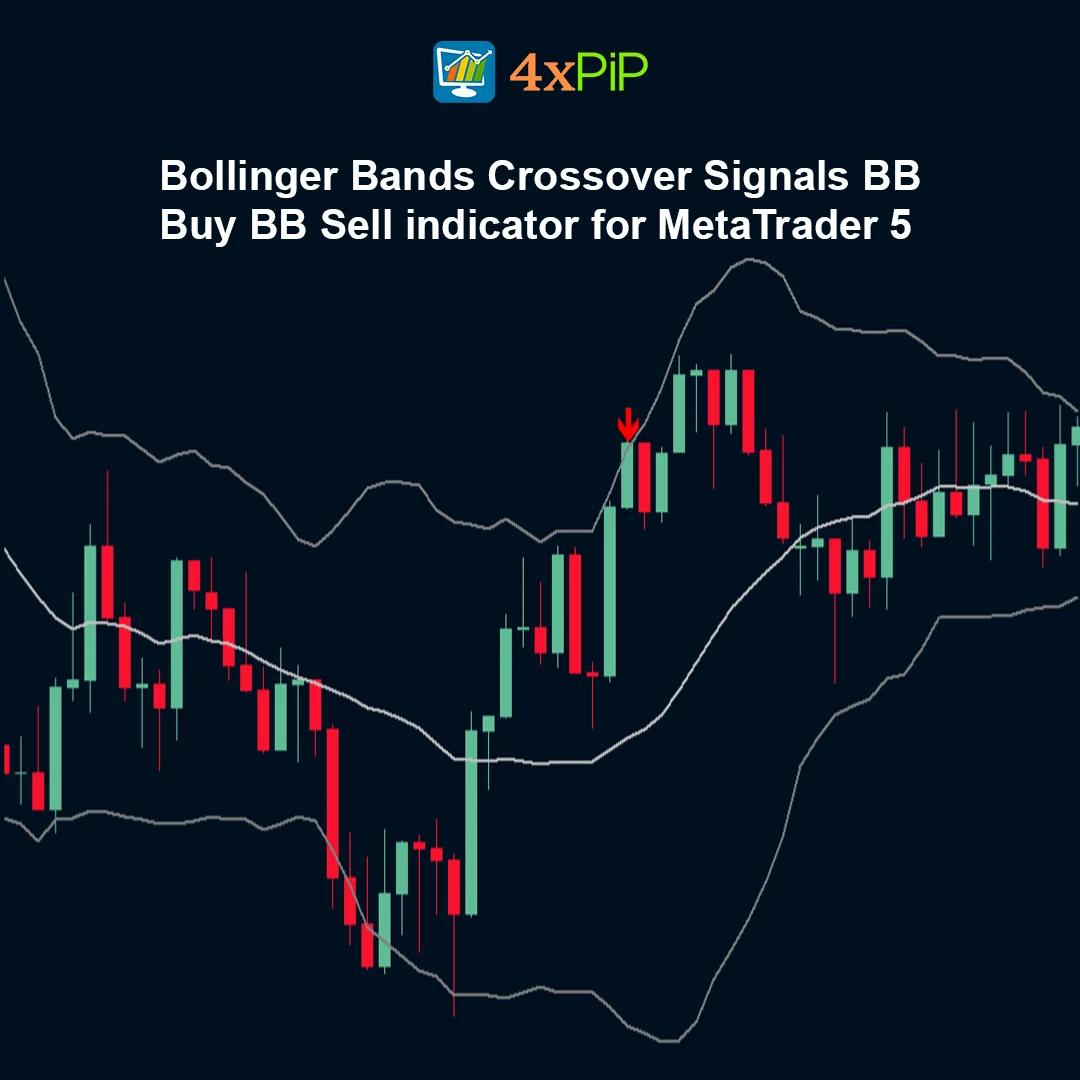
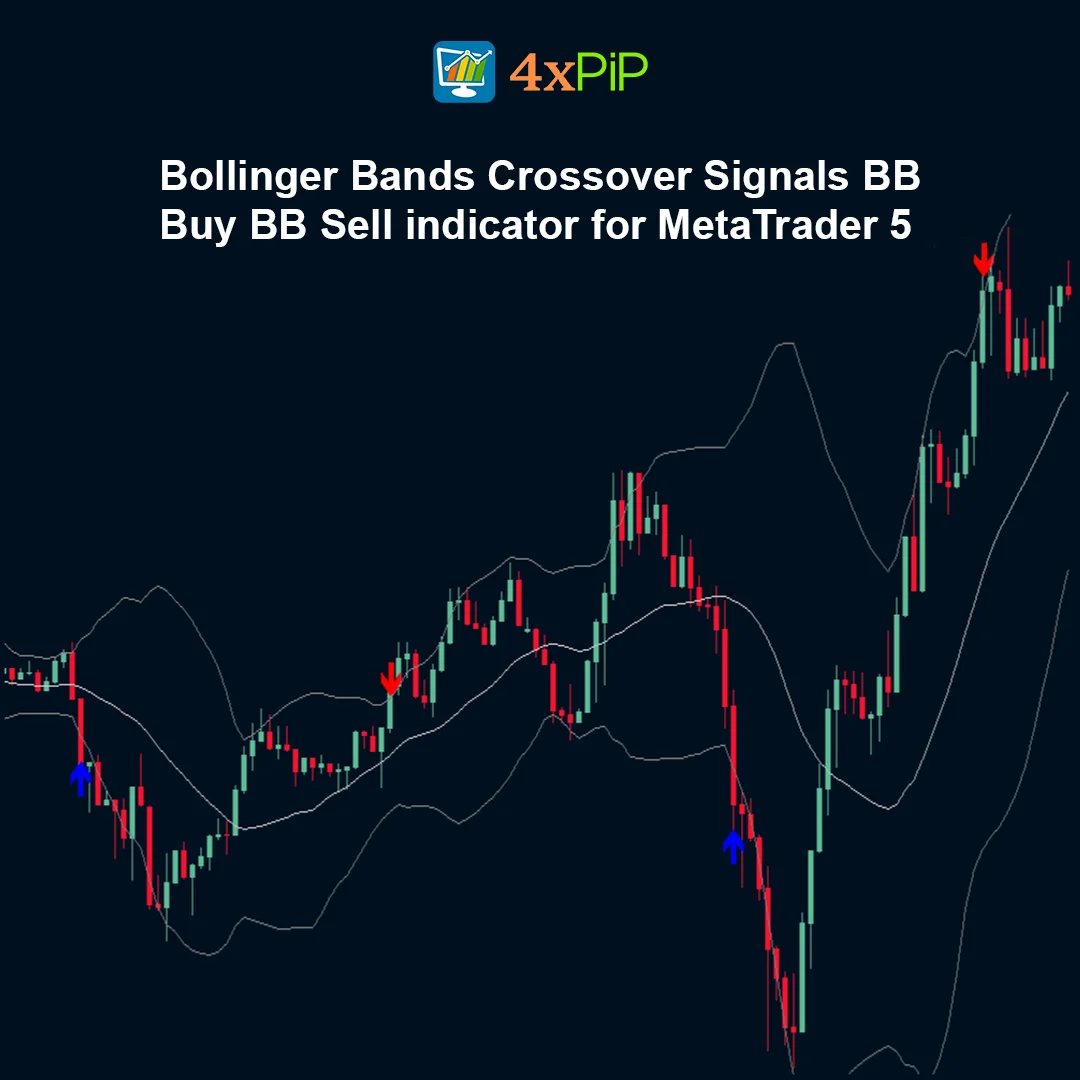
The indicator calculates Bollinger Bands using the built-in function of the MetaTrader 5 platform. When the price moves outside the bands and then closes back inside, it suggests that the market may be reversing from an extreme level. A Buy signal appears when the previous candle closes below the lower band and the next candle closes back above it. A Sell signal appears when the previous candle closes above the upper band and the next candle closes back below it.
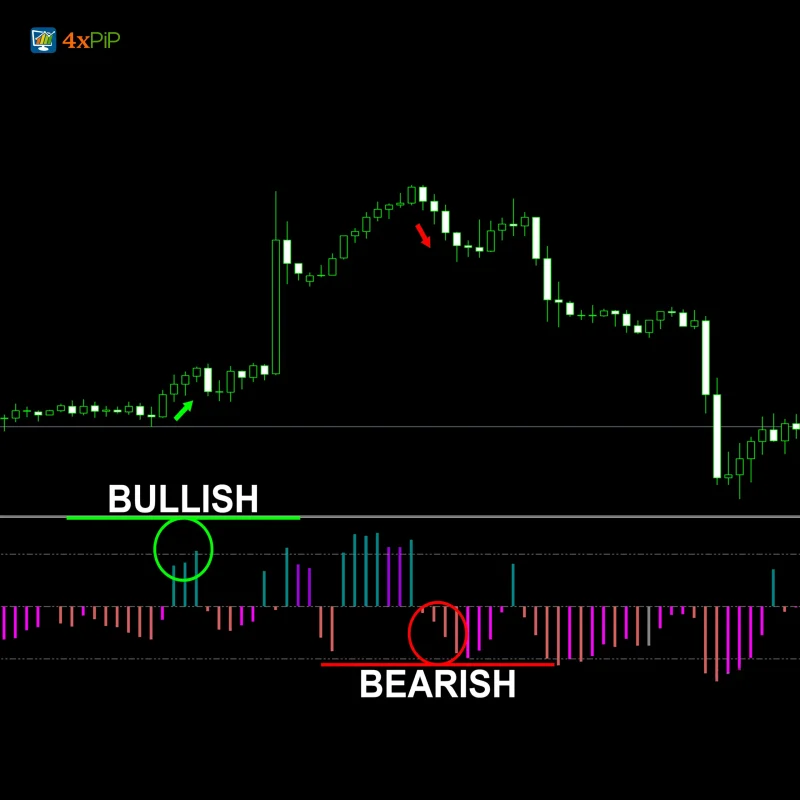
Why are Bollinger Bands useful for detecting reversals?
Bollinger Bands measure market volatility and define dynamic support and resistance zones. When the price reaches the outer bands, the market is considered overextended. If the price then moves back inside the bands, it often indicates a potential reversal or correction. This indicator highlights those situations visually so traders can react quickly without analyzing the bands manually.
How can traders use this indicator effectively?
Traders typically use this indicator in combination with other technical tools such as trend filters, moving averages, or candlestick patterns. While Bollinger Band crossovers can signal potential reversals, confirming the signal with other indicators improves accuracy. The tool works particularly well in ranging markets where price frequently touches the upper and lower volatility boundaries.
Advantages
- Provides clear buy and sell arrows on the chart.
- Automatically detects Bollinger Band crossovers.
- Uses non-repainting logic for reliable signals.
- Works on all timeframes and trading instruments.
- Helps identify potential reversal points quickly.
- Allows optional display of Bollinger Bands.
- Reduces manual chart analysis.
- Suitable for both beginner and experienced traders.
- Supports multiple markets including Forex and crypto.
- Easy to configure and customize.
Features
- Combines Bollinger Bands with arrow trading signals.
- Automatic detection of price crossovers above or below bands.
- Blue arrows for buy signals and red arrows for sell signals.
- Optional display of upper, middle, and lower bands.
- Signals confirmed after candle close to avoid repainting.
- Works with any trading symbol or timeframe.
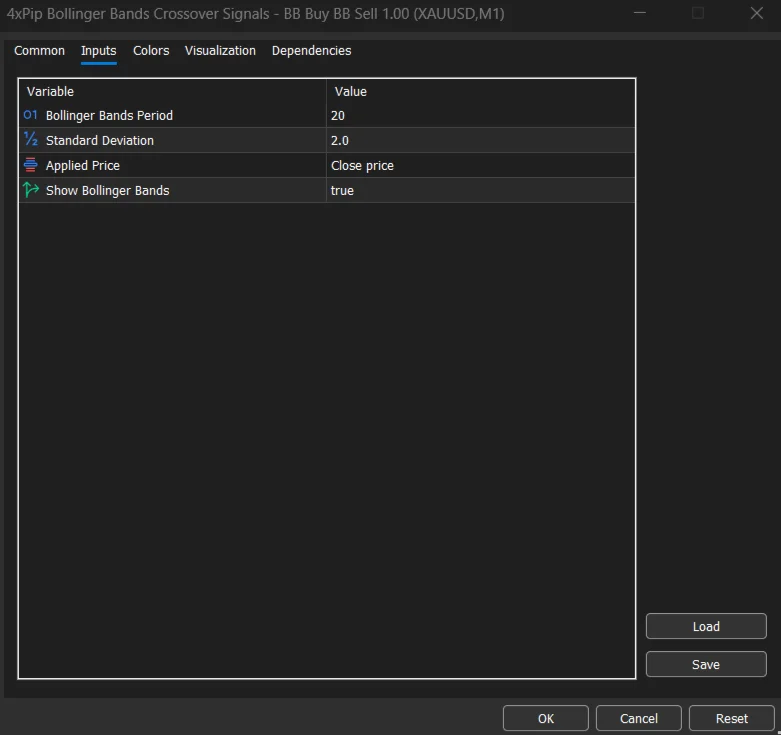
- Customizable Bollinger Band period and deviation.
- Flexible price calculation settings (Close, Open, High, Low).
- Prevents repeated arrows in the same direction.
- Simple interface and lightweight performance.
How to Trade
Add the indicator to your chart in MetaTrader 5.Adjust BB Period and Deviation based on your trading strategy.Watch for blue arrows near the lower band as potential buy signals.Look for red arrows near the upper band as potential sell signals.Confirm signals with trend indicators or candlestick patterns.Use proper risk management before entering a trade.
Formula
The indicator is based on the Bollinger Bands formula:
Middle Band = Simple Moving Average (SMA)
Upper Band =SMA + (Standard Deviation × Deviation)
Lower Band =SMA − (Standard Deviation × Deviation)
Signal Logic:
Buy Signal =
Previous Close < Lower Band AND Current Close > Lower Band
Sell Signal =
Previous Close > Upper Band AND Current Close < Upper Band
Conclusion
The Bollinger Bands Crossover Signals indicator for MetaTrader 5 is a practical trading tool that transforms Bollinger Band analysis into simple visual signals. By automatically identifying crossovers and plotting arrows, it helps traders detect potential reversal points faster and with less manual effort.
Whether used alone or combined with other indicators, this tool can improve trading accuracy by highlighting volatility extremes and potential market turning points.
DOWNLOAD NOW Reach Us on WhatsApp
 Fly Over to Telegram
 Drop Us an Email

Reviews
There are no reviews yet