Best MACD colored histogram indicator for MetaTrader 5 – FREE Download
$0.00
The MACD Colored Histogram Indicators for MetaTrader 5 (MT5) are powerful free tools designed to improve momentum analysis and trend visualization. By displaying MACD histogram bars in different colors, these indicators help traders quickly identify bullish and bearish momentum, MACD crossovers, and potential trend reversals.
Popular versions include MACD 4 Color Histogram, MACD Coloured Histogram, and MACD Histogram Multi-Color [v04], all of which provide enhanced chart clarity, customizable settings, and alert notifications for better trading decisions.
Description
What is a MACD Colored Histogram Indicator?
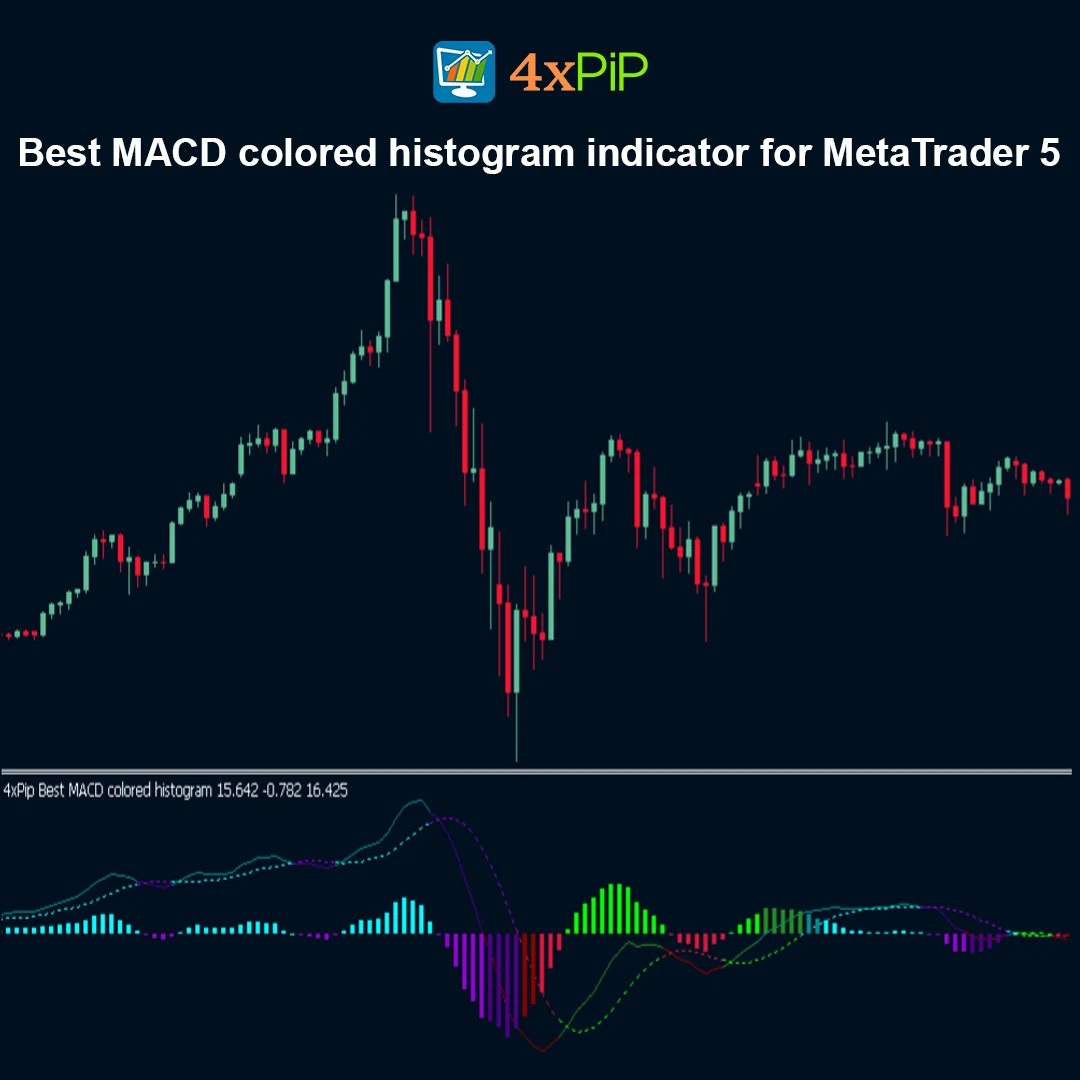
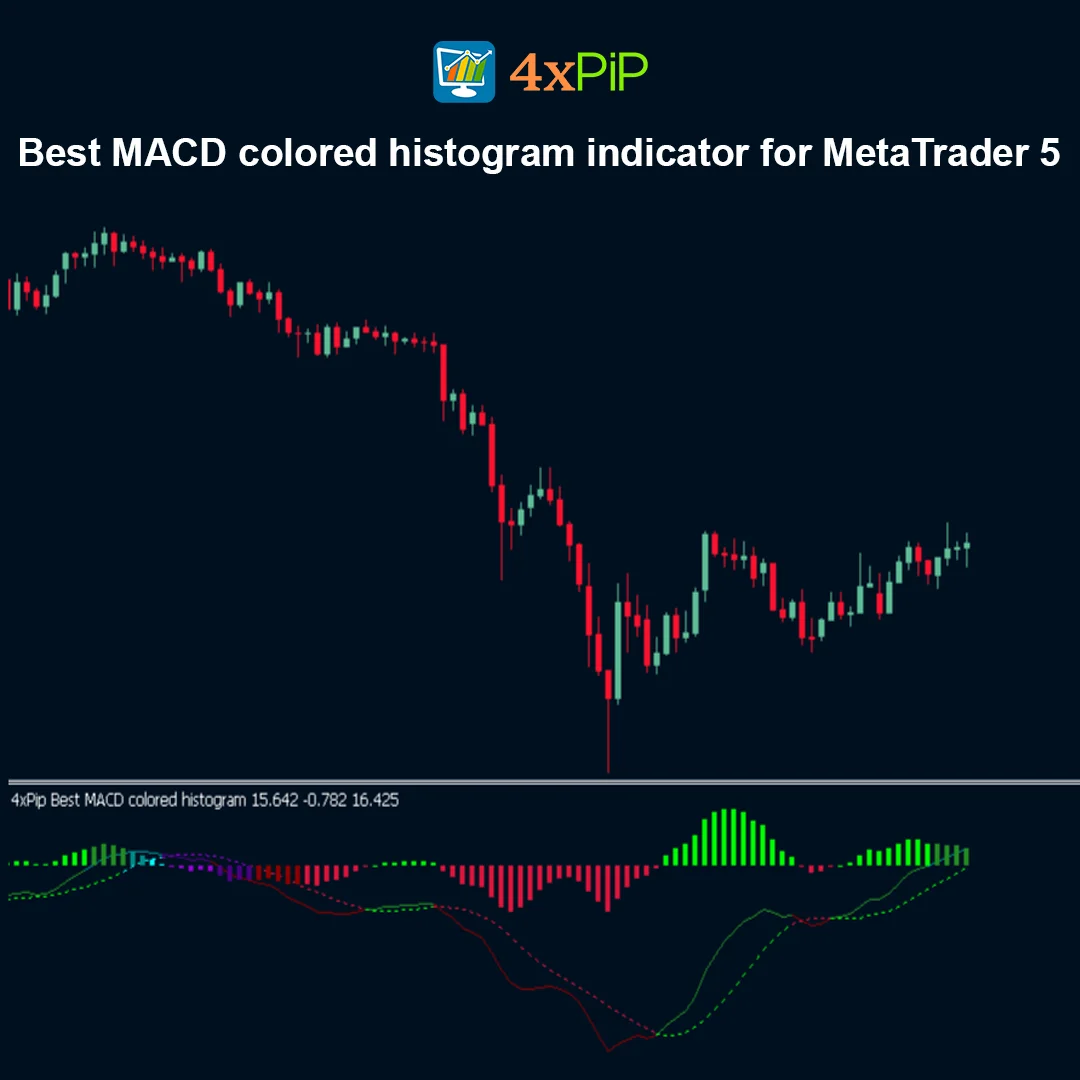
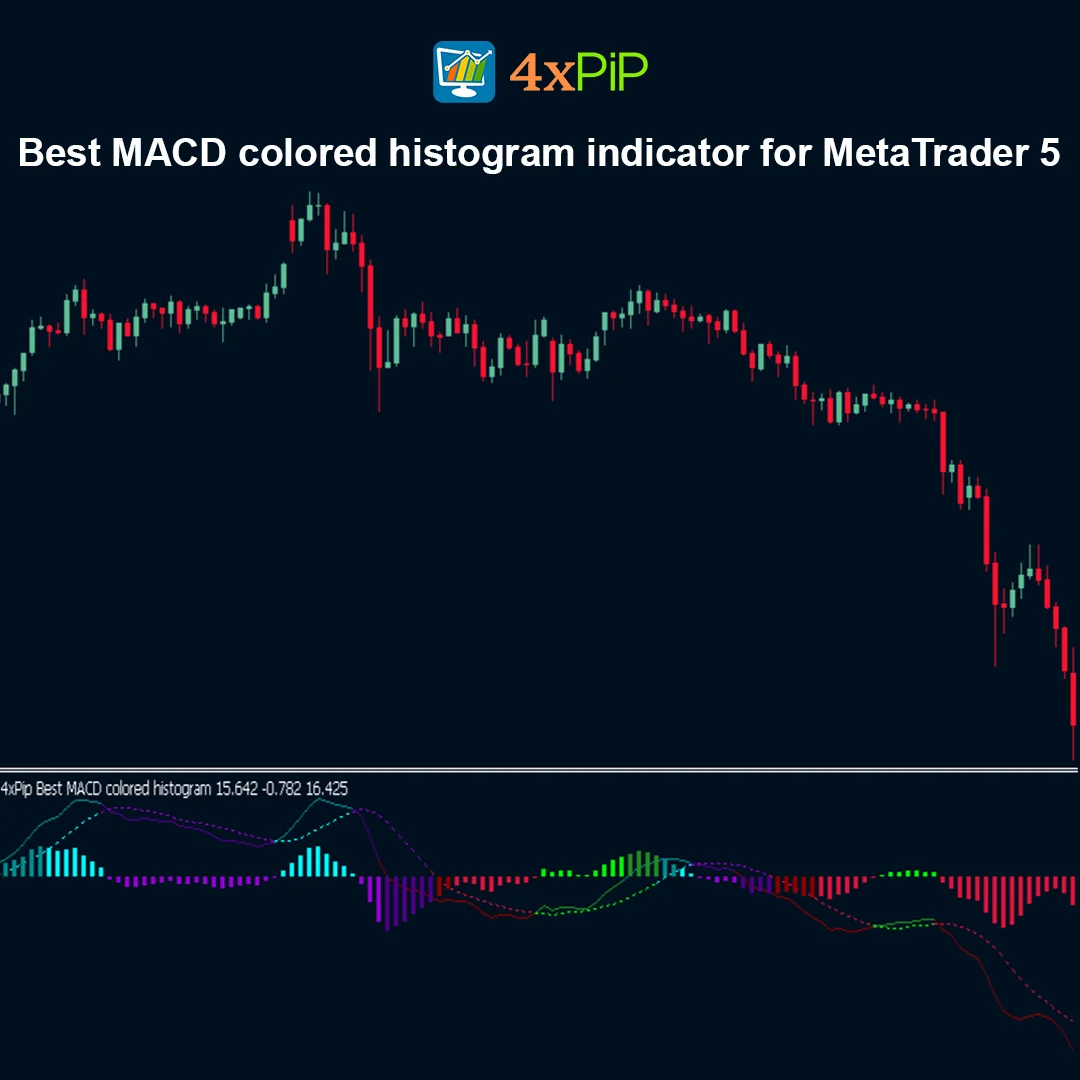
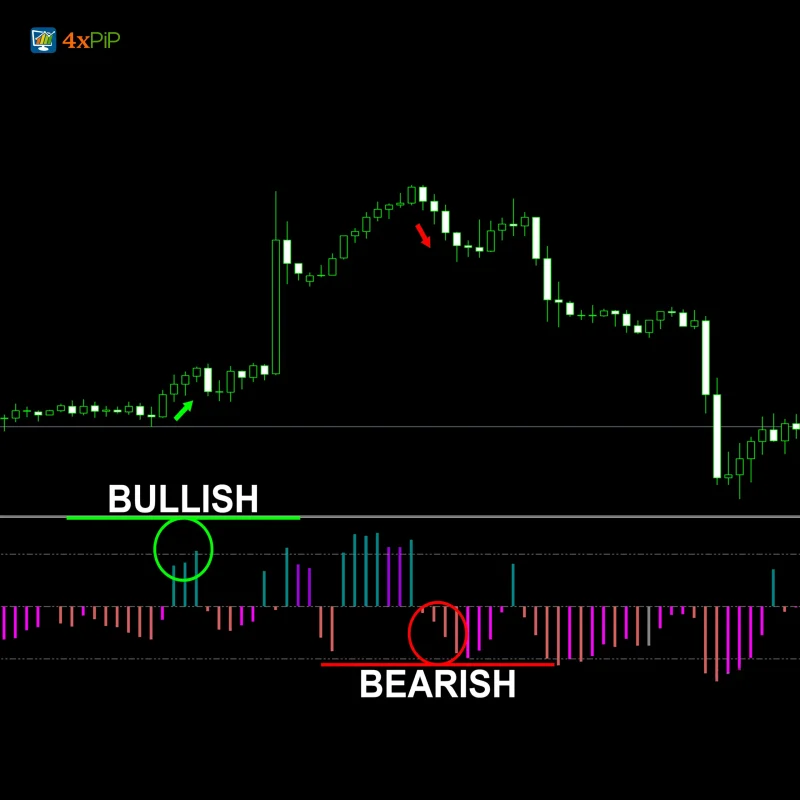
A MACD (Moving Average Convergence Divergence) colored histogram indicator is an enhanced version of the standard MACD tool used in technical analysis. Instead of displaying histogram bars in a single color, this indicator uses multiple colors to highlight changes in momentum and trend strength.
By visually distinguishing between bullish and bearish momentum, traders can quickly identify:
- Trend direction
- Momentum strength
- MACD signal line crossovers
- Zero-line interactions
This visual clarity helps traders react faster to market changes and improves overall trading analysis.
Best Free MACD Colored Histogram Indicators for MT5
Several free MACD histogram indicators are available for MetaTrader 5. Some of the most popular versions include:
MACD 4 Color Histogram
This indicator displays histogram bars using four distinct colors, making it easier to recognize increasing or decreasing momentum. The additional color variations help traders identify trend acceleration and weakening momentum more clearly than the default MACD.
MACD Coloured Histogram
The MACD Coloured Histogram automatically changes colors based on market conditions. It can also provide alerts for signal line crossovers and zero-line crossings, allowing traders to react quickly to potential trading opportunities.
MACD Histogram Multi-Color [v04]
This version provides a classic multi-color histogram where the bars change color when the MACD line crosses the signal line. It is widely used because of its simplicity and clear visual signals.
MACD with Histogram Color Change
This variation focuses on clear bullish and bearish momentum visualization by assigning different colors to positive and negative histogram values.
Why Use MACD Colored Histogram Indicators?
MACD colored histogram indicators offer several advantages compared to the standard MACD indicator.
They allow traders to:
- Identify trend direction quickly
- Detect momentum strength and weakening trends
- Spot MACD crossovers visually
- Recognize zero-line breakouts
- Improve entry and exit timing
Because the histogram colors change with market momentum, traders can interpret signals more quickly and confidently.
Advantages
- Completely free MACD indicators for MT5.
- Improved visual momentum tracking.
- Clear distinction between bullish and bearish momentum.
- Supports real-time alerts and notifications.
- Customizable EMA/SMA periods and colors.
- Works on multiple timeframes.
- Compatible with all major trading instruments.
- Helps detect trend reversals earlier.
- Improves trade timing and analysis.
- Suitable for both beginners and professional traders.
Features
- Color-Coded Histogram Bars – Displays different colors for bullish and bearish momentum.
- Signal Line Crossover Detection – Highlights momentum shifts clearly.
- Zero-Line Interaction Signals – Helps identify potential trend changes.
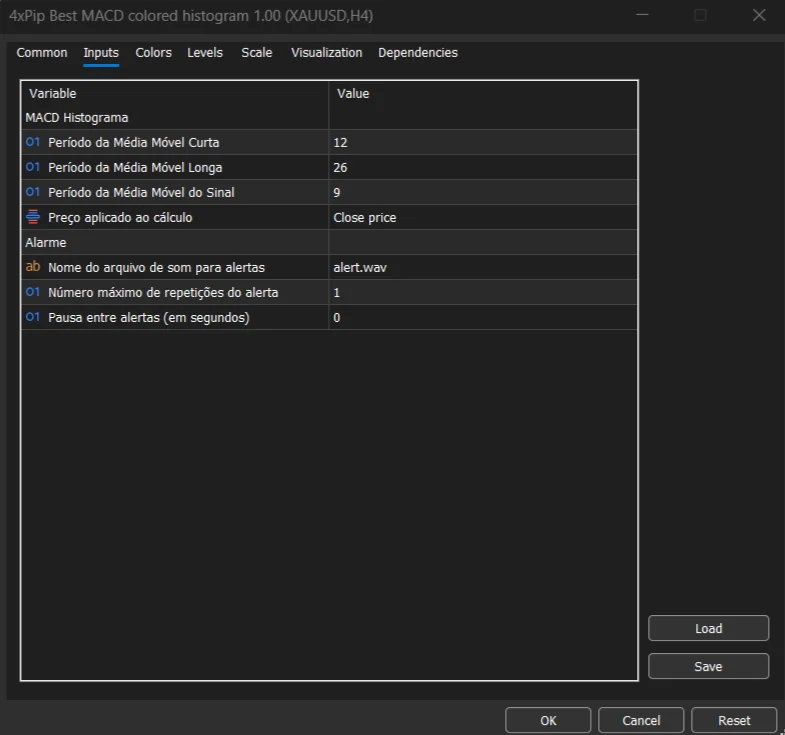
- Customizable Indicator Settings – Modify EMA periods, input prices, and colors.
- Real-Time Alerts – Receive notifications when trading signals occur.
- Multi-Timeframe Compatibility – Works on all MT5 chart intervals.
- Supports Multiple Markets – Forex, indices, commodities, and cryptocurrencies.
- Enhanced Visualization – Easier to interpret compared to standard MACD.
- Improves Momentum Analysis – Helps identify strong trends and weakening moves.
- Works with Other Technical Tools – Compatible with various trading strategies.
How to Trade Using MACD Colored Histogram
To use the MACD colored histogram indicator in MetaTrader 5, first download the indicator from the MQL5 Market or another trusted MT5 indicator source. After downloading, open MT5 and navigate to the Navigator panel. Locate the indicator under the Indicators section and drag it onto your chart.
Once the indicator is active, observe the histogram bars and their colors. When the histogram changes from bearish to bullish colors, it may signal increasing buying momentum. Conversely, when the histogram shifts to bearish colors, it may indicate growing selling pressure.
Traders often use MACD crossovers and zero-line movements as confirmation signals. For improved accuracy, the indicator can be combined with support and resistance levels, trend indicators, or price action strategies.
Formula
The MACD histogram is derived from the difference between the MACD line and the signal line.
MACD\ Histogram = MACD\ Line – Signal\ Line
Where:
- MACD Line = EMA(Fast Period) − EMA(Slow Period)
- Signal Line = EMA of the MACD Line
The histogram bars represent the distance between these two lines, and color changes highlight shifts in momentum.
Conclusion
The MACD Colored Histogram Indicators for MT5 provide traders with a clearer way to analyze momentum and trend changes. By using color-coded histogram bars, these indicators make it easier to identify trend strength, potential reversals, and trading opportunities.
With customizable parameters, real-time alerts, and compatibility with multiple markets, these free indicators are valuable tools for traders looking to enhance their technical analysis and trading performance.
DOWNLOAD NOW Reach Us on WhatsApp
 Fly Over to Telegram
 Drop Us an Email
FAQ's
Q & A
Related products
-
 Free
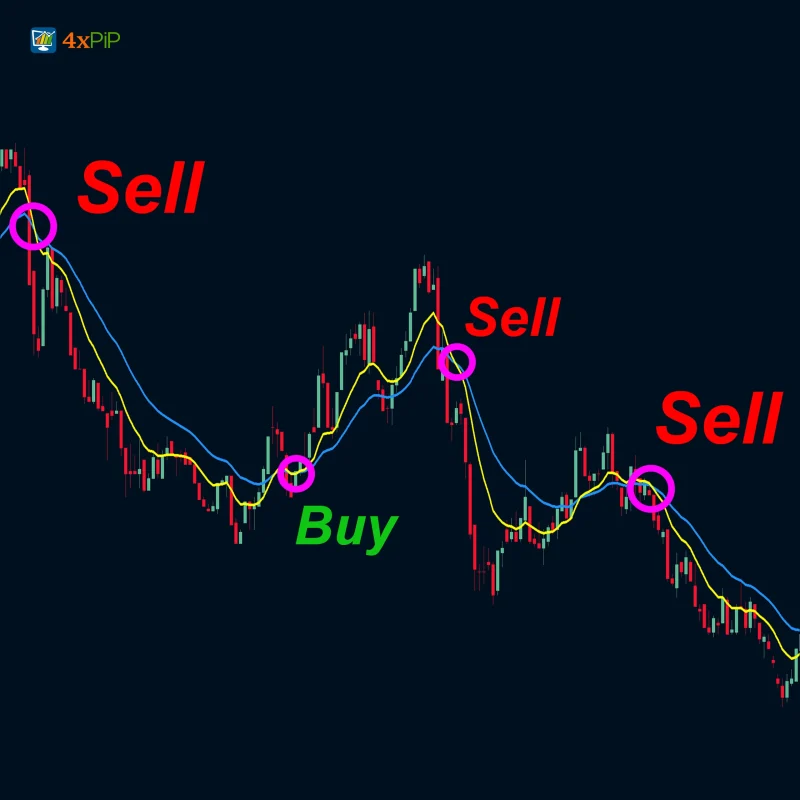
FreeMT5 EA Moving Average Crossover
Original price was: $100.00.$20.00Current price is: $20.00. Select options -
 Free
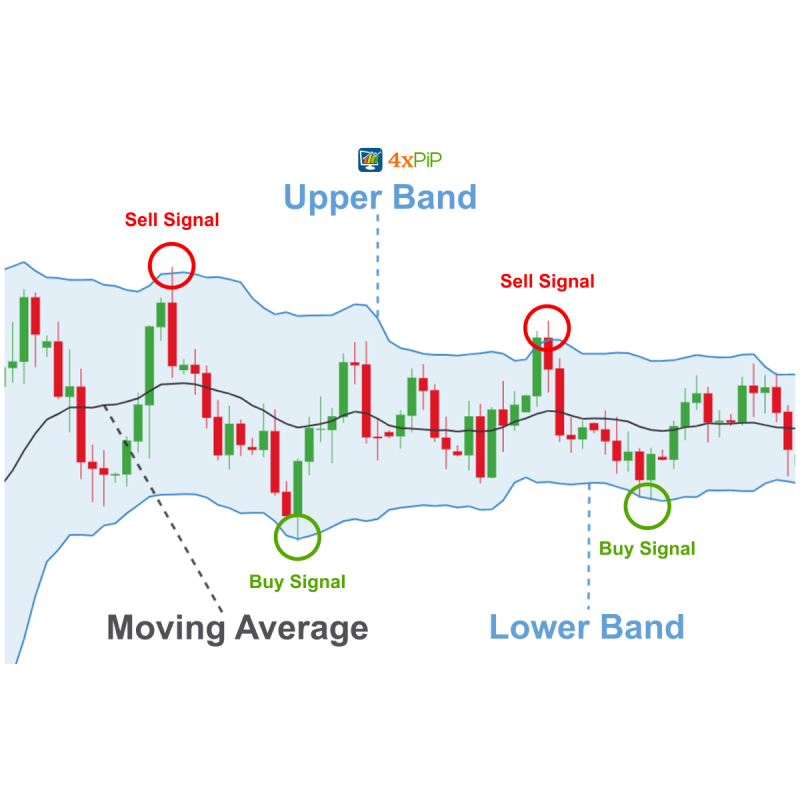
FreeMT5 EA Bollinger Band
Original price was: $100.00.$20.00Current price is: $20.00. Select options -
 Free
FreeMT5 EA Drawdown Limiter
Original price was: $100.00.$10.00Current price is: $10.00. Select options -
 Free
FreeMT5 MACD Explained Indicator
$0.00 Select options
Reviews
There are no reviews yet