
Double Exponential Moving Average (DEMA) Indicator for MetaTrader 4 – FREE Download
$0.00
The Double Exponential Moving Average (DEMA) is a powerful trend-following indicator designed to reduce lag and improve the responsiveness of traditional moving averages. Developed by Patrick Mulloy, this indicator enhances the standard Exponential Moving Average (EMA) by applying a double smoothing calculation to price data.
Unlike conventional moving averages that may respond slowly to price changes, the DEMA reacts more quickly to market movements while still maintaining a smooth representation of the trend. This allows traders to identify trend changes earlier and make faster trading decisions.
The indicator plots a single moving average line directly on the chart, helping traders easily identify trend direction, dynamic support and resistance levels, and potential entry or exit opportunities.
Description
What is the Double Exponential Moving Average (DEMA)?
The Double Exponential Moving Average (DEMA) is a technical indicator that improves traditional moving averages by reducing lag. It uses a double exponential smoothing method to produce a faster and more responsive trend line.
Who created the DEMA indicator?
The DEMA indicator was developed by technical analyst Patrick Mulloy. His goal was to enhance moving average calculations so that traders could react more quickly to price changes.
How does the DEMA indicator work?
The indicator calculates two exponential moving averages and combines them into a single formula. This method removes much of the lag associated with standard moving averages while still smoothing price data.
How is DEMA different from a regular EMA?
The Exponential Moving Average uses a single smoothing process, while the DEMA applies a double smoothing calculation. This makes DEMA more responsive to price movements and allows it to track trends more closely.
What does the DEMA line represent?
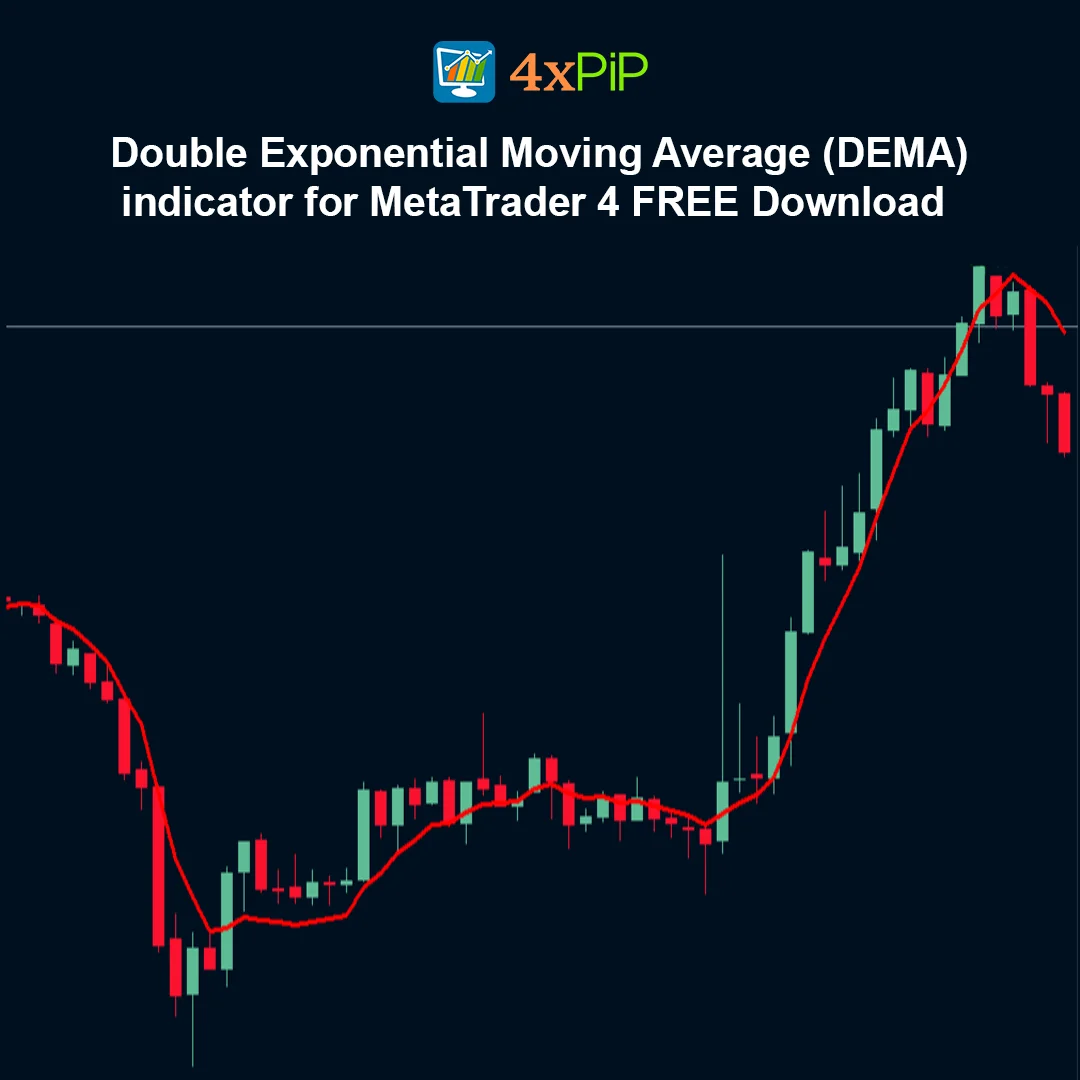
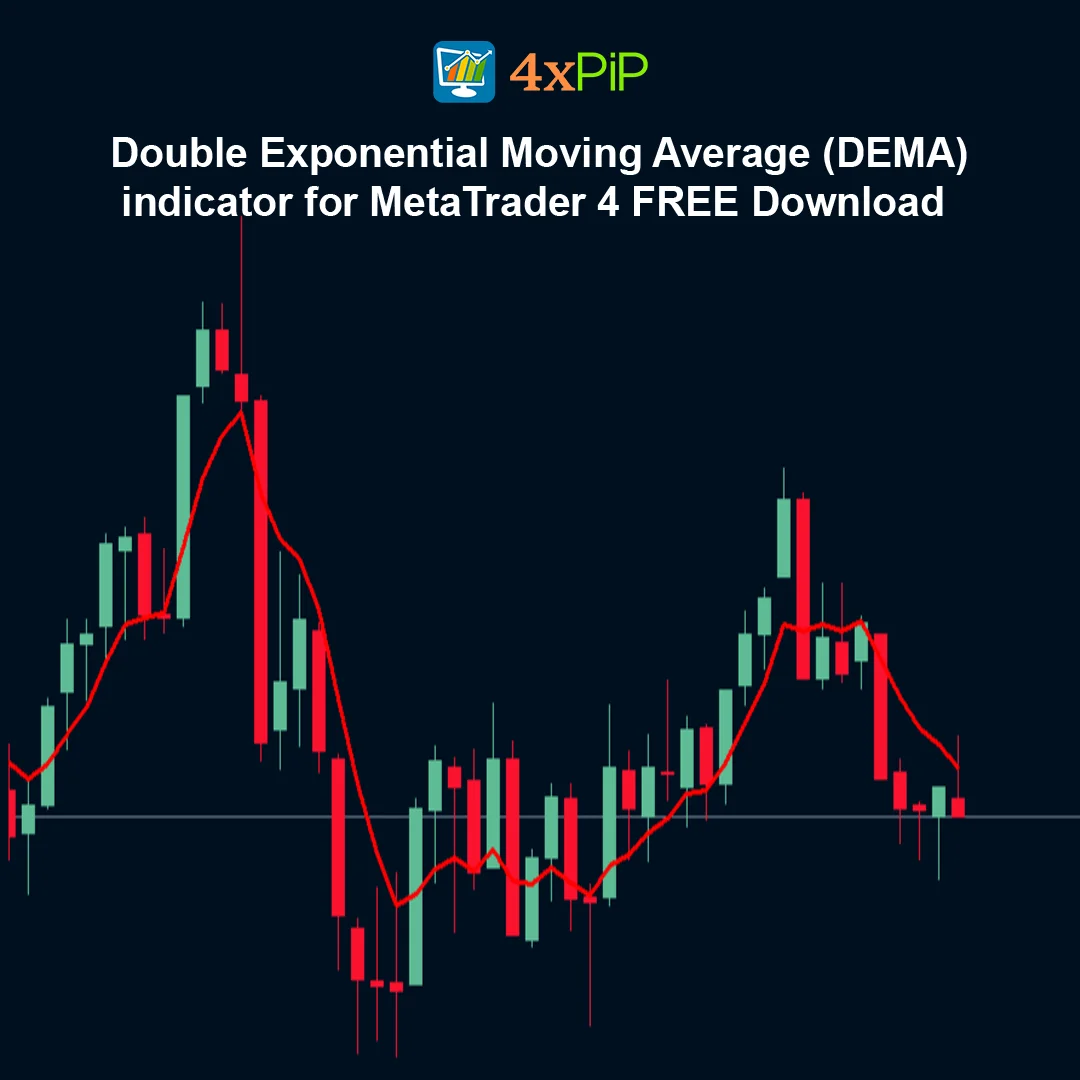
The DEMA line represents the overall direction of the market trend. When price stays above the DEMA line, it usually indicates bullish conditions. When price moves below the line, it often indicates bearish conditions.
Why is the DEMA indicator useful?
The DEMA indicator helps traders identify trends earlier by reducing the lag associated with traditional moving averages. It provides clearer signals and improves trend-following analysis.
Advantages
- Reduces lag compared to traditional moving averages.
- Provides faster signals than the standard EMA.
- Helps traders detect trend changes earlier.
- Smoothly follows price action while filtering market noise.
- Useful for trend-following strategies.
- Works across different financial markets.
- Suitable for multiple trading timeframes.
- Easy to combine with other technical indicators.
- Helps identify dynamic support and resistance levels.
- Completely free indicator for MetaTrader 4 users.
Features
- Advanced moving average designed to minimize lag.
- Developed by Patrick Mulloy for improved trend detection.
- Uses a double exponential smoothing calculation.
- Displays a smooth moving average line on the chart.
- Helps traders quickly determine market direction.
- Responds faster to price movements than traditional averages.
- Compatible with all instruments available in MetaTrader 4.
- Lightweight and optimized for efficient platform performance.
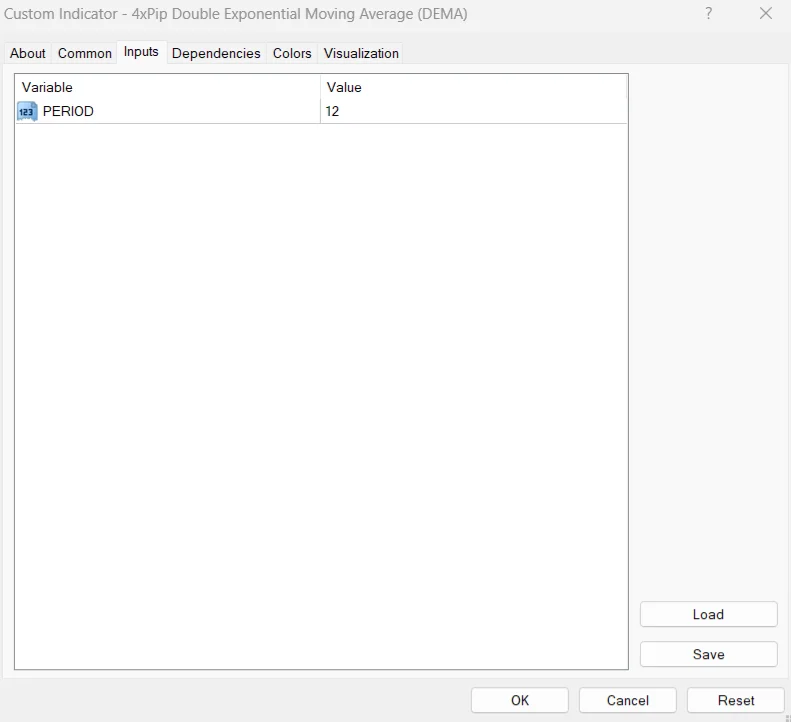
- Adjustable period settings for customized analysis.
- Suitable for both manual trading and automated strategies.
How to Trade
The Double Exponential Moving Average indicator is mainly used to identify trend direction and potential trading opportunities. When the price moves above the DEMA line, it indicates bullish market conditions and traders may consider buying opportunities. When the price moves below the DEMA line, it suggests bearish conditions and traders may look for selling opportunities. Traders often watch for crossovers between the price and the DEMA line as possible entry signals. Because the indicator reacts faster than traditional moving averages, it can help traders recognize trend changes earlier. Many traders combine the DEMA with other indicators such as oscillators, support and resistance levels, or price action strategies to confirm trading signals.
Formula
The Double Exponential Moving Average is calculated using the following formula:
DEMA = (2 × EMA₁) − EMA₂
Where:
- EMA₁ — Exponential moving average of price
- EMA₂ — Exponential moving average of EMA₁
This formula helps reduce lag while maintaining a smooth and responsive trend line.
Conclusion
The Double Exponential Moving Average (DEMA) is a powerful enhancement of traditional moving averages that provides faster responses to price changes while maintaining smooth trend signals. By reducing lag and closely tracking price action, the DEMA helps traders identify trends and potential trading opportunities more effectively. When combined with other technical analysis tools, it becomes a valuable indicator for traders using the MetaTrader 4 platform.
DOWNLOAD NOW Reach Us on WhatsApp
 Fly Over to Telegram
 Drop Us an Email

Reviews
There are no reviews yet