
All PivotPoints Indicator for MetaTrader 4 – FREE Download
$0.00
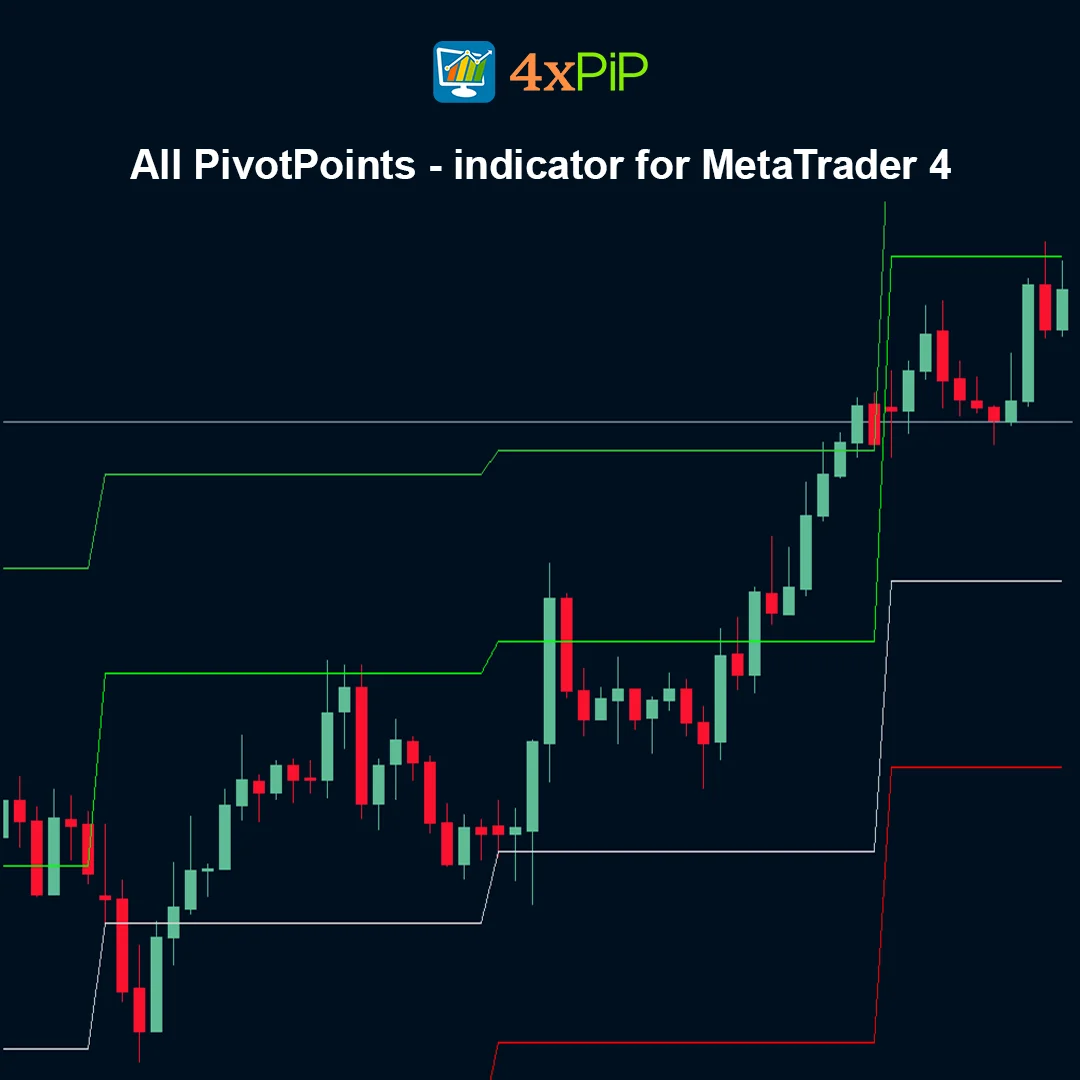
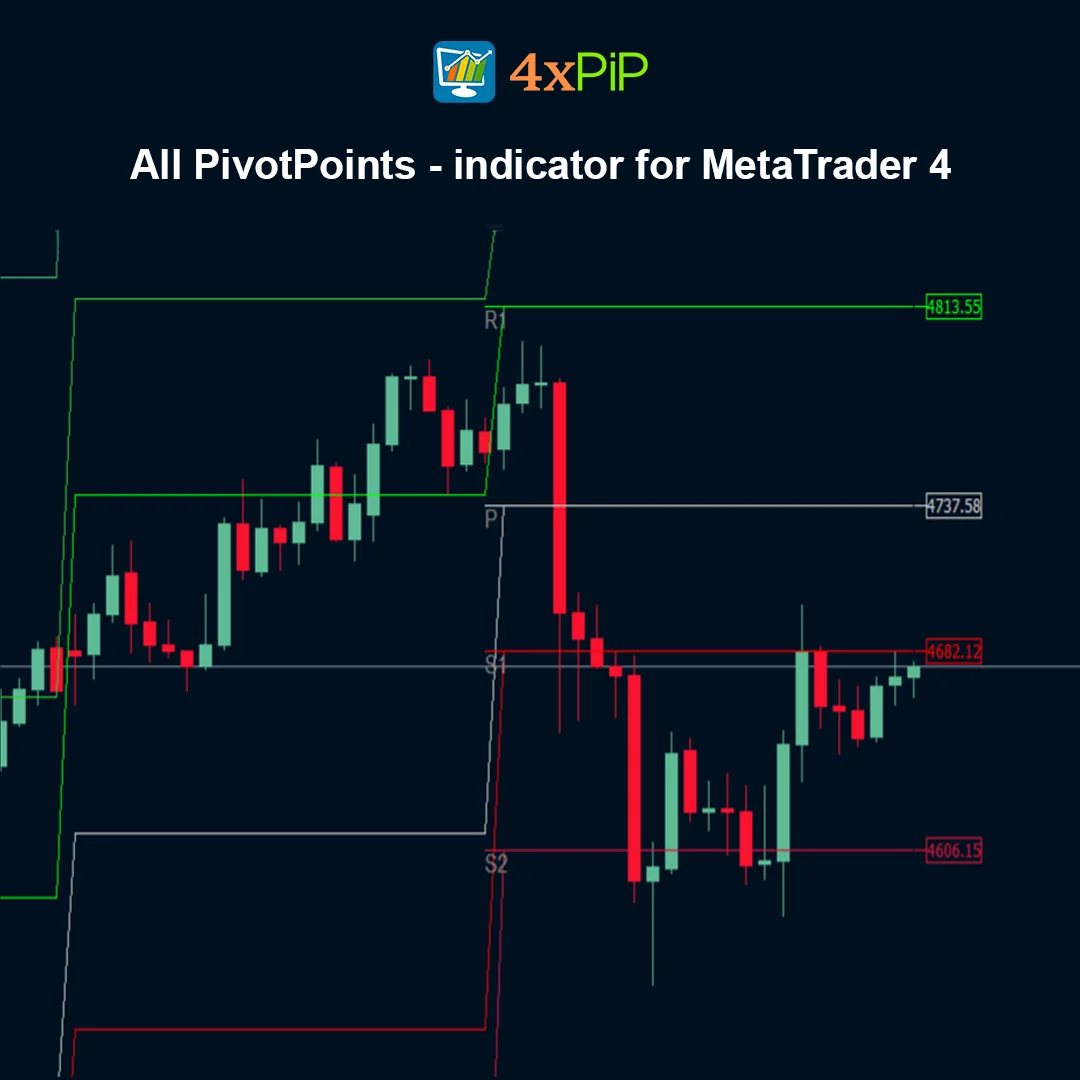
The All PivotPoints indicator is a comprehensive technical analysis tool designed to display multiple types of pivot point levels on a single chart in MetaTrader 4. It helps traders identify key support and resistance zones using various pivot calculation methods, making it a powerful solution for analyzing market structure and potential price reactions.
Unlike standard pivot indicators that use only one calculation method, the All PivotPoints indicator combines different pivot formulas (such as Classic, Fibonacci, Camarilla, and others), giving traders a broader perspective of important price levels. This allows for more accurate decision-making and better trade planning.
By plotting all major pivot levels directly on the chart, the indicator helps traders quickly identify confluence zones, where multiple levels overlap, increasing the probability of strong market reactions.
Description
What is the All PivotPoints indicator?
The All PivotPoints indicator is an advanced version of the traditional pivot point tool that displays multiple pivot calculation methods on a single chart. It helps traders identify important support and resistance levels from different perspectives.
What makes this indicator different from standard pivot indicators?
Unlike basic pivot indicators that use a single formula, the All PivotPoints indicator includes multiple pivot systems such as Classic, Fibonacci, Camarilla, and others. This allows traders to compare levels and find stronger areas of support and resistance.
How does the All PivotPoints indicator work?
The indicator calculates pivot levels using previous period price data (High, Low, Close) and applies multiple formulas. It then plots all levels on the chart, allowing traders to see where different pivot systems align.
What are confluence zones?
Confluence zones occur when pivot levels from different calculation methods overlap or are very close to each other. These areas are considered strong support or resistance levels where price is more likely to react.
How do traders use multiple pivot points?
Traders use multiple pivot points to identify high-probability trading zones. When several pivot levels align, traders often consider these areas for entries, exits, or stop-loss placement.
Why is the All PivotPoints indicator useful?
The indicator provides a more complete view of the market by combining multiple pivot systems. This helps traders make more informed decisions and improves the accuracy of identifying key price levels.
Advantages
- Displays multiple pivot point calculation methods in one indicator.
- Helps identify strong support and resistance through confluence.
- Improves accuracy in detecting key market levels.
- Suitable for intraday and short-term trading strategies.
- Saves time by combining several indicators into one.
- Works across multiple financial markets.
- Enhances trade planning and risk management.
- Useful for both beginner and advanced traders.
- Easy to visualize important price zones on the chart.
- Completely free indicator for MetaTrader 4 users.
Features
- Combines multiple pivot point systems into one tool.
- Supports Classic, Fibonacci, Camarilla, and other pivot calculations.
- Automatically calculates levels using previous price data.
- Displays Pivot Point (PP), multiple resistance (R) and support (S) levels.
- Highlights areas where different pivot levels overlap.
- Plots levels directly on the chart for easy analysis.
- Works on multiple timeframes and instruments.
- Lightweight and optimized for MetaTrader 4 performance.
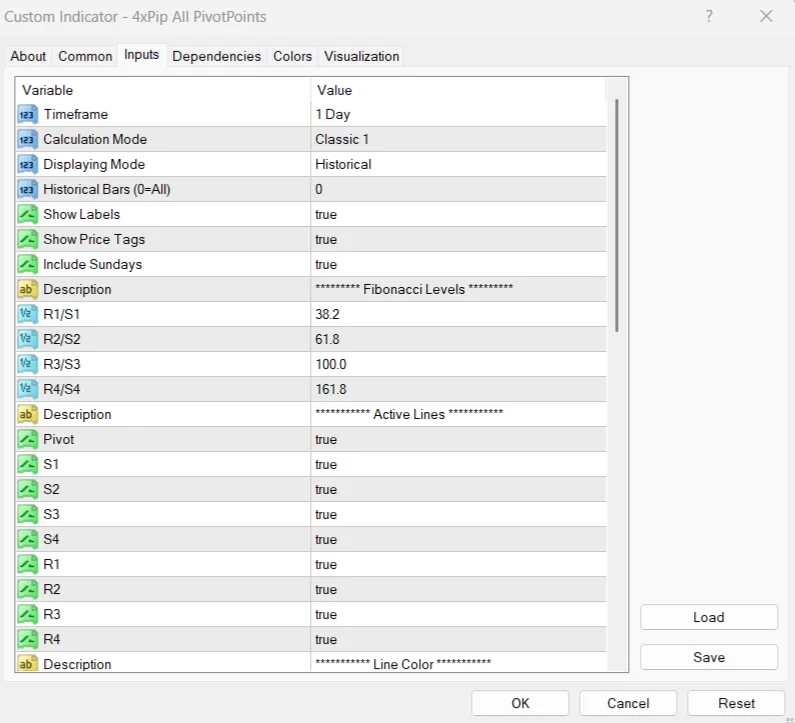
- Customizable settings for different pivot methods.
- Compatible with manual and automated trading strategies.
How to Trade
The All PivotPoints indicator is used to identify high-probability trading zones by analyzing multiple pivot levels. Traders watch for areas where different pivot systems align, as these confluence zones often act as strong support or resistance. When the price approaches a confluence zone, traders may look for reversal signals or continuation patterns depending on market conditions. If the price is above most pivot levels, it suggests bullish sentiment, and traders may look for buying opportunities near support zones. If the price is below pivot levels, it suggests bearish sentiment, and traders may consider selling near resistance zones. Combining pivot levels with other tools such as price action or momentum indicators can further improve trade accuracy.
Formula
The All PivotPoints indicator uses multiple formulas based on previous High, Low, and Close prices. One of the most common (Classic Pivot Point) formulas is:
Pivot Point (PP) = (High + Low + Close) / 3
Resistance 1 (R1) = (2 × PP) − Low
Support 1 (S1) = (2 × PP) − High
Resistance 2 (R2) = PP + (High − Low)
Support 2 (S2) = PP − (High − Low)
Additional formulas such as Fibonacci and Camarilla pivots use different calculations to generate alternative support and resistance levels.
Where:
- High — Previous period’s highest price
- Low — Previous period’s lowest price
- Close — Previous period’s closing price
- PP — Central Pivot Point level
Conclusion
The All PivotPoints indicator is a powerful and versatile tool that combines multiple pivot point calculation methods into one comprehensive solution. By displaying various support and resistance levels simultaneously, it helps traders identify strong confluence zones and make better trading decisions. Whether used for intraday trading or broader market analysis, this indicator is a valuable addition to any MetaTrader 4 trading setup.
DOWNLOAD NOW Reach Us on WhatsApp
 Fly Over to Telegram
 Drop Us an Email
FAQ's
Q & A
Related products
-
 Free
FreeMT4 EA Drawdown Limiter
Original price was: $100.00.$10.00Current price is: $10.00. Select options -
 Free
FreeMT4 Fisher Indicator
$0.00 Select options -
 Free
FreeMT4 Indicator MTF bar detector
$0.00 Select options -
 Premium
MT4 BreakEven EA
Original price was: $99.00.$10.00Current price is: $10.00. Select options
Reviews
There are no reviews yet