
Mass Index Indicator for MetaTrader 4 FREE Download
$0.00
The Mass Index is a volatility-based technical indicator designed to identify potential trend reversal points in financial markets. Developed by Donald Dorsey and available for MetaTrader 4 from MetaQuotes, the indicator analyzes the expansion and contraction of price ranges to detect possible market turning points.Unlike many indicators that focus primarily on price direction, the Mass Index focuses on volatility patterns. When price ranges expand significantly, the indicator rises; when price movements become smaller, the indicator falls. This allows traders to anticipate potential trend reversals before they occur.
Description
What is the Mass Index indicator?
The Mass Index is a technical analysis indicator that identifies potential trend reversal points by analyzing changes in the range between the High and Low prices of each bar. It focuses on volatility expansion rather than price direction, helping traders detect when a trend may be approaching a turning point.
Who created the Mass Index?
The Mass Index was developed by technical analyst Donald Dorsey. His goal was to design an indicator capable of detecting trend reversals regardless of whether the market was moving upward or downward.
How does the Mass Index work?
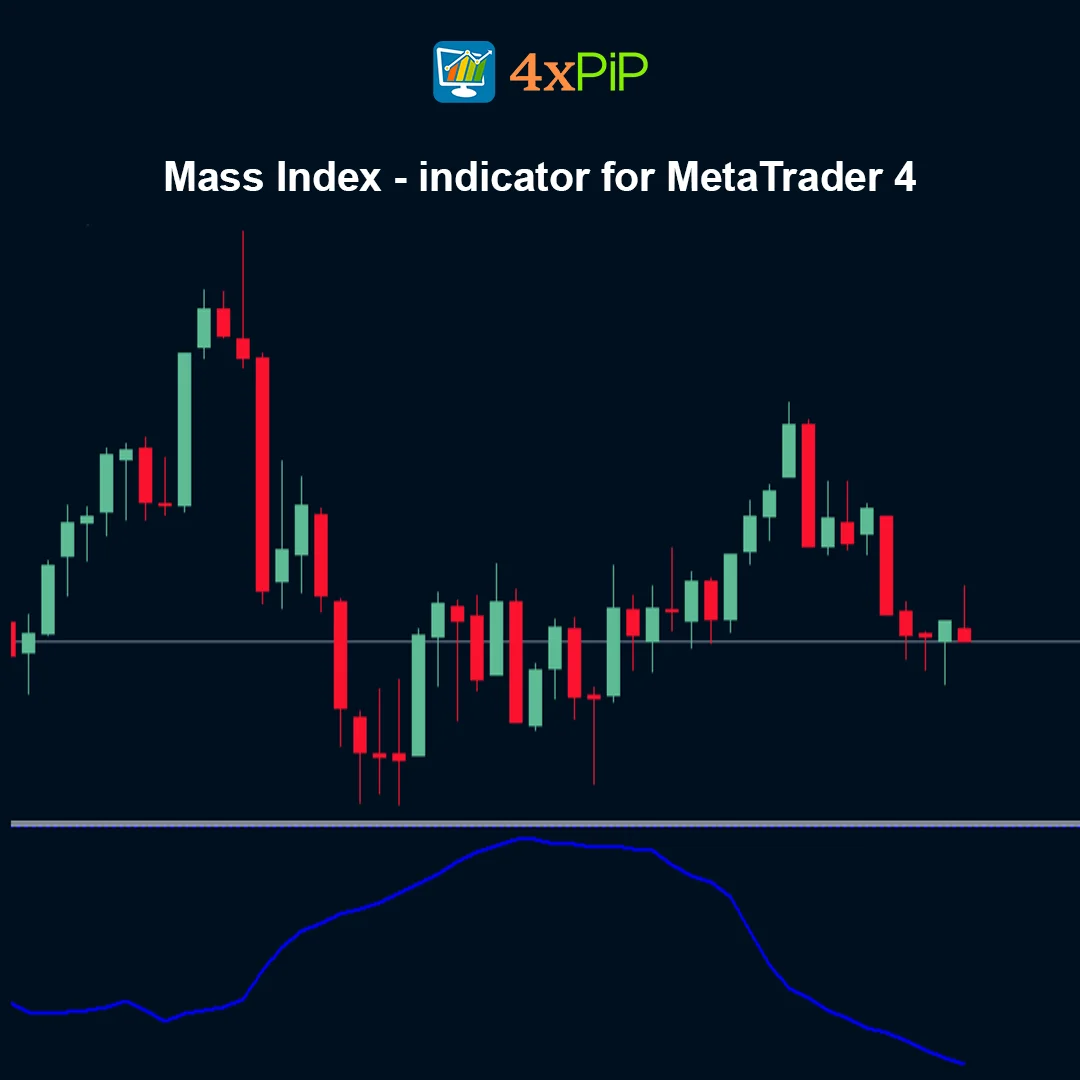
The indicator evaluates the widening and narrowing of the trading range between high and low prices. When the range expands, the Mass Index rises, indicating increasing volatility. When price movements become smaller and the range contracts, the Mass Index falls.
What is the “Reversal Bulge” pattern?
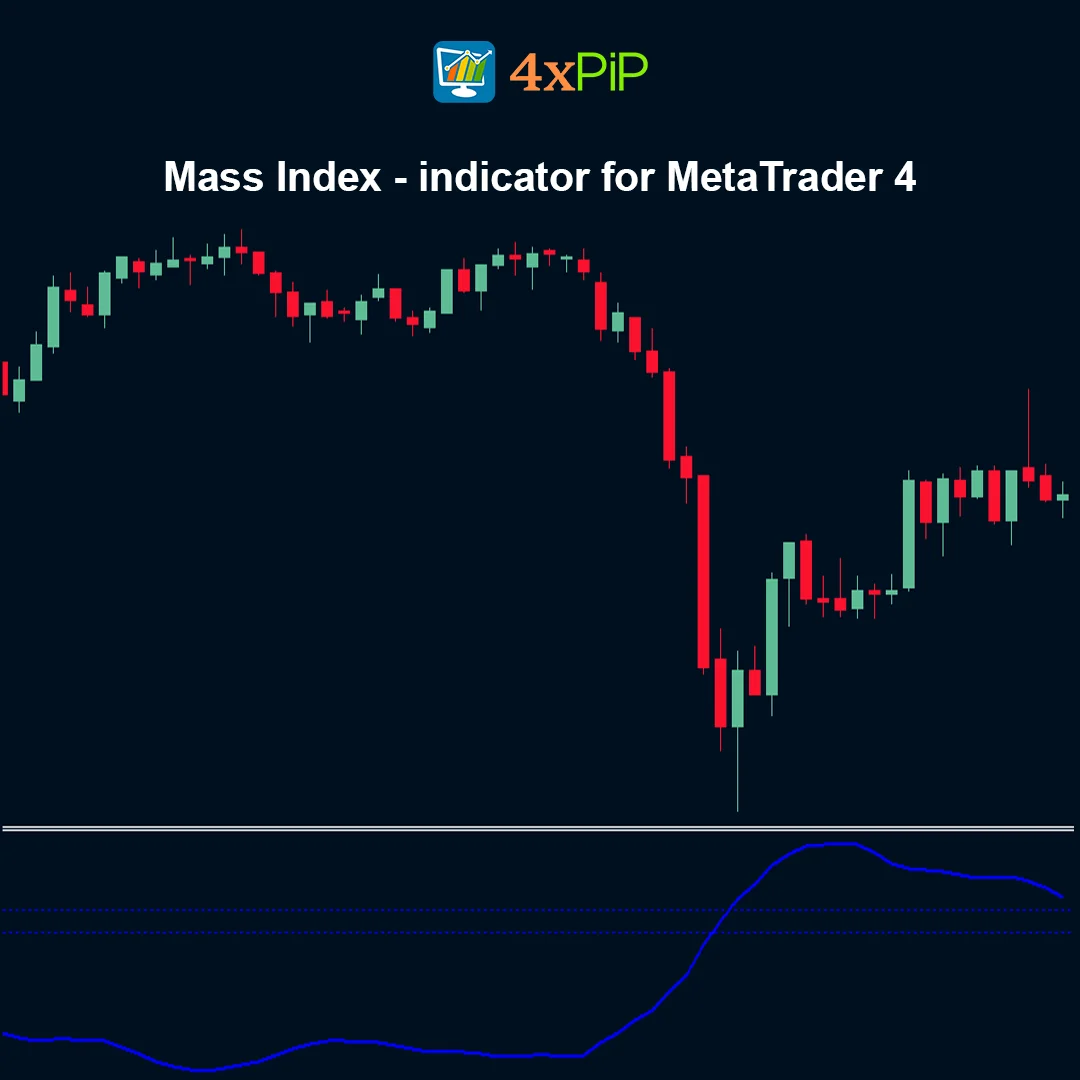
The most important signal generated by the Mass Index is known as the Reversal Bulge. This pattern occurs when the 25-period Mass Index rises above 27 and then falls below 26.5. When this pattern appears, it suggests that a price reversal may occur, regardless of the current market trend.
How do traders determine buy or sell signals?
Because the Mass Index does not provide directional signals on its own, traders often combine it with a moving average indicator. A common approach is to use a 9-period exponential moving average (EMA) of price. If a reversal bulge appears and the moving average is declining, traders may consider buying in anticipation of a bullish reversal. If the moving average is rising, traders may look for selling opportunities expecting a bearish reversal.
Why is the Mass Index useful for traders?
The Mass Index helps traders recognize changes in volatility that often occur before a trend reversal. This makes it valuable for preparing trading strategies ahead of major market turning points.
Advantages
- Designed specifically to identify potential market reversal points.
- Focuses on volatility expansion rather than price direction.
- Helps traders detect early signs of possible trend changes.
- Works effectively when combined with moving averages for directional confirmation.
- Suitable for multiple markets including Forex, stocks, and indices.
- Can be used across various timeframes from intraday to long-term trading.
- Provides unique volatility-based analysis compared to traditional indicators.
- Helps traders anticipate turning points during strong trends.
- Easy to interpret visually through its indicator line.
- Completely free to use for MetaTrader 4 traders.
Features
- Volatility-based indicator designed to identify potential trend reversals.
- Developed by Donald Dorsey and widely used in technical analysis.
- Uses the High and Low price range of each bar in calculations.
- Detects the well-known Reversal Bulge pattern.
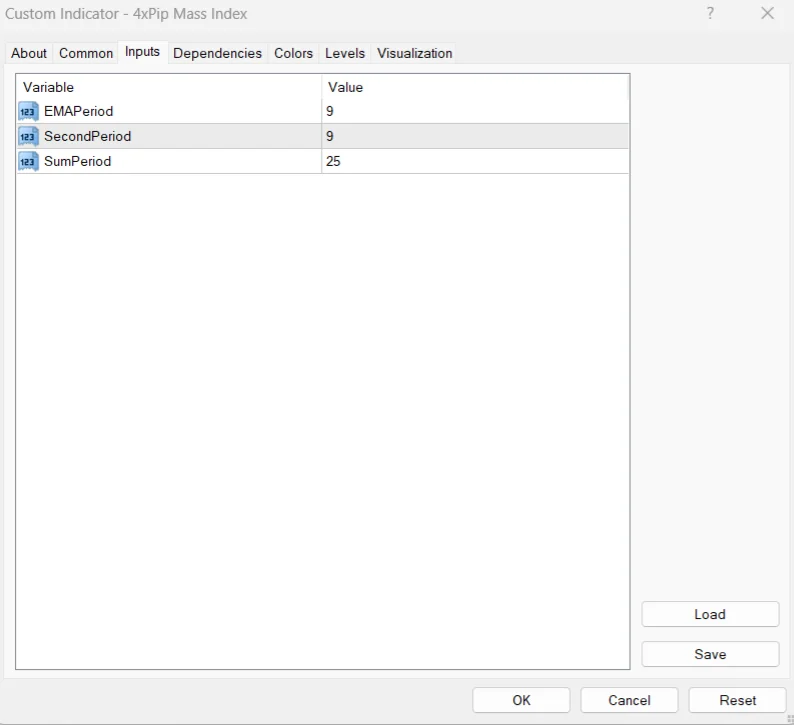
- Default configuration uses a 25-period Mass Index calculation.
- Signals potential reversals when the index rises above 27 and drops below 26.5.
- Often combined with a 9-period exponential moving average for confirmation.
- Displays data in a separate indicator window for clearer analysis.
- Optimized for efficient performance on the MetaTrader 4 platform.
- Can be combined with other indicators or automated trading systems.
How to Trade
The Mass Index indicator is mainly used to detect possible trend reversals using the Reversal Bulge pattern. Traders watch for the indicator to rise above 27 and then fall below 26.5, which signals that a market reversal may occur. Since the indicator does not indicate direction, traders typically combine it with a 9-period exponential moving average of price to determine whether to buy or sell. If the reversal bulge appears while the moving average is declining, traders may look for buying opportunities expecting a bullish reversal. If the moving average is rising, traders may consider selling opportunities anticipating a bearish reversal.
Formula
The Mass Index measures the expansion of the trading range by applying exponential moving averages to the difference between High and Low prices.
MI = ∑ᵢ₌₁²⁵ ( EMA₉(High − Low) / EMA₉(EMA₉(High − Low)) )
Where:
- MI — Mass Index value
- High − Low — Price range of each bar
- EMA₉ — 9-period exponential moving average
- 25 — Standard summation period used to identify the Reversal Bulge
Conclusion
The Mass Index is a powerful volatility indicator that helps traders anticipate potential market turning points by analyzing changes in price ranges. By focusing on volatility expansion rather than trend direction, it provides unique insights that complement traditional trend indicators. When used together with moving averages or other technical tools, the Mass Index becomes a valuable addition to any MetaTrader 4 trader’s analysis toolkit.
DOWNLOAD NOW Reach Us on WhatsApp
 Fly Over to Telegram
 Drop Us an Email
FAQ's
Q & A
Related products
-
 Premium
MT4 EA to send Signal Alerts to Telegram channel
Original price was: $100.00.$30.00Current price is: $30.00. Select options -
 Premium
FOREX TRADE MANAGER MT4 EA
Original price was: $249.00.$49.00Current price is: $49.00. Select options -
 Free
FreeMT4 Chandelier Exit Indicator
$0.00 Select options -
 Free
FreeMT4 Fisher Indicator
$0.00 Select options
Reviews
There are no reviews yet