Daily High Low Indicator for MetaTrader 5 | Download FREE
$0.00
The Daily High Low Indicator for MetaTrader 5 shows the highest and lowest price levels of the market for a selected period. It helps traders see key price zones where the market has recently reversed or broken out. This indicator is used to identify daily or custom timeframe support and resistance levels, plan entries near these points, and manage trades more effectively.
Description
What is the Daily High Low Indicator for MetaTrader 5?
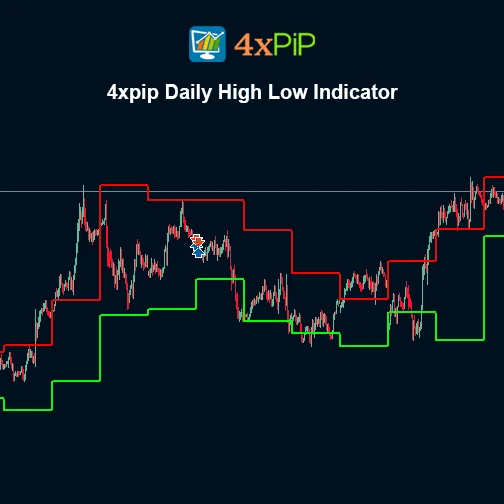
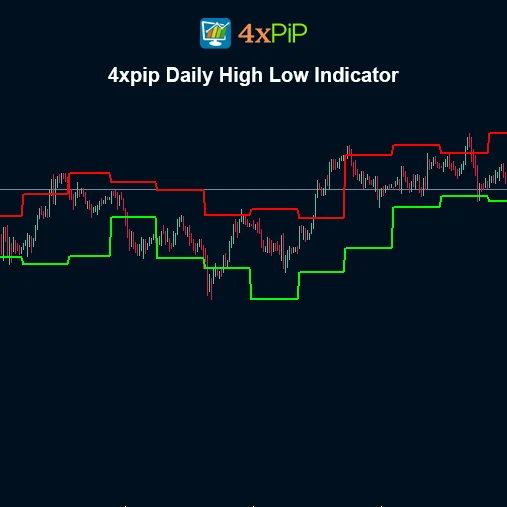
The Daily High Low Indicator for MetaTrader 5 is a technical tool that automatically plots the highest and lowest price levels of a selected timeframe on your chart. These levels help traders see the key price zones where the market has reversed or paused in the past. The indicator updates in real time, allowing traders to track market movement and identify potential breakout or reversal points.
How to Spot Breakouts and Reversals using 4xpip Daily High Low Indicator for MetaTrader 5
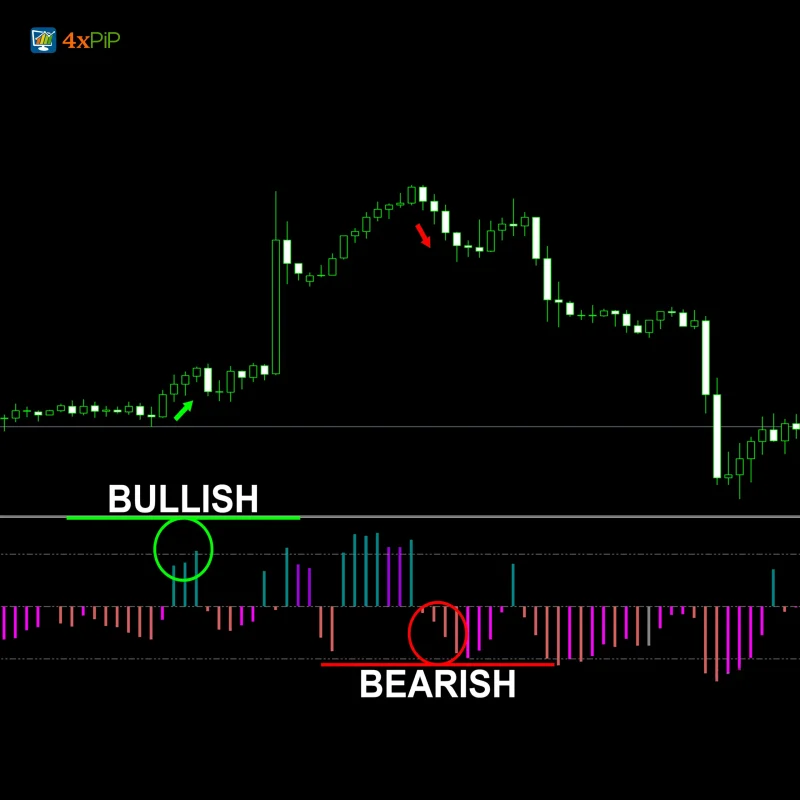
Spotting breakouts with the 4xpip Daily High Low Indicator for MetaTrader 5 is very easy. When the price moves close to the daily high or low line, traders can watch for strong candles or volume spikes. If the price closes above the daily high, it often signals bullish momentum and a breakout to the upside. A close below the daily low can signal a bearish breakout. Traders use these breakout points to enter trades in the direction of the trend.
The indicator also helps find reversal points. When the price reaches the daily high or low but fails to break, it may bounce back in the opposite direction. This shows weakness in the trend. Candlestick patterns like pin bars, engulfing candles, or double tops near the high or low make reversals more reliable. By watching how price reacts at these levels, traders can spot early turning points and make smarter trading decisions.
How does Daily High Low Indicator work?
The indicator reads market data from the selected timeframe, such as daily, hourly, or any custom period, and marks the high and low levels directly on the chart. It supports multiple price calculation modes, including Low/High, Open/Close, and Close/Close. Traders can also choose to view the previous period’s levels for better comparison. The indicator uses efficient data processing, which ensures smooth performance without slowing down MetaTrader 5.
Why should traders use it?
Traders use the Daily High Low Indicator to improve accuracy in decision-making. These price levels act as visual guides for setting stop-loss, take-profit, or pending orders. The indicator is especially useful for strategies based on support and resistance or daily breakout trading. It helps traders quickly identify where the market is likely to react, making it easier to plan trades with confidence and better risk control.
Features
- Customizable Timeframe: Traders can choose any timeframe such as daily, hourly, or weekly to calculate high and low levels.
- Multiple Price Modes: Allows users to select between Low/High, Open/Close, or Close/Close modes for flexible analysis.
- Previous Period Option: Let traders view the high and low of the previous period for better comparison and historical insight.
- Accurate Level Calculation: Uses real market data to calculate the exact high and low points of the selected timeframe.
- Automatic Chart Plotting: Draws clear lines directly on the chart showing the high and low levels without manual effort.
- Lightweight Processing: Runs smoothly on MetaTrader 5 without slowing down the platform or affecting performance.
- Real-time Updates: Continuously updates the plotted levels as new price data comes in to keep information current.
- Visual Customization: Users can change line color, width, and style for clear visibility based on their chart preference.
- Easy Integration: Works with any trading strategy or system that relies on price action, breakout, or support and resistance levels.
- Compatible with All Symbols: Can be used on any currency pair, stock, commodity, or index available in MetaTrader 5.
How to Trade
Use the Daily High Low Indicator to trade breakouts by waiting for price to approach the high or low of the selected period. When price breaks above the daily high with strong momentum or volume, enter a buy trade targeting the next resistance or a fixed risk-reward. Place a stop-loss just below the broken high to protect against false breakouts. If price rejects the high and closes back inside the range, avoid entering and wait for confirmation. This method works well on volatile pairs or during news sessions.
For reversal trading, watch how price reacts when it touches the marked daily low or high. If price hits a level and shows rejection candles like pin bars or engulfing patterns, enter in the opposite direction. This works well for range-bound markets where price respects support and resistance. By combining entry signals with high/low boundaries, traders get more accurate timing and stronger risk control.
Formula
High Record Percent = New HighsNew Highs + New Lows X 100
Conclusion
The Daily High Low Indicator for MT5 simplifies intraday market analysis by marking the most important price boundaries of the session. It updates automatically, works on any instrument, and helps identify breakouts, reversals, and momentum shifts with precision. With clear visuals, customizable settings, and real-time tracking, it is a valuable tool for traders who rely on price action and structure.
DOWNLOAD NOW Reach Us on WhatsApp
 Fly Over to Telegram
 Drop Us an Email
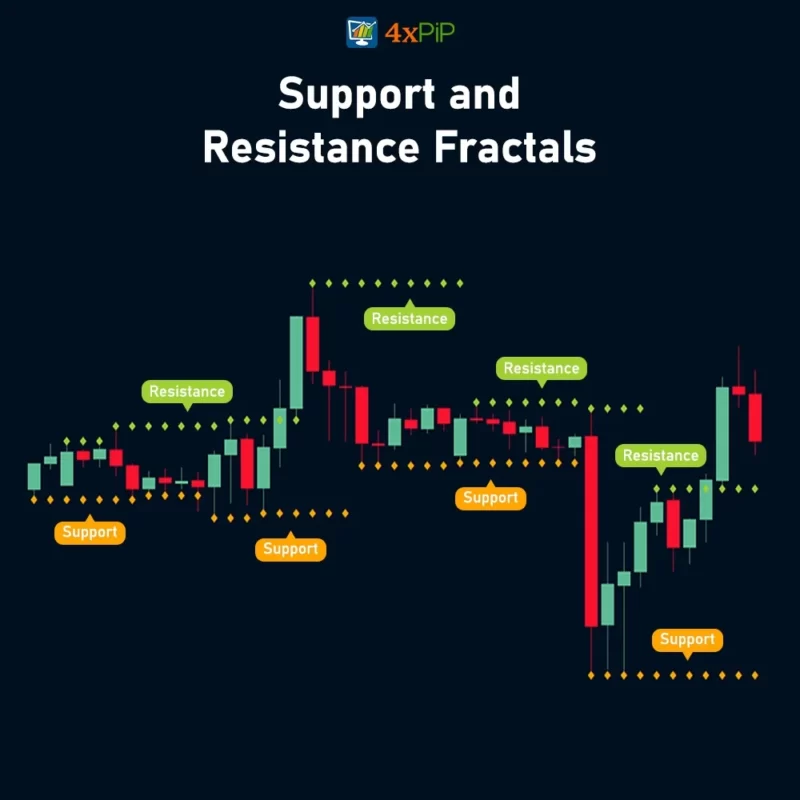


Reviews
There are no reviews yet