Zigzag Arrow Indicator for MT5
$0.00
The Zigzag Arrow Indicator is an amazing technical analysis indicator used in financial markets for identifying market trends and potential reversals. It works on the candle stick pattern and finds the higher highs, higher lows, lower highs, and lower lows and also shows green and red dots for potential buying and selling opportunities.
Description
What is Zigzag Arrow Indicator? The Zigzag Arrow Indicator is a tool used in financial markets to help traders spot trends and changes in direction more easily. It’s based on the Zigzag indicator but makes things clearer for traders. It looks at patterns in candlestick charts to find when prices are going higher or lower. This helps traders ignore small price changes and focus on the big shifts in the market. Also, the Zigzag Arrow Indicator helps traders see the trend direction more clearly by removing distracting signals. It uses green and red dots to show when it might be a good time to buy or sell. This makes it easier for traders to spot when the market might be changing direction.
When using the Zigzag Arrow Indicator, it’s important to understand a few things. Firstly, it looks at past prices, not future ones. Also, some Zigzag Arrow Indicators change previous points when new price data comes in. Traders should be careful about this and also use other indicators for confirmation of a signal.
Advantages of using Zigzag indicator:
The Zigzag Arrow Indicator offers several trading advantages that can improve your trading experience:
Sharpens Trend Identification: By eliminating minor price changes, the indicator allows you to focus on the bigger picture. This makes it easier to spot the underlying trend direction, whether up, down, or sideways.
Effortless Support & Resistance: Zigzag arrows gather around key price zones, highlighting potential support and resistance levels. This can be important for traders who look to enter near support or exit near resistance.
Visual Clarity: Also, the indicator provides a clear visual representation of highs and lows, removing doubts from chart analysis. This straightforward approach makes it easier to identify potential entry and exit points for trades.
User-Friendly for Beginners: Unlike some complex technical indicators, the Zigzag Arrow is pretty easy to understand. The clear dots and arrows make it a valuable tool for new traders who are still developing their chart-reading skills.
Customizable for Different Strategies: Lastly, the indicator often allows you to adjust the settings for filtering price movements. This lets you customize it to your specific trading style and risk tolerance.
Formula:
ZigZag (HL,%change=X,retrace=FALSE,LastExtreme=TRUE)
If %change>=X
plot ZigZag
Where,
HL=HighLow price series or Closing price series
%change=Minimum price movement, in percentage
Retrace=Is change a retracement of the previous move or an absolute change from peak to trough?
LastExtreme=If the extreme price is the same over multiple periods, is the extreme price the first or last observation?
How to Trade with Zigzag Indicator?
Start by setting up the Zigzag Indicator to show a certain percentage or point value that matches how you want to trade and how much risk you’re willing to take. A lower setting catches more small changes, and a higher setting focuses on bigger trends. Moreover, depending on the trend direction, traders can identify entry points.
In an uptrend, look for a low point shown by a downward Zigzag arrow. If the price then goes above the last high point (shown by an upward Zigzag arrow), it means the upward trend might continue. This could be a good time to buy.
In a downtrend, look for a peak marked by an arrow going up. If the price then drops below the previous low point marked by an arrow pointing down, it suggests the downtrend might continue. This could be a good time to consider selling.
Furthermore, consider exiting the trade if the Zigzag Indicator generates a reversal signal opposite to your position. For example, if holding a long position during an uptrend, monitor for a swing low accompanied by a downward-pointing Zigzag arrow as a potential trigger to exit the trade.
Features:
Here are some features of Zigzag arrow indicator:
- Trend Visualization: The Zigzag Arrow Indicator filters out minor price movements, highlighting significant swings (highs and lows) with arrows. This allows for a clearer view of the trend direction.
- Swing Point Identification: By focusing on major swings, the indicator makes it easier to pinpoint potential entry and exit points for trading strategies.
- Support & Resistance Levels: Zigzag arrows gather around key price zones, highlighting areas of potential support and resistance. This can be valuable for traders looking to buy near support or sell near resistance.
- Visual Clarity: The arrows provide a clear and straightforward representation of swing highs and lows, removing confusion from chart analysis. This makes it easier to understand the market’s movement.
- Beginner Friendly: Zigzag Arrow Indicator is very easy to understand due to the use of arrows. This makes it a useful tool for new traders.
- Customizable: The indicator often allows you to adjust the settings for filtering price movements. This lets you tailor it to your specific trading style and risk tolerance.
- Complements Other Indicators: While valuable on its own, the Zigzag Arrow Indicator shines when combined with other technical analysis tools. It can provide additional confirmation for signals generated by other indicators.
- Multiple Timeframe Compatibility: Some Zigzag Arrow Indicators allow you to use them across different timeframes. This can help analyze the market from a short-term and long-term perspective.
Conclusion
The Zigzag Arrow Indicator helps traders in financial markets by showing trends and making analysis easier. It uses green and red dots to show when to buy or sell, which is good for beginners. Also, you can adjust it to fit different trading plans. Moreover, it focuses on big price changes and support/resistance levels, giving a clear view of the market. Lastly, it works well with other indicators for better market analysis.
DOWNLOAD NOW Reach Us on WhatsApp
 Fly Over to Telegram
 Drop Us an Email
Settings
- iExtPeriod: Number of bars to calculate the extremums. The value should be not less than 2
- iMinAmplitude: Minimal distance between the neighbor peak and bottom (overwise it will skip)
- iMinMotion: Minimal price movement in points at the zeroth bar for recalculation of the indicator
- iUseSmallerTFforEB: Use a more precise algorithm to calculate the ordering of the High/Low formation
21 reviews for Zigzag Arrow Indicator for MT5
| 5 star | 61% | |
| 4 star | 38% | |
| 3 star | 0% | |
| 2 star | 0% | |
| 1 star | 0% |
Q & A
In an uptrend, traders may look for low points marked by downward arrows for potential buying opportunities, while in a downtrend, they may consider selling when peaks marked by upward arrows are observed, with exits signaled by reversal signals opposite to their positions.
Yes, traders can adjust the settings of the indicator to filter price movements according to their preferred trading style and risk tolerance, enhancing its adaptability to various market conditions.
Yes, the indicator is beginner-friendly due to its clear visual representation and straightforward signals, making it accessible for new traders who are still developing their chart reading skills.
The Zigzag Arrow Indicator sharpens trend identification, simplifies support and resistance analysis, offers visual clarity, suits beginners, and allows customization to different trading strategies and risk tolerances.
It analyzes candlestick patterns to detect higher highs, higher lows, lower highs, and lower lows, providing visual cues for traders to determine trend directions and possible entry or exit points in the market.
Related products
-
 Premium
Forex News (EA) Expert Advisor for MT5 | Economic Calendar
Original price was: $199.00.$99.00Current price is: $99.00. Select options -
 Premium
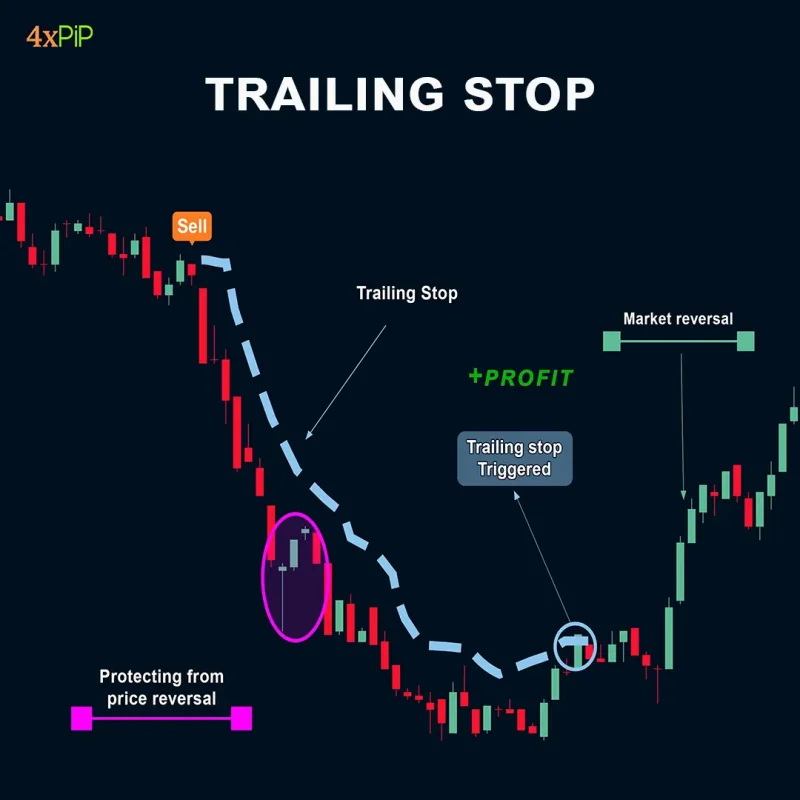
MT5 Trailing Stop EA
Original price was: $99.00.$10.00Current price is: $10.00. Select options -
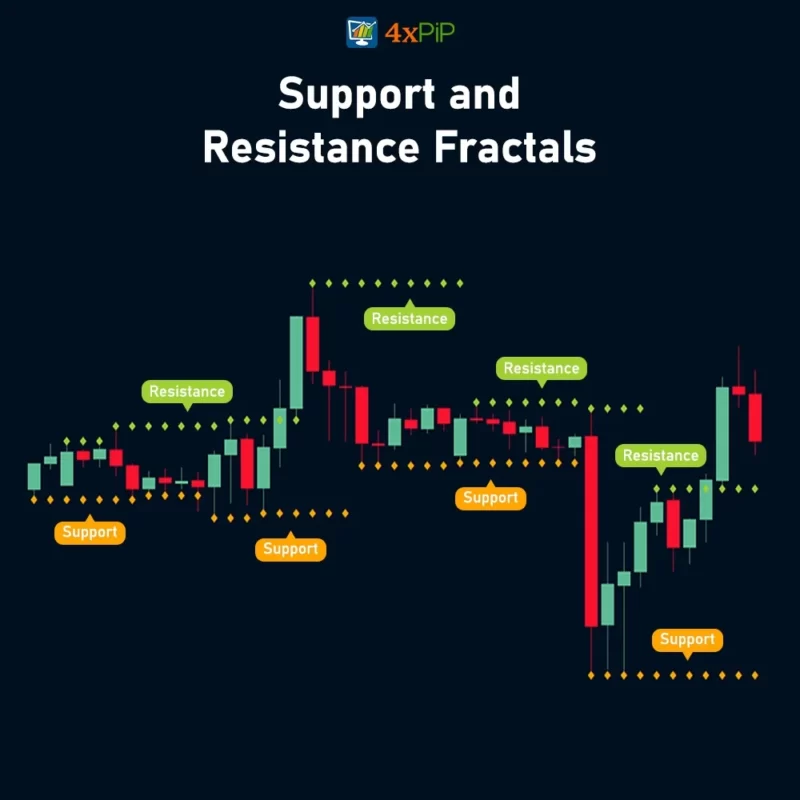
Support and Resistance Fractals – Indicator for MT5
$0.00 Select options -
 Free
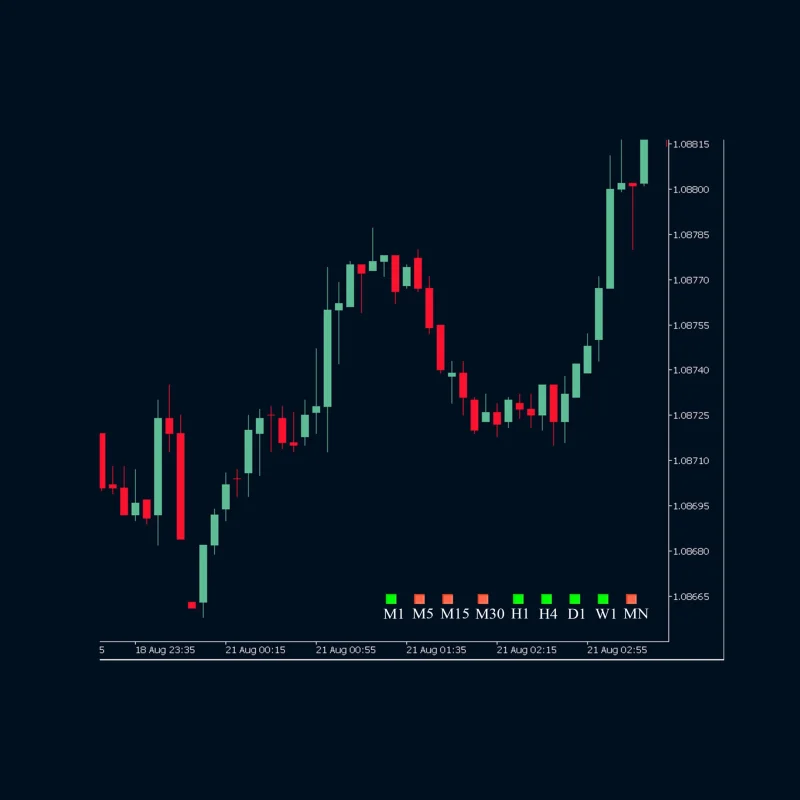
FreeMT5 Indicator MTF bar detector
$0.00 Select options
Martingale EA can be effective, but it’s not a one-size-fits-all solution. It requires careful risk management. The 100% winning rate claim should be taken with a grain of salt.
Martingale Forex EA turned my trading game around. The 100% winning rate claim is no joke. I’ve experienced consistent profits, and the counter trades are a lifesaver. Highly recommended!
Martingale EA is effective, but the emphasis on a 100% winning rate may mislead some traders. Use it cautiously, and it can be a valuable tool in your trading strategy.
Martingale EA is effective, but it’s not a foolproof strategy. The 100% winning rate claim is a bit ambitious. Use it cautiously, and it can be a valuable asset in your trading arsenal.
Martingale EA is a reliable performer. The 100% winning rate may not be guaranteed, but it significantly improves your trading odds. Use it wisely, and it can be a game-changer.