Trend Envelope Indicator for MetaTrader 4 – Download Free
$0.00
Trend Envelope Indicator helps traders in identifying market trends. It has three lines which show buying and selling opportunities. This indicator also gives buy and sell signals with arrows, So traders can make better decisions for buying and selling. It uses Price Action analysis, concept of Advanced Envelops, Moving Average, ATR Indicator and Volume indicator.
Description
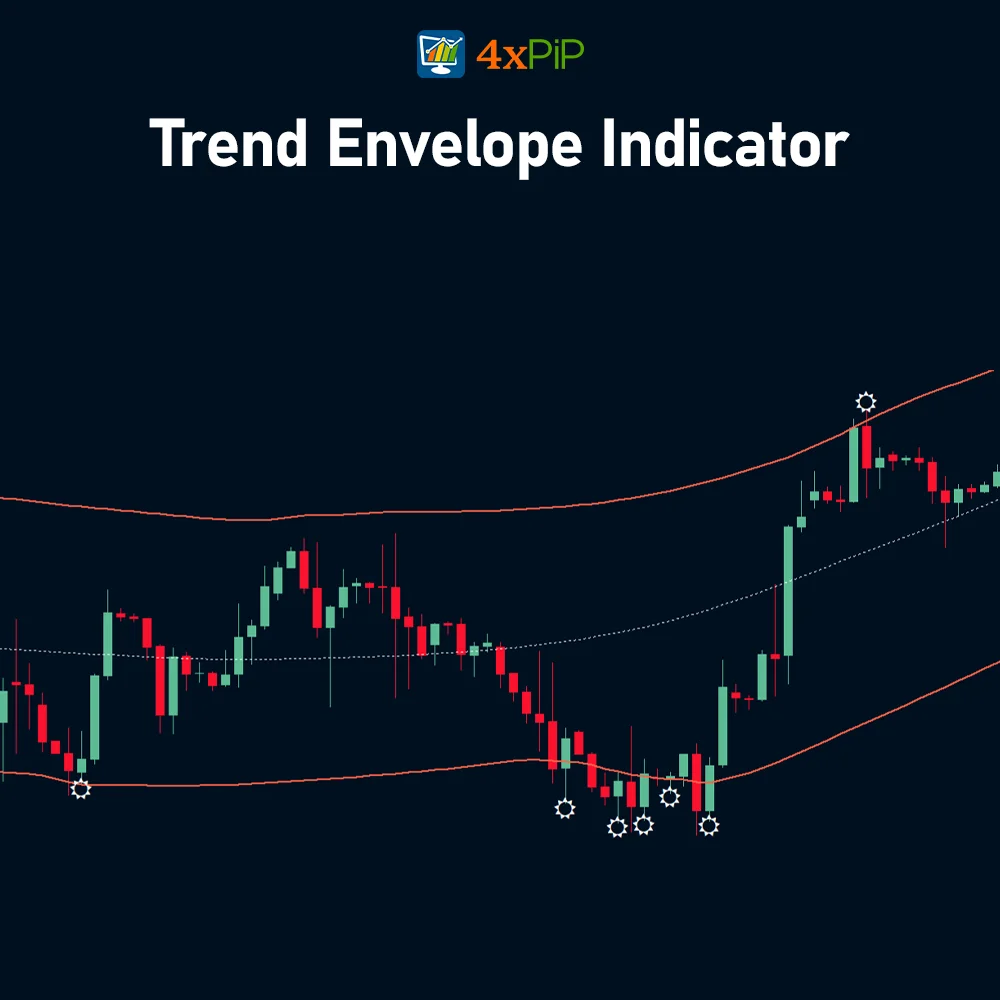
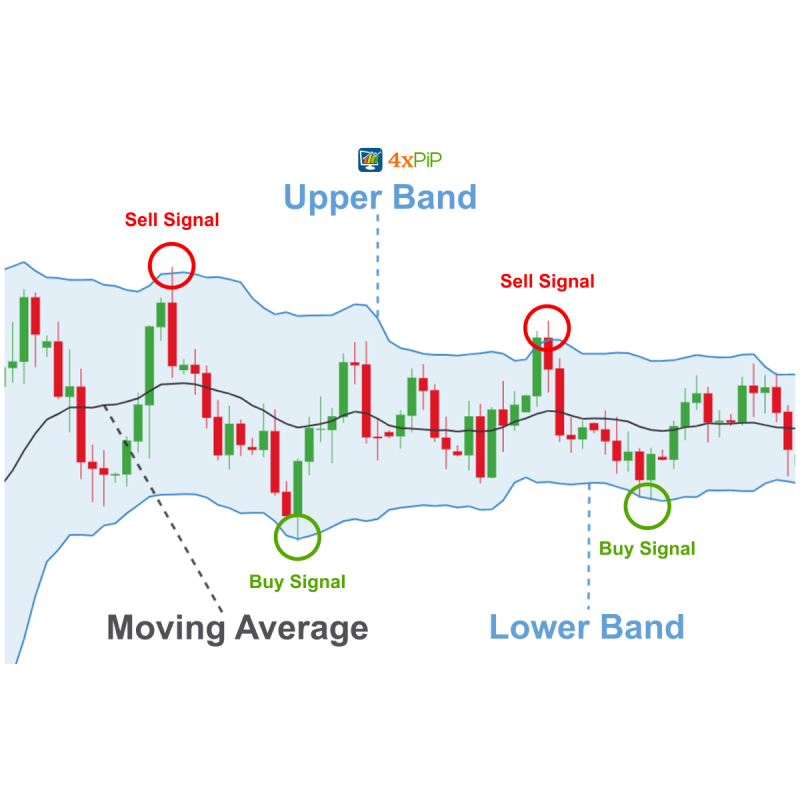
What is Trend Envelope Indicator? The Trend Envelope Indicator is a powerful indicator designed to help traders understand the market movements. This indicator shows three lines on the chart – an upper line, a lower line, and a dotted line in the middle. The upper and lower lines act as boundaries, helping you see trend directions. When the price touches the upper line, it indicates a potential selling opportunity. On the other hand, when the price reaches the lower line, it indicates a potential buying opportunity. The dotted line in the middle serves two purposes.
Firstly, it acts as a trend confirmation tool. If the price consistently stays above the middle line, it suggests an uptrend is in play. If prices are mostly below a line, it means they are going down. And, if they cross the line a lot, it means the prices are not changing much. But if prices stay consistently above or below the line without crossing, it suggests a strong trend in either going up or down. This indicator uses Price Action analysis, concept of Advanced Envelops, Moving Average, ATR Indicator and Volume indicator.
Details of Trend Envelope Indicator:
The Trend Envelope Indicator is a helpful indicator for taking advantage of market movements, understanding of market trends, potential reversal points, and overbought and oversold conditions. It presents three key elements to guide your analysis:
Identifying Trends:
The Trend Envelope Indicator shows three lines on your chart – an upper line, a lower line, and a dotted line in the middle. The upper and lower lines show limits, helping you see possible trend directions. If the price hits the upper line, it might be a good time to sell. This could mean the market is overbought, and the price might need to come down. On the other hand, if the price hits the lower line, it could be a chance to buy. This suggests the market is oversold, and the price might bounce back up.
Confirmation and Consolidation:
The dotted line in the middle serves two purposes. Firstly, it acts as a trend confirmation tool. If the price consistently stays above the middle line, it suggests an uptrend is in play. Oppositely, prices consistently below the line indicate a downtrend. Secondly, this line helps identify consolidation periods where the price moves sideways. When the price repeatedly crosses the middle line, it shows consolidation in the market.
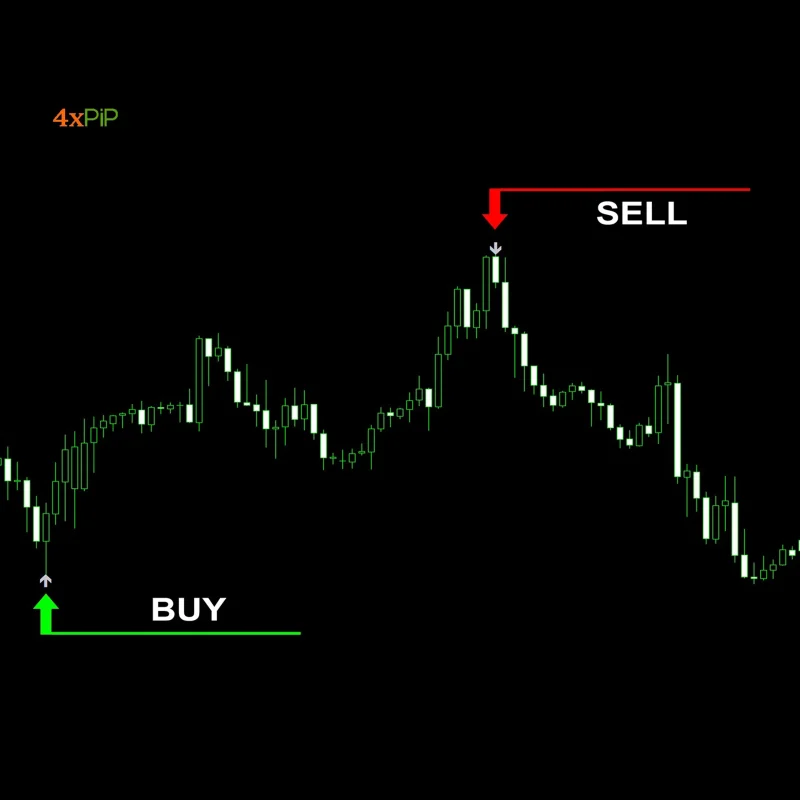
Signals with Arrows:
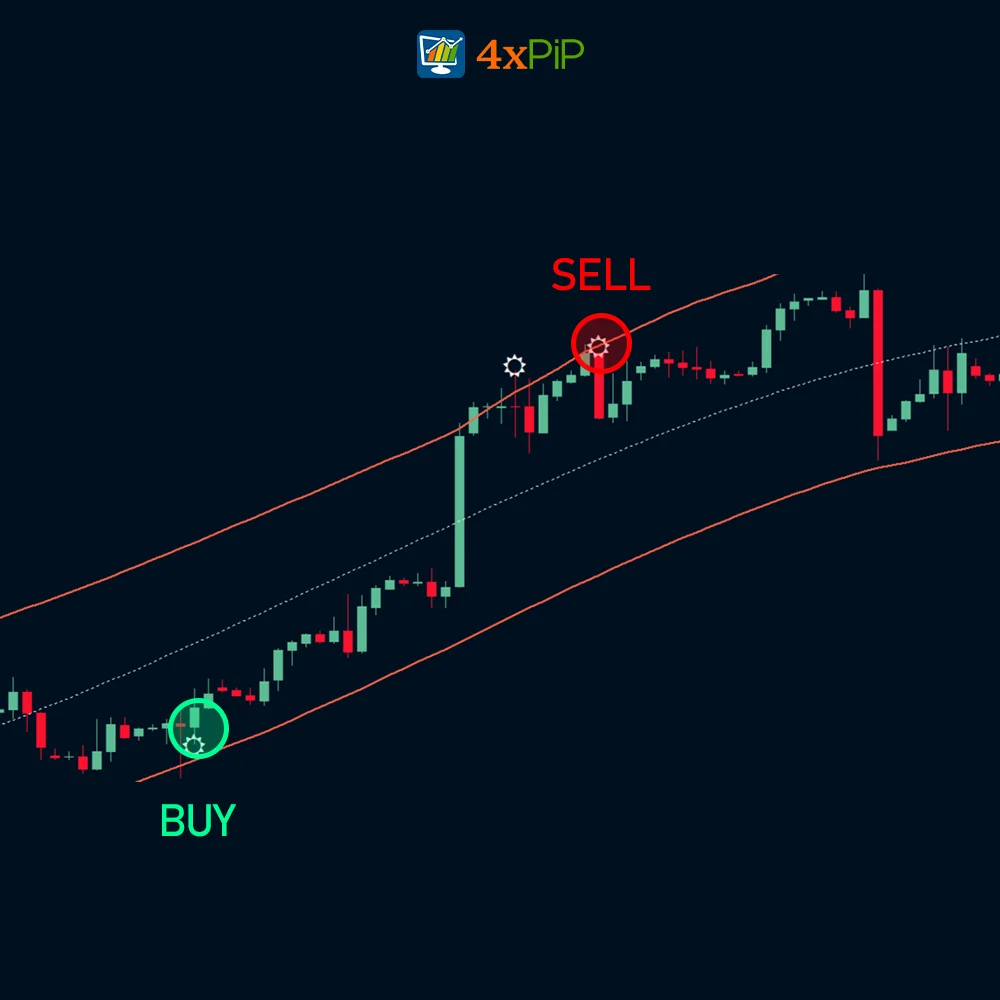
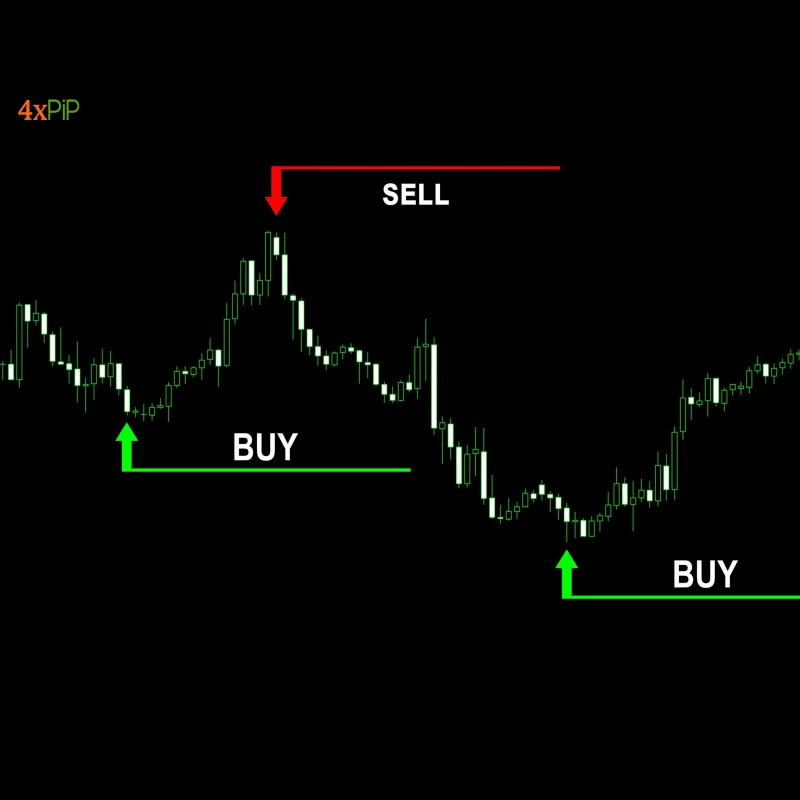
To further help in your analysis, Trend Envelope Indicators use arrows. Arrows above the upper line and below the lower line act as sell and buy signals, respectively, offering additional confirmation for potential entry and exit points. Additionally, the indicator supports the overbought and oversold concepts by highlighting these zones when the price reaches the upper and lower lines.
The Trend Envelope Indicator helps traders in making smart trading choices by using Moving Averages, Average True Range (ATR) indicator, and Volume indicator. It gives you a clear picture of market trends and possible turning points.
Formula:
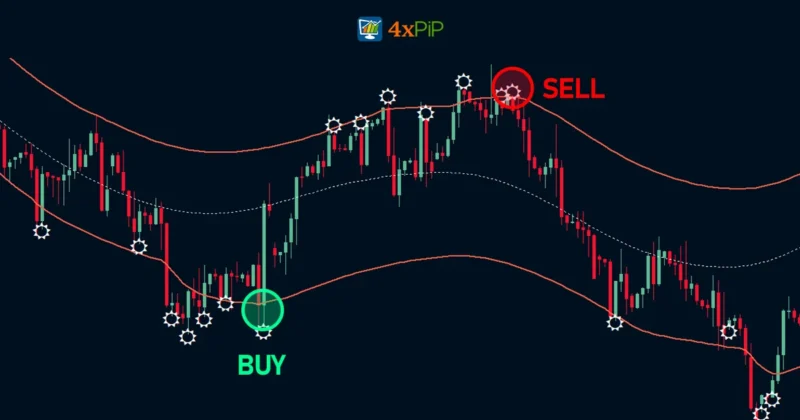
The Trend envelope indicator analyzes market trends using the ATR, Moving Average, Envelopes and candlestick patterns. Once the indicator finds out that the trend is going up, it paints Arrows at the Lower line of Envelope. Likewise, once the indicator finds out that the trend is going down, it paints Arrows at the Upper line of Envelope.
How to Trade with Trend Envelope Indicator?
The Trend Envelope Indicator offers various ways to approach trades, but it’s important to consider other factors and use your own judgment before making any investment decisions. Here are some common strategies:
Trend Following with Envelope Touches: Look for buy signals during an uptrend. This could be when the price touches or breaks below the lower envelope and an upward arrow appears. Additionally, the price should be trading above the middle line. Look for sell signals during a downtrend. This could be when the price touches or breaks above the upper envelope and a downward arrow appears. Additionally, the price should be trading below the middle line.
Overbought/Oversold Conditions: When the price reaches the upper envelope, it might be overbought, indicating a potential sell opportunity. This is especially true if accompanied by bearish signals from other indicators. On the other hand, when the price touches the lower envelope, it might be oversold, suggesting a potential buy opportunity.
Consolidation Breakouts: Identify consolidation periods when the price repeatedly crosses the middle line. Look for a breakout from the consolidation zone, where the price decisively moves above the upper envelope (potential buy) or below the lower envelope (potential sell) with increased volume.
Features:
- Visualizes Trends: The indicator displays three lines: an upper envelope, a lower envelope, and a middle line. The upper and lower envelopes help traders visualize potential support and resistance levels, aiding in identifying uptrends and downtrends.
- Identifies Potential Reversals: When the price touches the upper envelope, it suggests a potential sell opportunity, as the market might be overbought. Conversely, reaching the lower envelope could signal a potential buy opportunity, indicating an oversold state.
- Confirms Trends: The middle line acts as a trend confirmation tool. If the price consistently stays above the middle line, it suggests an uptrend is in play, and vice versa for a downtrend.
- Highlights Consolidation: The middle line also helps identify consolidation periods where the price moves sideways. When the price repeatedly crosses the middle line, it signifies consolidation.
- Provides Buy and Sell Arrows: The indicator incorporates arrows that appear above the upper envelope (sell signal) and below the lower envelope (buy signal), offering additional confirmation for potential entry and exit points.
- Indicates Overbought and Oversold: The indicator reinforces overbought and oversold concepts by highlighting these zones when the price reaches the upper and lower lines, respectively.
- Combines Multiple Tools: The Trend Envelope Indicator is said to incorporate concepts from various technical analysis tools like Moving Averages, Average True Range (ATR), and Volume, potentially offering a more comprehensive analysis.
- Easy to Understand: Compared to some technical indicators, the Trend Envelope Indicator’s visual presentation with lines and arrows can be relatively easier to understand for new traders.
Conclusion
Introducing Trend Envelope Indicator, an analytic tool for traders. It uses three lines on a chart to show upper and lower limits, along with a middle line. This helps spot good times to buy or sell. It combines Price Action analysis, Advanced Envelopes, Moving Average, ATR Indicator, and Volume indicator for a complete view, making it easier to make smart trading decisions based on current market trends.
DOWNLOAD NOW Reach Us on WhatsApp
 Fly Over to Telegram
 Drop Us an Email
Settings
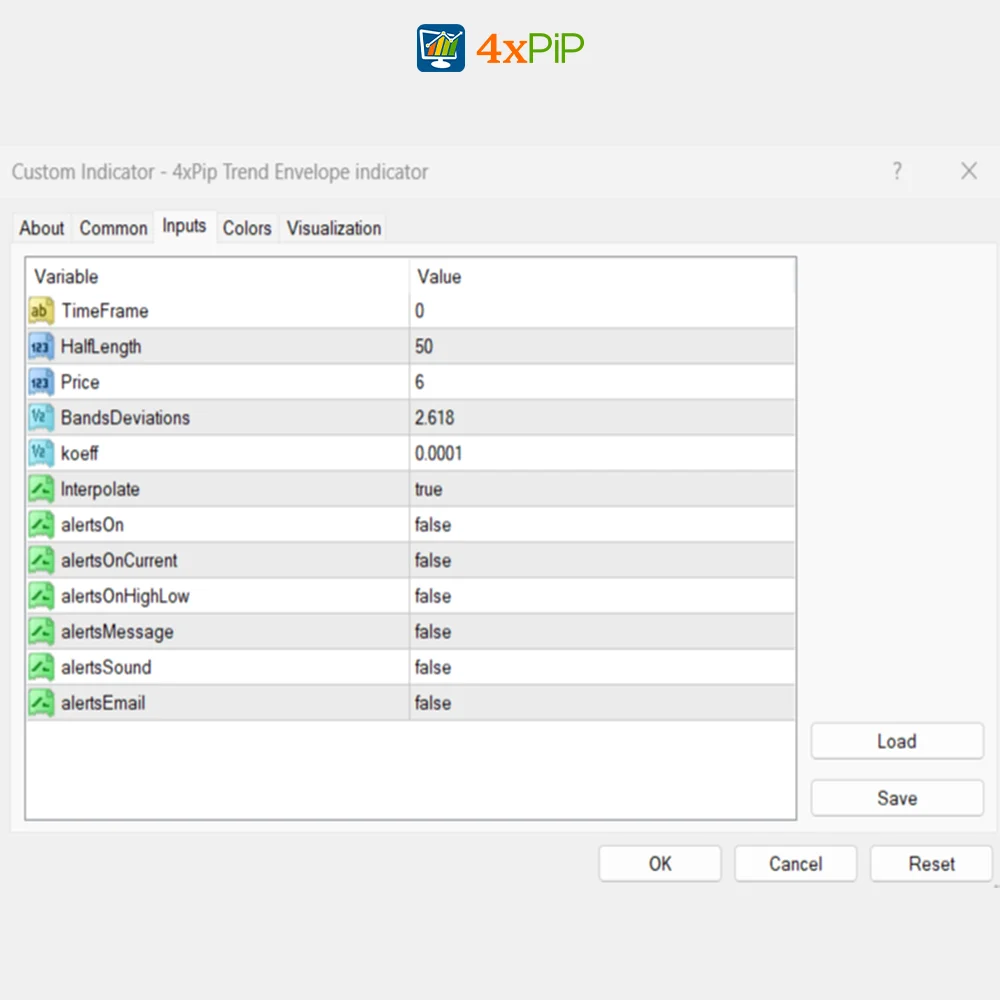
- TimeFrame (value = 0)
- HalfLength (value = 50)
- Price (value = 6)
- BandsDeviations (value = 2.618)
- Koeff (value = 0.0001)
- Interpolate: True => Indicator will show Interpolate. False => Indicator will not show Interpolate.
- alertsOn: True => Indicator will show alerts. False => Indicator will not show alerts.
- alertsOnCurrent: True => Indicator will show alerts on current time. False => Indicator will not show alerts at current time.
- alertsOnHighLow: True => Indicator will send alerts during highs and lows. False => Indicator will not send alerts during highs and lows.
- alertsMessage: True => Indicator will send alerts through message. False => Indicator will not send alerts through message.
- alertsSound: True => Indicator will make a sound for alerts. False Indicator will not make a sound for alerts.
- alertsEmail: True => Indicator will send alerts through email. False => Indicator will not send alerts through email.
41 reviews for Trend Envelope Indicator for MetaTrader 4 – Download Free
| 5 star | 36% | |
| 4 star | 63% | |
| 3 star | 0% | |
| 2 star | 0% | |
| 1 star | 0% |
Q & A
Yes, by identifying consolidation periods where the price repeatedly crosses the middle line, traders can look for breakouts where the price decisively moves above the upper envelope (potential buy) or below the lower envelope (potential sell) with increased volume.
During an uptrend, look for buy signals when the price touches or breaks below the lower envelope and upward arrows appear. For downtrends, seek sell signals when the price touches or breaks above the upper envelope with downward arrows.
Yes, the visual presentation with lines and arrows makes it relatively easier for new traders to understand compared to some other technical indicators.
The indicator integrates concepts from various tools such as Moving Averages, Average True Range (ATR), and Volume, providing a comprehensive analysis.
Overbought conditions are indicated when the price reaches the upper envelope, while oversold conditions are highlighted when it reaches the lower envelope.
Martingale EA is a valuable addition to my trading toolkit. It does what it says, but caution and discipline are essential. The counter trades have been a game-changer for me.
Martingale EA is a reliable performer. The counter trades have saved me from significant losses. Just remember, like any tool, it’s most effective when used judiciously.
Martingale EA is effective, but the emphasis on a 100% winning rate may mislead some traders. Use it cautiously, and it can be a valuable tool in your trading strategy.
Martingale Forex EA is effective, but the 100% winning rate claim should be taken with caution. It’s a valuable tool, but like any strategy, it requires careful consideration and risk management.
Martingale Forex EA is a powerful tool for serious traders. The 100% winning rate is not an exaggeration. It adapts well to market conditions, making it a valuable addition to any trading strategy.