Support and Resistance Fractals – Indicator for MT4
$0.00
4xPip Support and Resistance Fractals Indicator is a powerful tool based on the support and resistance levels developed through up fractal and down fractal. It indicates forex traders about projecting the price targets and buy sell signals.
Description
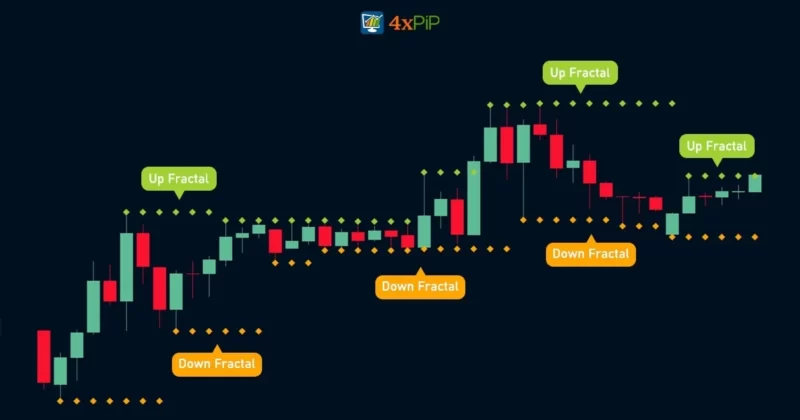
What are fractals? Fractals in forex trading are like special patterns that help traders spot potential changes in price direction. Imagine them as little markers on a price chart that show where the market might reverse or continue its trend.
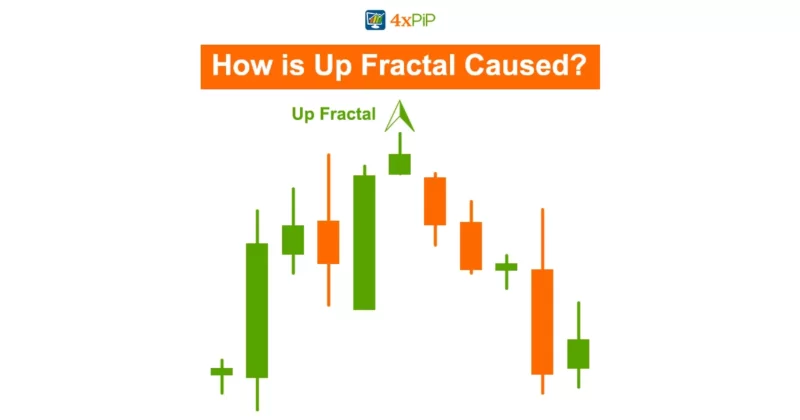
What are up fractals? Up fractals are like mountain peaks and suggest the possibility of a price going down soon.
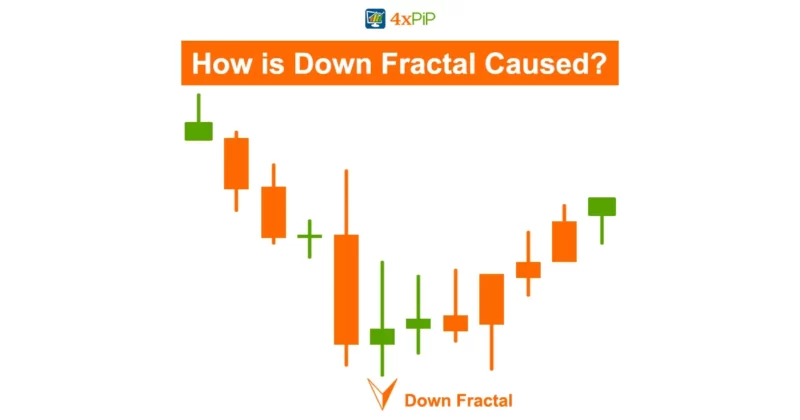
What are down fractals? On the other hand, down fractals are like valleys and indicate that prices might rise after reaching that point.
So, traders see fractal patterns to make informed decisions to buy/sell currencies, aiming to catch right moments for successful trades.
Using fractals in forex trading has some advantages. First, they help traders see where the money flow might change direction on a chart. Imagine them like little signs showing when prices could go up or down. This makes it simpler for both new and experienced traders to figure out important points on the chart. Fractals also make it easier to make trading plans and strategies because they show patterns in a clear way. With these patterns, traders can decide the best times to buy or sell, making their trading decisions more accurate. So, fractals are like helpful guides for traders to find the right moments to make money in the forex market.
Formulas:
Up Fractal=
High(N) > High(N−2) and High(N) > High(N−1) and High(N) > High(N+1) and High(N) > High(N+2)
Down Fractal=
Low(N) < Low(N−2) and Low(N) < Low(N−1) and Low(N) < Low(N+1) and Low(N) < Low(N+2)
How to Trade with Support and Resistance Fractals Indicator?
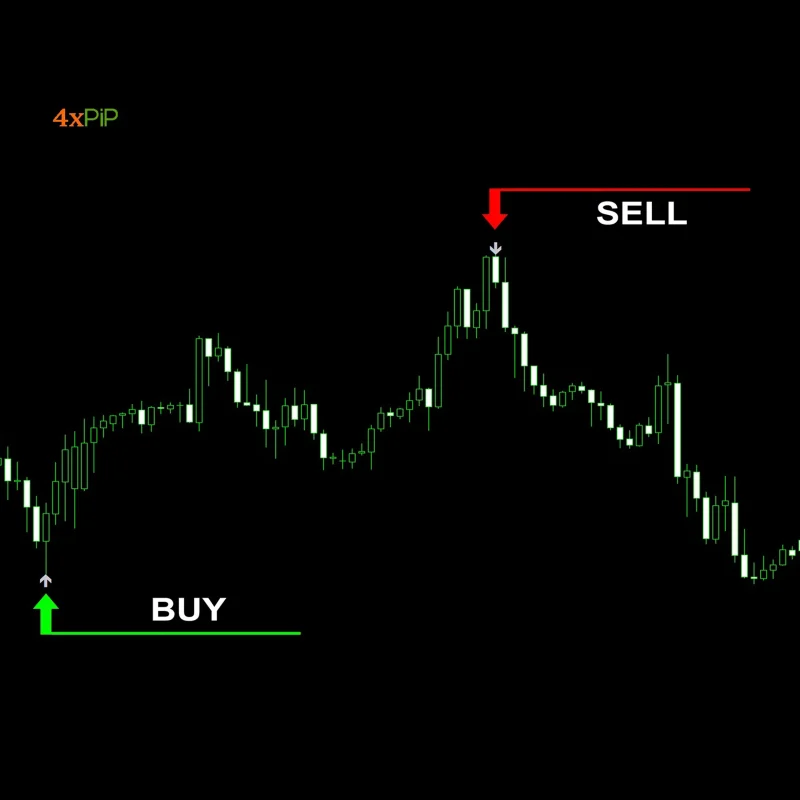
For better results, open a sell trade when the previous resistance level rejects the price. Its takeprofit will be at the support line. The sell trade will close when the price will touch the support line. The Stoploss of sell trade will be according to the risk-to-reward ratio.
For opening a buy trade, always open it when the previous support level rejects the price. Its takeprofit will be at the resistance line. The buy trade will close when the price touches the resistance line. The Stoploss of buy trade will also be according to the risk-to-reward ratio.
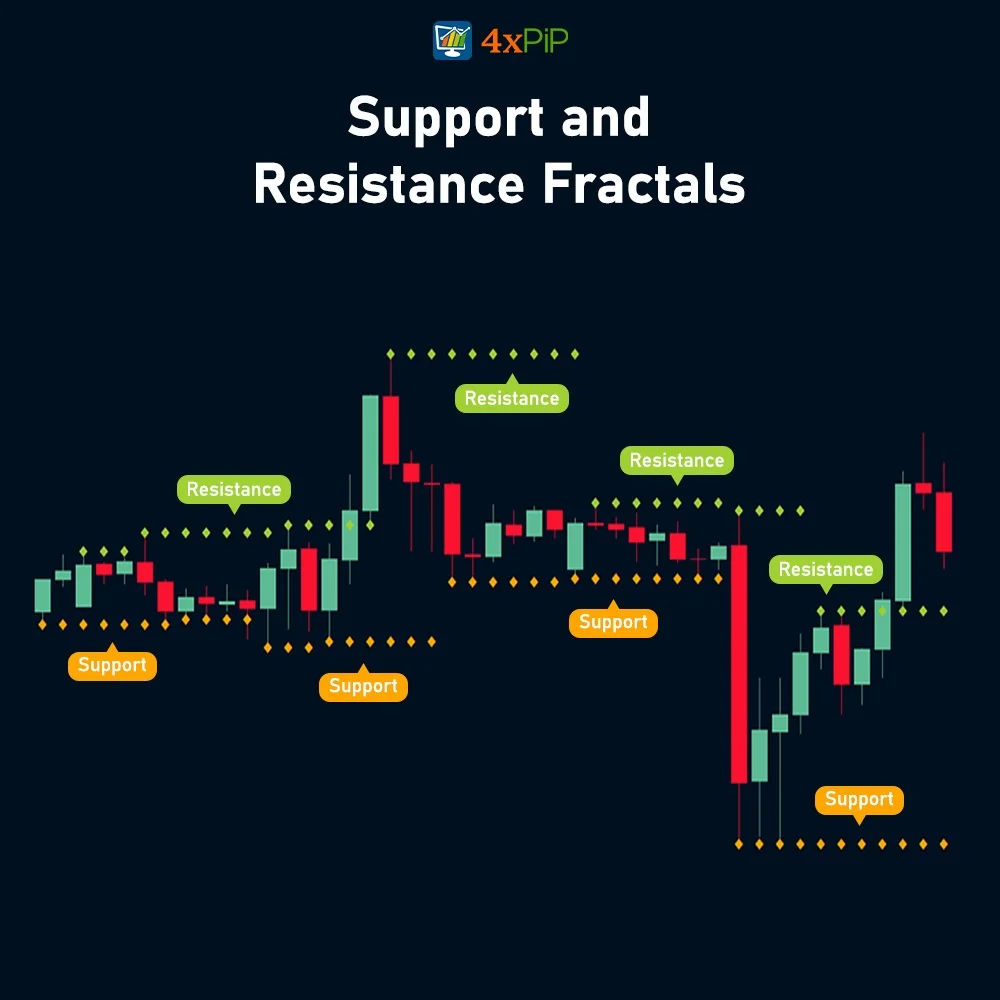
The Support and Resistance indicator operates by utilizing the information derived from the Fractals indicator. It functions to identify key levels in the market where prices have historically shown a tendency to either bounce back (support) or face resistance. In this context, support levels are determined by locating the lows of down fractals, which signify areas where the price has previously reversed its downward movement. Conversely, resistance levels are identified at the highs of up fractals, indicating points where the price has historically encountered barriers to further upward movement. Traders use these support and resistance levels as critical reference points, helping them make decisions on when to enter or exit trades, as well as to gauge potential price movements in the market.
Features:
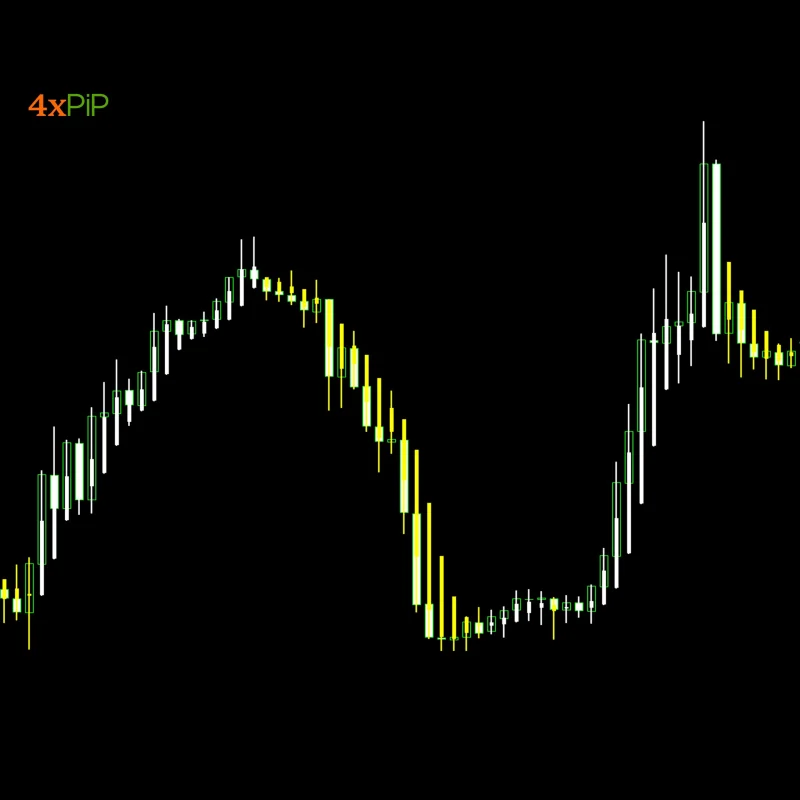
The Support and Resistance indicator displays support and resistance levels based on the Fractals indicator. Support levels are plotted at the lows of down fractals, while resistance levels are plotted at the highs of up fractals. This support and Resistance Indicator has been formed According to the concept of Fractals
The support & resistance levels are being drawn at up-down Fractals.
- Fractal-based Analysis: The tool relies on up and down fractals to identify key points in the market.
- Resistance Levels: Utilizes up fractals(peaks) to mark levels where price has historically faced resistance, helping traders gauge potential upper limits.
- Support Levels: Utilizes down fractals (valleys) to identify support levels, indicating historical points where price has bounced back from decline.
- Visual Reference Points: It provides clear visual markers on price chart, making it easy for traders to identify crucial levels.
- Decision Support: Helps traders make informed decisions on when to enter or exit trades based on historical price behavior around fractal-derived support and resistance levels.
- Enhanced Strategy Planning: Incorporating fractal-based support and resistance levels enhances the effectiveness of trading strategies in navigating market dynamics.
- Dynamic Market Insight: Offers insights into potential areas of price reversal/continuation, aiding traders in adapting to changing market conditions.
- User-friendly Interface: Provides a user-friendly interface that simplifies the process of interpreting and applying fractal-based support and resistance levels for traders of varying experience levels.
- Trade opening, SL/TP: You can easily open trade by; either buy/sell as well as set Stoploss/Takeprofit according to your preferences.
Conclusion
In conclusion, 4xPip Support and Resistance Fractals Indicator for MT4 emerges as powerful tool for forex traders seeking a comprehensive approach to market analysis. By leveraging the concept of fractals, which serve as visual markers indicating potential shifts in price direction, this indicator facilitates a nuanced understanding of crucial support and resistance levels. The user-friendly interface and clear visual reference points make Support and Resistance Fractals Indicator accessible for traders of varying experience levels.
With a focus on dynamic market insight and enhanced strategy planning, MT4 Support and Resistance Fractals Indicator equips traders with the necessary information to make informed decisions, whether entering or exiting trades. By combining the strengths of fractal-based analysis with resistance and support level identification, the indicator offers a holistic approach to navigating the complexities of the forex market. Ultimately, Support and Resistance Fractals serves as a valuable ally for traders seeking precision and effectiveness in their trading strategies.
DOWNLOAD NOW Reach Us on WhatsApp
 Fly Over to Telegram
 Drop Us an Email
21 reviews for Support and Resistance Fractals – Indicator for MT4
| 5 star | 57% | |
| 4 star | 42% | |
| 3 star | 0% | |
| 2 star | 0% | |
| 1 star | 0% |
Q & A
The risk-to-reward ratio is a key factor in setting stop loss and take profit levels. It ensures that potential losses are controlled and proportional to potential gains. Traders calculate this ratio based on their risk tolerance and profit objectives when using the Support and Resistance Indicator.
In buy trades, it is advisable to initiate a position when the price is rejected at the previous support level. Set the take profit at the resistance line, and close the buy trade when the price touches the resistance line, aligning the stop loss with the risk-to-reward ratio.
The Support and Resistance Indicator utilizes support levels at the lows of down fractals and resistance levels at the highs of up fractals. These levels are crucial reference points for traders, guiding them in making decisions on when to enter or exit trades.
Up fractals, or peaks, suggest potential price decreases, while down fractals, or valleys, indicate potential price increases. Traders use these patterns to make informed decisions about when to buy or sell currencies.
Related products
-
 Free
FreeMT4 Quantum Pro Indicator
$0.00 Select options -
 Free
FreeMT4 Heiken Ashi Indicator
$0.00 Select options -
 Premium
Best Martingale Strategy Forex EA MT4 | Grid Trading
Original price was: $199.00.$99.00Current price is: $99.00. Select options -
 Premium
MT4 BreakEven EA
Original price was: $99.00.$10.00Current price is: $10.00. Select options
Powerful tool based on the support and resistance levels developed through up fractal and down fractal. It indicates forex traders about projecting the price targets and buy sell signals.
Martingale EA has brought more consistency to my trades. It’s not without risks, but if used wisely, it can be a powerful tool in your trading journey. Thumbs up!
Martingale EA is a reliable performer. The counter trades have saved me from significant losses. Just remember, like any tool, it’s most effective when used judiciously.
Martingale Forex EA is a solid performer. I’ve seen a significant reduction in drawdown, and the counter trades have saved me on multiple occasions. Make sure to stay disciplined in your approach.
Martingale EA can be effective, but it’s not a one-size-fits-all solution. It requires careful risk management. The 100% winning rate claim should be taken with a grain of salt.