Stochastic Threads | Rainbow Stochastic Ribbon Multi lines indicator for MetaTrader 5 – FREE
$0.00
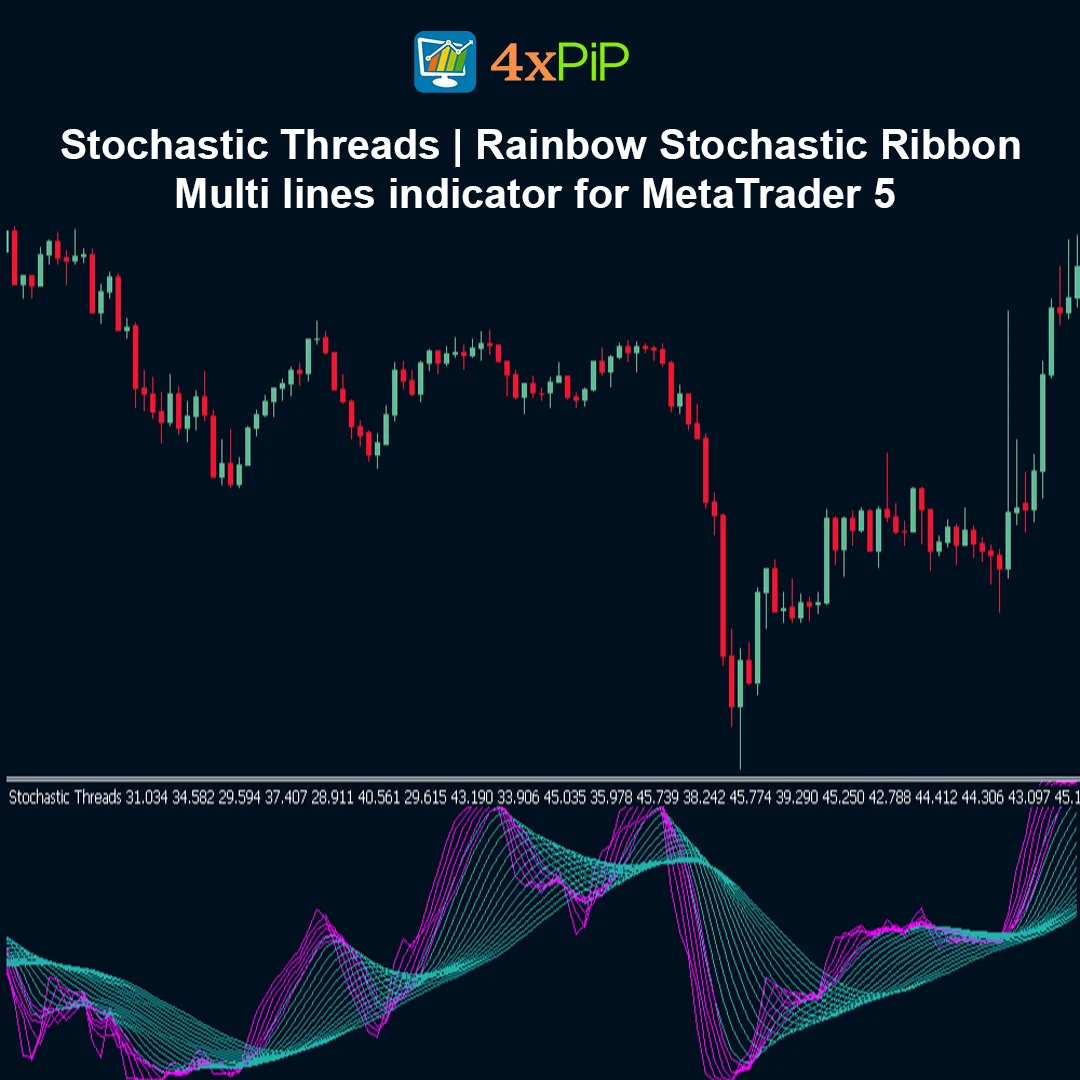
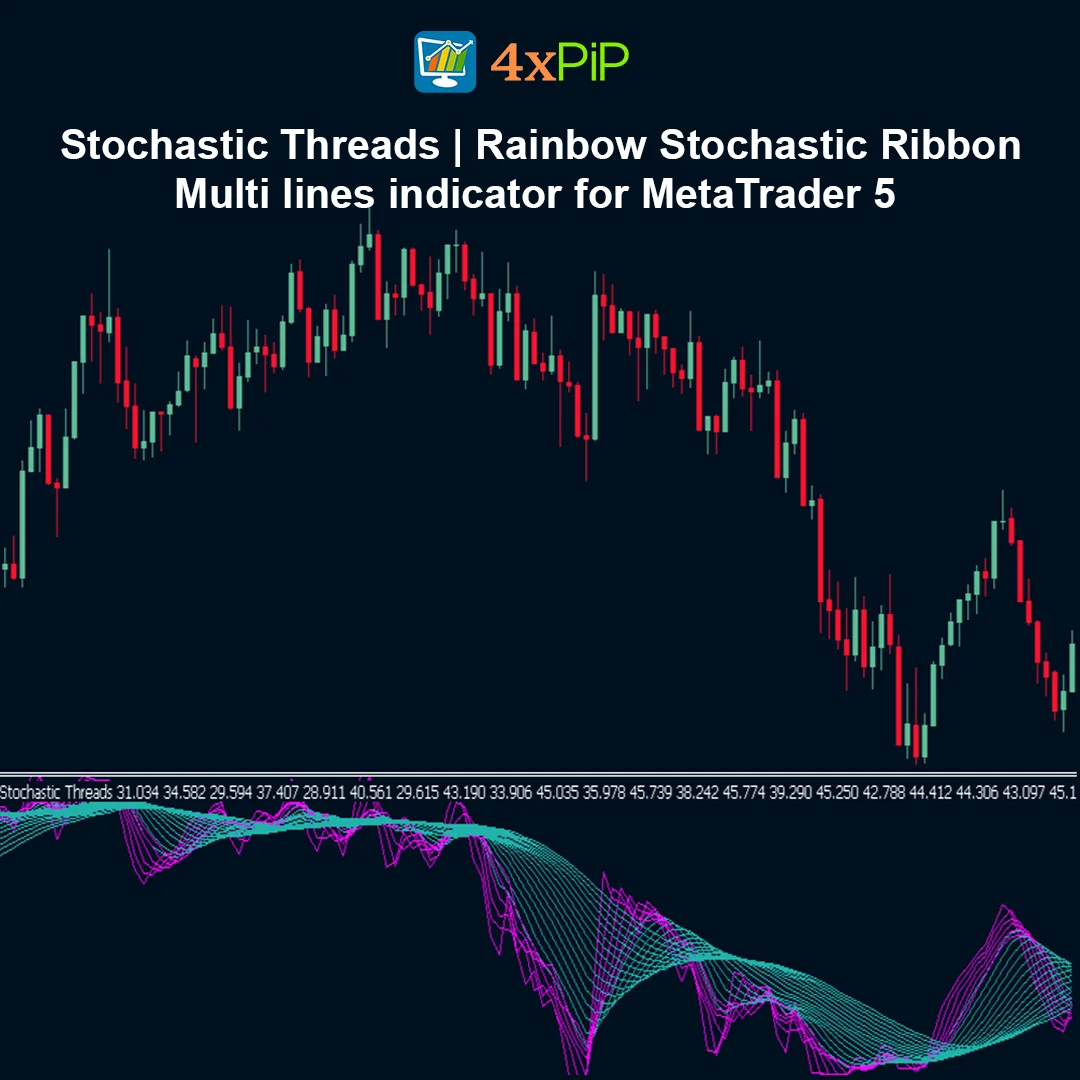
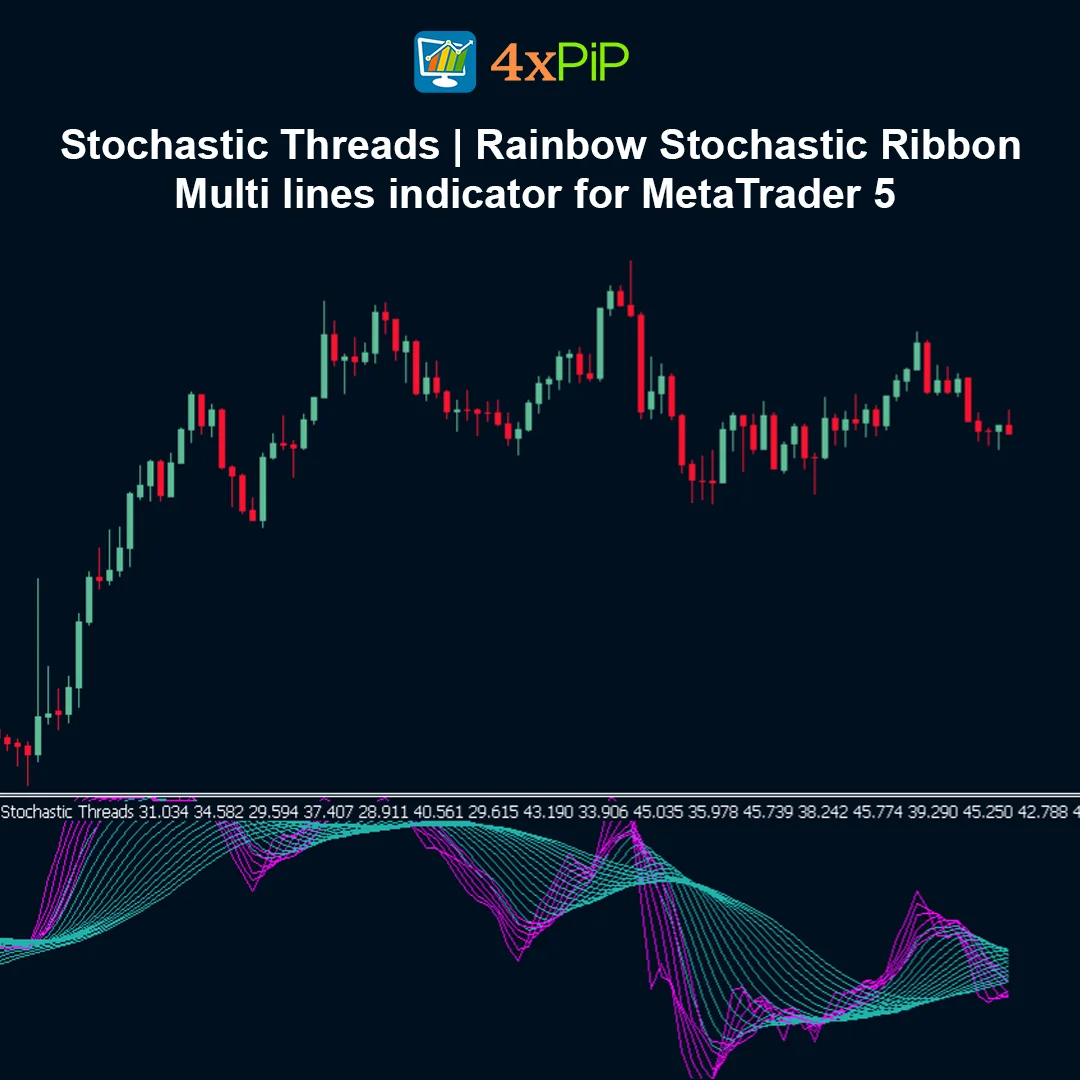
The Stochastic Threads indicator for MetaTrader 5, also known as the Rainbow Stochastic Ribbon, is an advanced momentum oscillator that displays multiple stochastic lines with different settings in a single indicator window. Instead of using one standard stochastic, it plots numerous %K lines with varying periods, creating a colorful ribbon-like visualization that helps traders identify trend strength, reversals, and market momentum shifts more clearly.
Description
What is the Stochastic Threads (Rainbow Stochastic Ribbon) indicator?
The Stochastic Threads indicator is an advanced oscillator designed to improve traditional stochastic analysis by plotting multiple stochastic %K lines simultaneously. Instead of relying on one set of parameters, this indicator uses several stochastic settings with different periods. These lines create a ribbon or rainbow effect in the indicator window, allowing traders to visualize how short-term and long-term momentum behave together. This layered approach provides a deeper understanding of market conditions and trend development.
How does the Rainbow Stochastic Ribbon help traders analyze trends?
The indicator helps traders understand market trends by showing how multiple stochastic lines align or diverge. When all the lines move closely together, the market is usually consolidating or ranging. When the lines spread apart and fan out, it indicates increasing momentum and the potential start of a new trend. This visual pattern helps traders recognize strong market direction and avoid trading during uncertain periods.
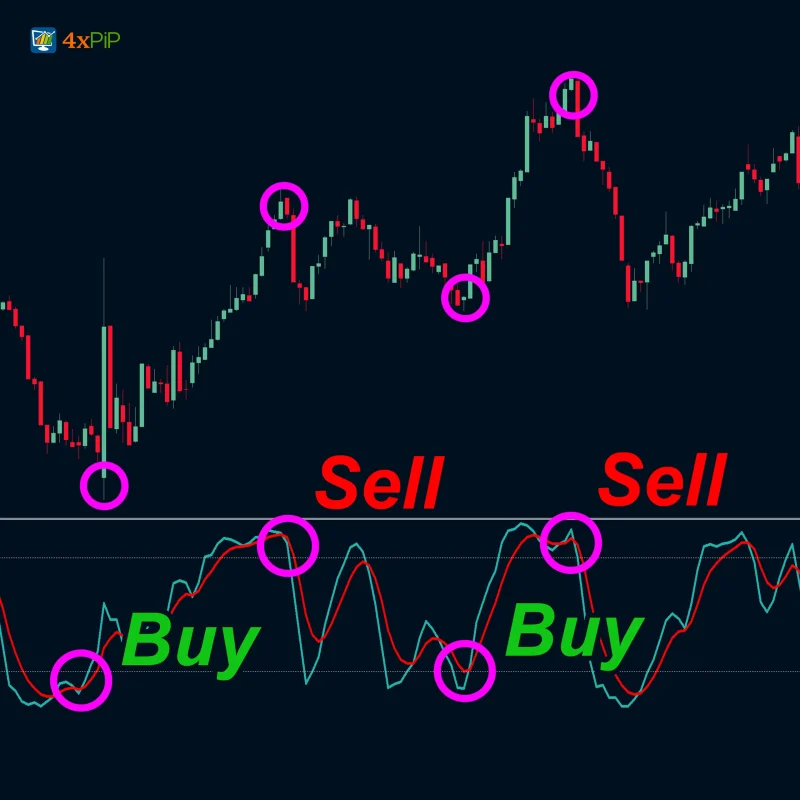
How does the indicator detect overbought and oversold conditions?
Like the traditional stochastic oscillator, the indicator uses the same momentum thresholds. When the stochastic lines move above the 80 level, the market is considered overbought, suggesting a possible downward correction. When they move below the 20 level, the market is considered oversold, indicating a potential upward reversal. However, the advantage of the rainbow ribbon is that traders can see how different stochastic periods react at the same time.
Why is the multi-line stochastic approach useful?
Using multiple stochastic lines allows traders to analyze momentum across different time sensitivities simultaneously. Short-period lines react quickly to price changes, while longer-period lines move more slowly and represent broader market trends. When both short and long lines align, the trading signal becomes stronger. This multi-layered analysis helps traders confirm trends, detect reversals earlier, and improve decision-making in volatile markets.
Advantages
- Displays multiple stochastic lines simultaneously.
- Helps identify trend strength and momentum shifts.
- Provides clearer visualization than a standard stochastic oscillator.
- Helps detect trend continuation and reversal zones.
- Improves analysis of overbought and oversold conditions.
- Useful for both trend-following and reversal strategies.
- Works on multiple timeframes.
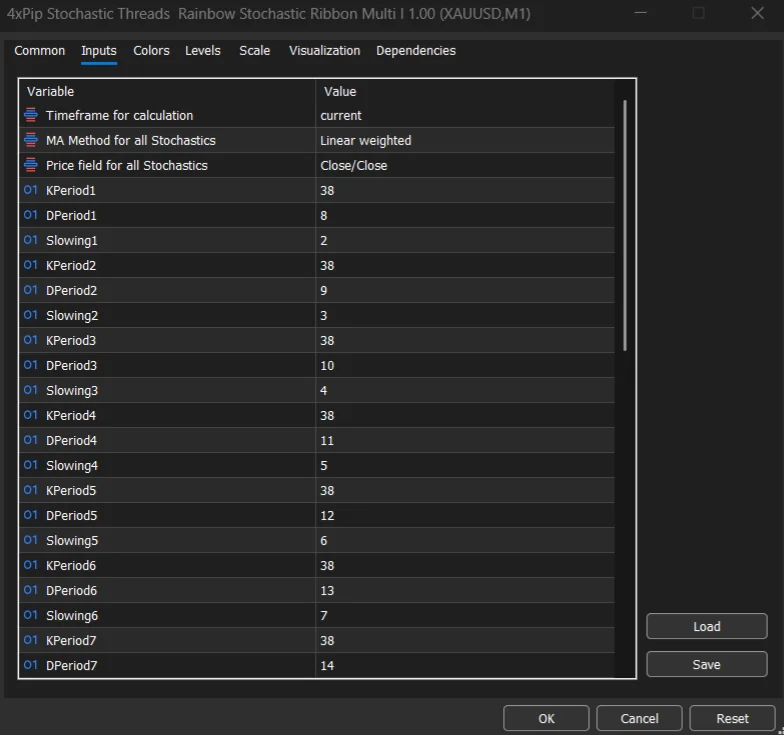
- Customizable settings for stochastic periods and colors.
- Helps traders understand short-term vs long-term momentum.
- Fully compatible with MetaTrader 5 trading platform.
Features
- Plots multiple stochastic %K lines in one indicator window.
- Creates a rainbow ribbon visualization for momentum analysis.
- Supports customizable stochastic periods.
- Shows overbought and oversold levels clearly.
- Helps identify trend strength and trend exhaustion.
- Displays fan-out patterns during strong trends.
- Detects cluster patterns during consolidation phases.
- Supports multi-timeframe market analysis.
- Adjustable color schemes for better chart readability.
- Lightweight and efficient indicator for MT5 charts.
How to Trade
Apply the indicator to your chart in MetaTrader 5.Watch for lines clustering together, indicating market consolidation.Look for lines fanning out upward as a potential bullish trend start.Look for lines fanning out downward as a potential bearish trend start.Monitor when lines cross above 80 for possible overbought signals.Monitor when lines fall below 20 for potential oversold signals.When the ribbon begins converging again, it may signal trend exhaustion or reversal.
Formula
The indicator is based on the Stochastic Oscillator formula:
%K = (Current Close − Lowest Low) / (Highest High − Lowest Low) × 100**
Where:
Lowest Low= lowest price during the selected period
Highest High = highest price during the selected period
The Stochastic Threads indicator calculates this formula using multiple period settings (for example: 6/3/3, 8/3/3, 10/3/3 up to 24/3/3), producing multiple lines that form the ribbon structure.
Conclusion
The Stochastic Threads (Rainbow Stochastic Ribbon) indicator for MetaTrader 5 offers a powerful enhancement to traditional stochastic analysis. By plotting multiple stochastic lines simultaneously, it provides traders with a clearer understanding of market momentum, trend strength, and potential reversal zones.
This visual ribbon approach allows traders to observe how short-term and long-term momentum interact, making it easier to identify strong trends and avoid weak market conditions. As a result, the indicator is a valuable tool for traders seeking deeper momentum insights across Forex, stocks, and cryptocurrency markets.
DOWNLOAD NOW Reach Us on WhatsApp
 Fly Over to Telegram
 Drop Us an Email
FAQ's
Q & A
Related products
-
 Premium
MT5 BreakEven EA
Original price was: $99.00.$10.00Current price is: $10.00. Select options -
 Free
FreeMT5 EA Stochastic
Original price was: $100.00.$20.00Current price is: $20.00. Select options -
 Premium
MT5 License System for Trading bots EA
Original price was: $199.00.$99.00Current price is: $99.00. Select options

Reviews
There are no reviews yet