Stoch RSI Indicator for MT4 (Stochastic RSI) – Download FREE
$0.00
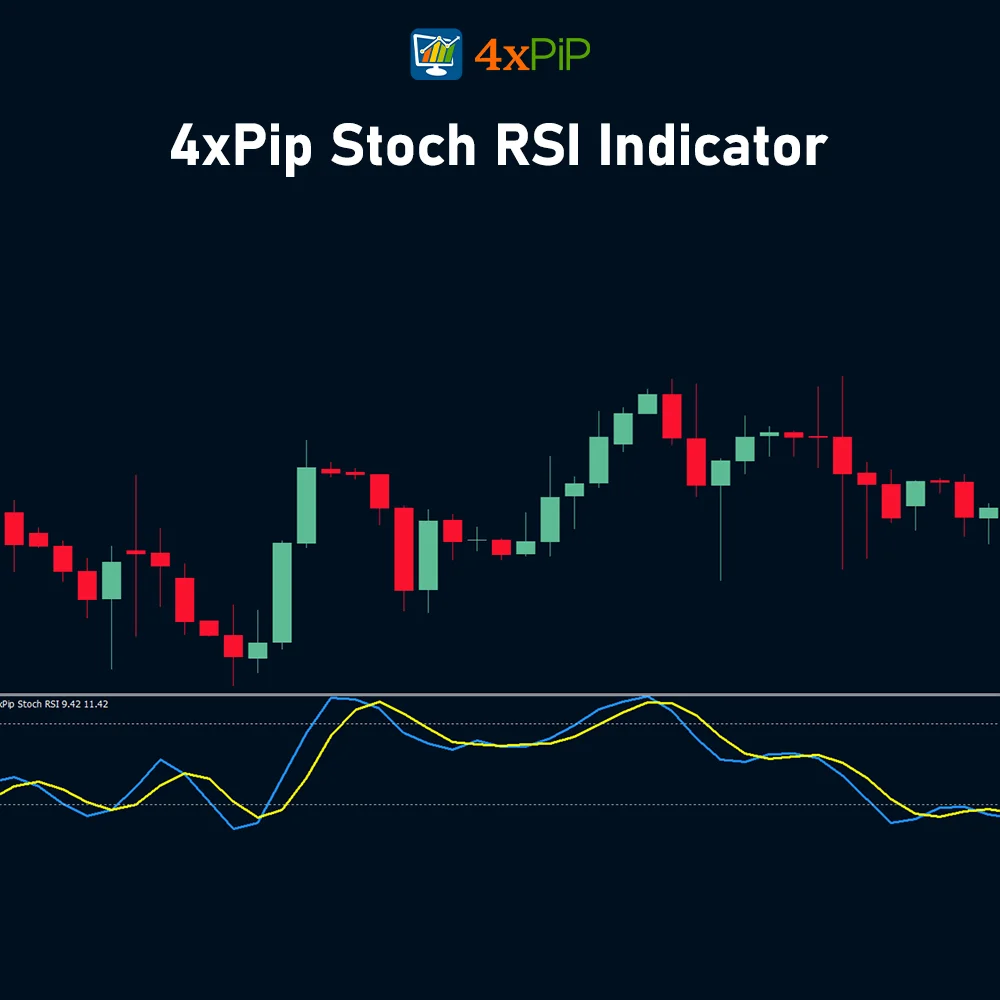
The Stoch RSI indicator, is a powerful technical analysis indicator that combines the elements of both the stochastic indicator and the relative strength index (RSI). This indicator is designed to offer a more detailed view of market conditions and trends. It has benefits of both indicators which makes this indicator twice as useful.
Description
The Stoch RSI indicator is a useful tool for analyzing the stock market. It combines elements from two popular indicators, the stochastic oscillator and the relative strength index (RSI). This hybrid indicator gives traders a detailed view of market conditions and trends. The stochastic part helps identify when a stock is overbought or oversold, giving insights into possible trend reversals. On the other hand, the RSI part measures the strength of a market’s price movements. Furthermore, by combining these indicators, the Stoch RSI aims to provide a more accurate picture of market dynamics. Moreover, the indicator usually has two lines that show the momentum and strength of a security’s price. Traders use this tool to make informed decisions, taking advantage of both stochastic and RSI indicators in a simple and easy to read format.
Benefits of Stochastic Indicator:
These following benefits of a stochastic indicator are also the benefits of Stoch RSI indicator.
Visualizing Trends: This tool shows market momentum and likely changes in a way that’s easy to see, making it simpler to understand than just looking at prices.
Confirming Signals: The Stochastic can confirm signals from other indicators, like RSI or MACD, giving you more confidence in your trading choices.
Early Alerts: It might not always be right, but this tool can sometimes warn you early about potential trend changes, so you can adjust your positions sooner.
Works Everywhere: Also, the Stochastic is useful for trading different things like stocks, forex, and commodities. It’s flexible and can be used in various trading plans.
Usage of Stochastic Indicator:
The Stochastic Indicator and Stoch RSI Indicator have following usage:
Overbought/Oversold Identification: Stochastic helps you know when an asset’s price is too high (overbought) or too low (oversold). This helps spot potential changes in price trends.
Detection of Divergence: Divergence happens when Stochastic moves opposite to the price, signaling a possible trend change. For instance, if the price goes up but Stochastic goes down, it might mean the price will drop.
Measurement of Momentum: Stochastic measures how strong and in which direction prices move. If Stochastic goes up, it shows upward momentum; if it goes down, it suggests downward momentum. This helps confirm trends and find chances to keep riding the momentum.
Customization: Lastly, you can change settings like period length and thresholds to match your trading style and the market. This way, Stochastic can be personalized for different assets and timeframes.
Benefits of RSI Indicator:
The following benefits of RSI indicator are also the benefits of Stochastic RSI indicator:
Change Settings: You can change the RSI period (usually set at 14 days) to match how you trade and the time you’re looking at. Shorter periods quickly react to price changes but might be more jumpy. Longer periods are smoother but react slower.
Simple Presentation: The RSI shows its data in a simple chart below the main price chart. This makes it straightforward to understand and compare with price movements.
Confirmation: Like the Stochastic, the RSI can confirm signals from other indicators, like MACD or moving averages. This can boost your confidence in your trading decisions.
Flexibility: Also, the RSI is useful for different types of assets – stocks, forex, and commodities. It’s handy for various trading plans.
Usage of RSI Indicator:
The RSI indicator and Stoch RSI indicator have following usage:
Overbought/Oversold Identification: RSI helps spot if a stock is overbought (too expensive) or oversold (too cheap). Above 70 means it might be too expensive, and below 30 means it might be a good deal.
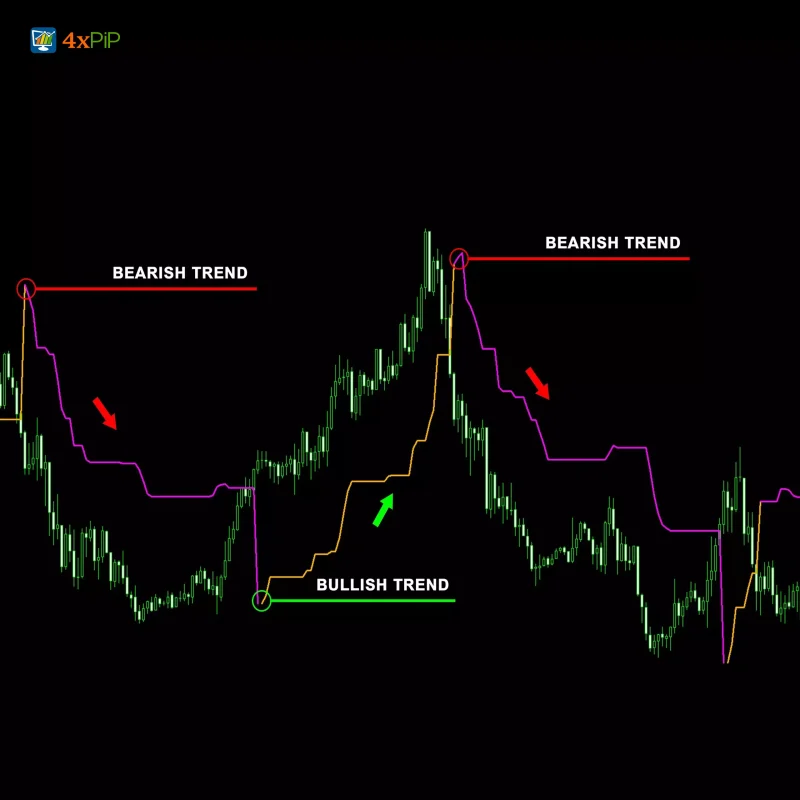
Trend Identification: RSI can also show if a stock is on an upward or downward trend. If RSI goes up with prices, it’s an uptrend. If it goes down with prices, it’s a downtrend.
Divergence Detection: RSI can find divergences, which means RSI and price move in opposite ways. If the price falls but RSI rises, it might mean an upcoming uptrend. If the price rises but RSI falls, it might mean a coming downtrend.
Momentum Measurement: RSI’s slope and speed tell us about the momentum of a stock. A steep rise means strong upward momentum, while a steep fall means strong downward momentum.
Formula:
%K = (Closing price at the current moment – Local minimum for the selected period) / (Local maximum for the selected period – Local minimum for the same time interval) *100
How to Trade with Stoch RSI Indicator?
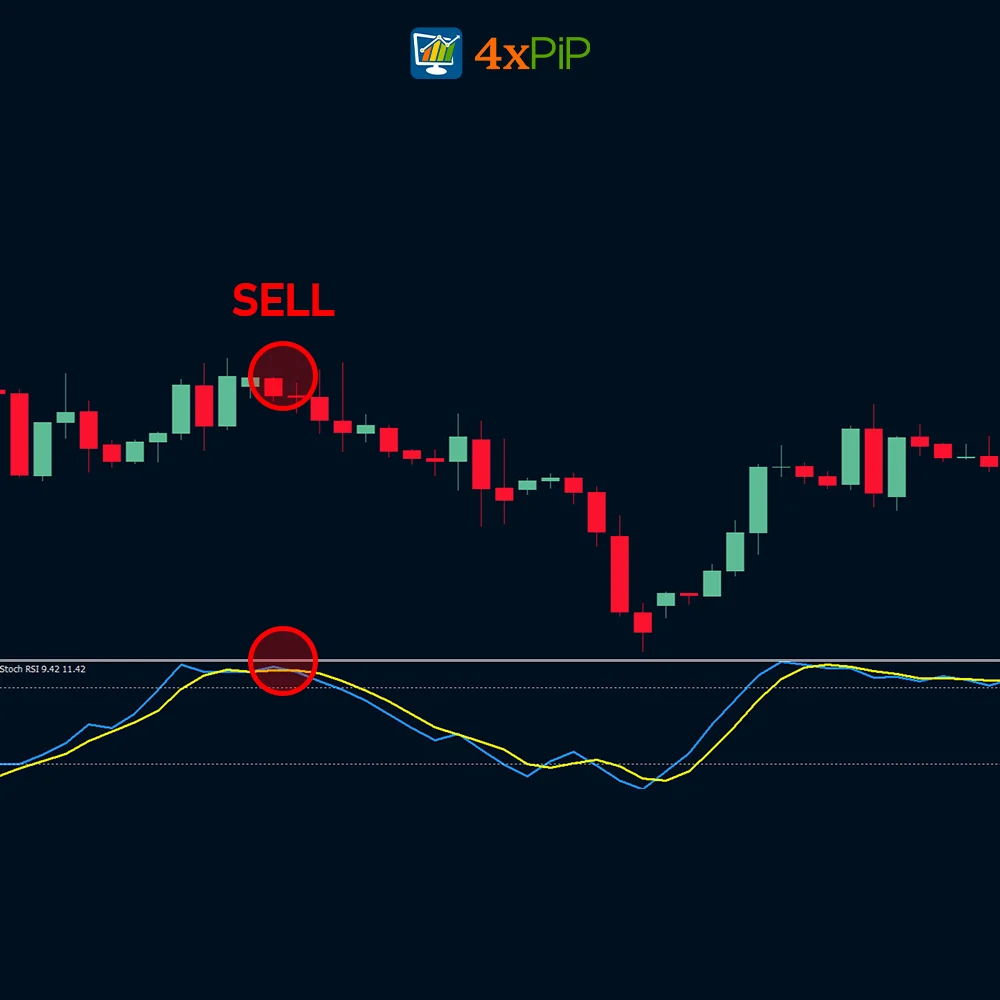
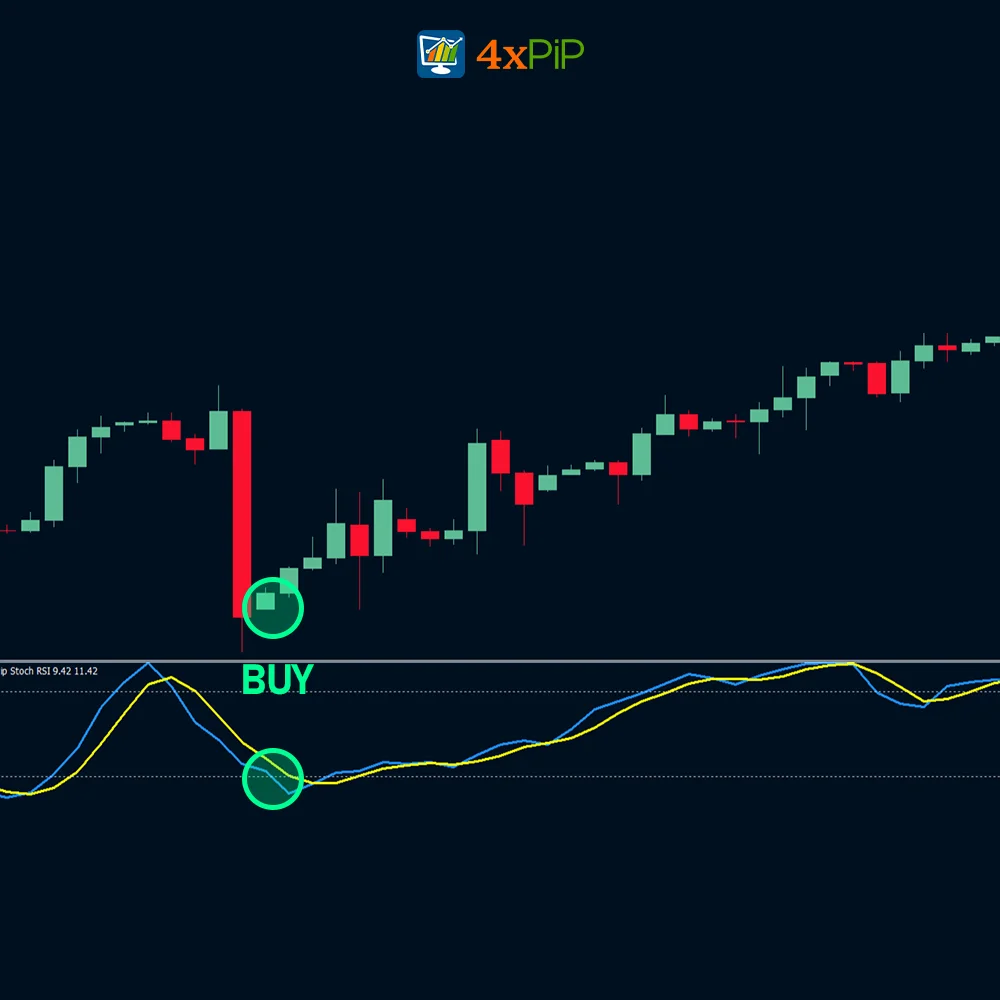
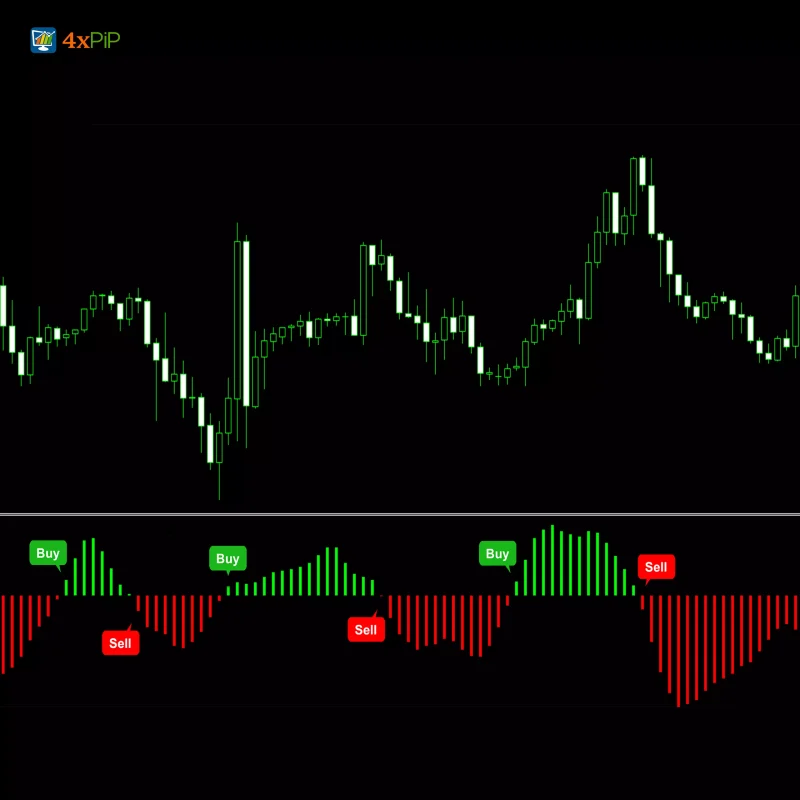
To start, make sure the indicator is installed on your MT4 platform and customize the parameters based on your preferences, including period length and overbought and oversold levels. The overbought condition is, when the indicator surpasses a threshold like 80, and identify oversold conditions when the lines drop below. Make the most out of Stochastic and RSI by confirming signals through alignment between their components. For instance, a more accurate buy signal may emerge when both indicators show oversold conditions. Use Price Action Analysis to confirm Stoch RSI signals, including broader market trends, trendlines, chart patterns, or support and resistance levels. Optimize when to enter and exit trades by looking at how prices move compared to indicator lines. Exit trades when indicators show that the market is likely to reverse from being too high or too low. Use risk management strategies like setting stop loss and take profit levels.
Features:
Stoch RSI indicator is the combination of both the stochastic indicator and relative strength indicator. So, it has the properties of both of these indicators. Here are some features of the Stoch RSI indicator:
- Combines Strengths of Stochastic and RSI: It merges the responsiveness of the Stochastic with the trend-identifying power of the RSI, offering a more comprehensive view of market momentum and overbought/oversold conditions.
- Overbought/Oversold Identification: Compared to individual indicators, it offers a refined overbought/oversold analysis by capturing both short-term price movements and longer-term trends.
- Improved Divergence Detection: By combining both indicators, it provides potentially clearer and more reliable divergence signals, potentially indicating upcoming trend reversals with greater accuracy.
- Momentum Confirmation: It helps confirm existing momentum readings from the Stochastic and RSI, enhancing your confidence in trend continuation or reversal predictions.
- Customizable Parameters: You can adjust the RSI period, Stochastic period, and overbought/oversold thresholds to tailor the indicator to your specific trading style and market conditions.
- Visual Clarity: Similar to the RSI, it presents its readings on a separate chart, offering a clear visual representation for easy interpretation alongside price movements.
- Changeable: Like its individual components, it can be applied to various asset classes like stocks, forex, and commodities, making it a versatile tool across different markets.
- Early Warning: While not guaranteed, it can sometimes provide earlier warnings of potential trend changes or momentum shifts compared to using the Stochastic or RSI alone.
Conclusion
Stoch RSI indicator, a combination of stochastic and relative strength index (RSI), offering detailed insights into market conditions and trends. Using the strengths of both indicators, this indicator provides an in-depth analysis, helping in overbought/oversold identification, divergence detection, and momentum measurement across various assets. Moreover, you can customize parameters to align with your trading style and optimize entries and exits.
DOWNLOAD NOW Reach Us on WhatsApp
 Fly Over to Telegram
 Drop Us an Email
Settings
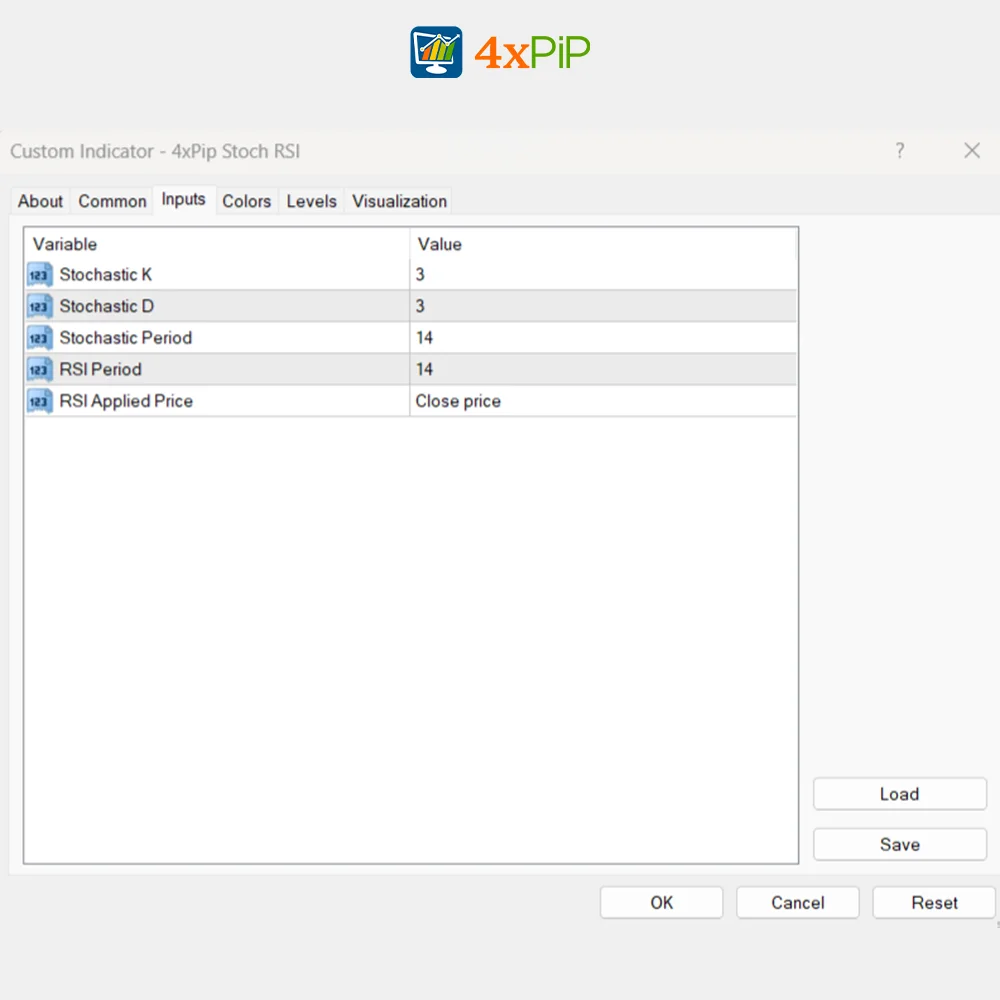
- Stochastic K (value = 3)
- Stochastic D (value = 3)
- Stochastic Period (value = 11)
- RSI Period (value = 14)
- RSI Applied Price (value = Close price)
41 reviews for Stoch RSI Indicator for MT4 (Stochastic RSI) – Download FREE
| 5 star | 53% | |
| 4 star | 46% | |
| 3 star | 0% | |
| 2 star | 0% | |
| 1 star | 0% |
Q & A
It confirms signals from other indicators like MACD or moving averages, providing traders with more confidence in their trading decisions.
Yes, it can help identify trends by observing the alignment of RSI with price movements, indicating upward or downward trends.
You can use it alongside price action analysis, confirm signals through alignment with other indicators, and employ risk management strategies.
While not guaranteed, it can sometimes offer earlier warnings compared to using the stochastic or RSI alone.
It offers a refined analysis by combining the strengths of both indicators, providing potentially clearer divergence signals and enhanced momentum confirmation.

Martingale EA has brought more consistency to my trades. It’s not without risks, but if used wisely, it can be a powerful tool in your trading journey. Thumbs up!
Downloaded Martingale Forex EA, and my trading has never been better. The EA’s ability to identify optimal entry points is remarkable. It’s a must-have for serious traders.
Martingale Forex EA is a true winner. The 100% winning rate is backed by solid performance. It adapts well to market changes, and the counter trades are a lifesaver. Highly recommended.
Martingale Forex EA is effective, but don’t let the 100% winning rate claim lull you into complacency. It’s a tool, not a guarantee. Use it wisely, and it can enhance your trading.
Martingale Forex EA is a well-designed robot. The intelligent forex calculator is a standout feature. While it’s not a guaranteed win every time, it significantly improves your overall trading experience.