Multi color Stochastic Red Green Grey for MetaTrader 4 FREE download
$0.00
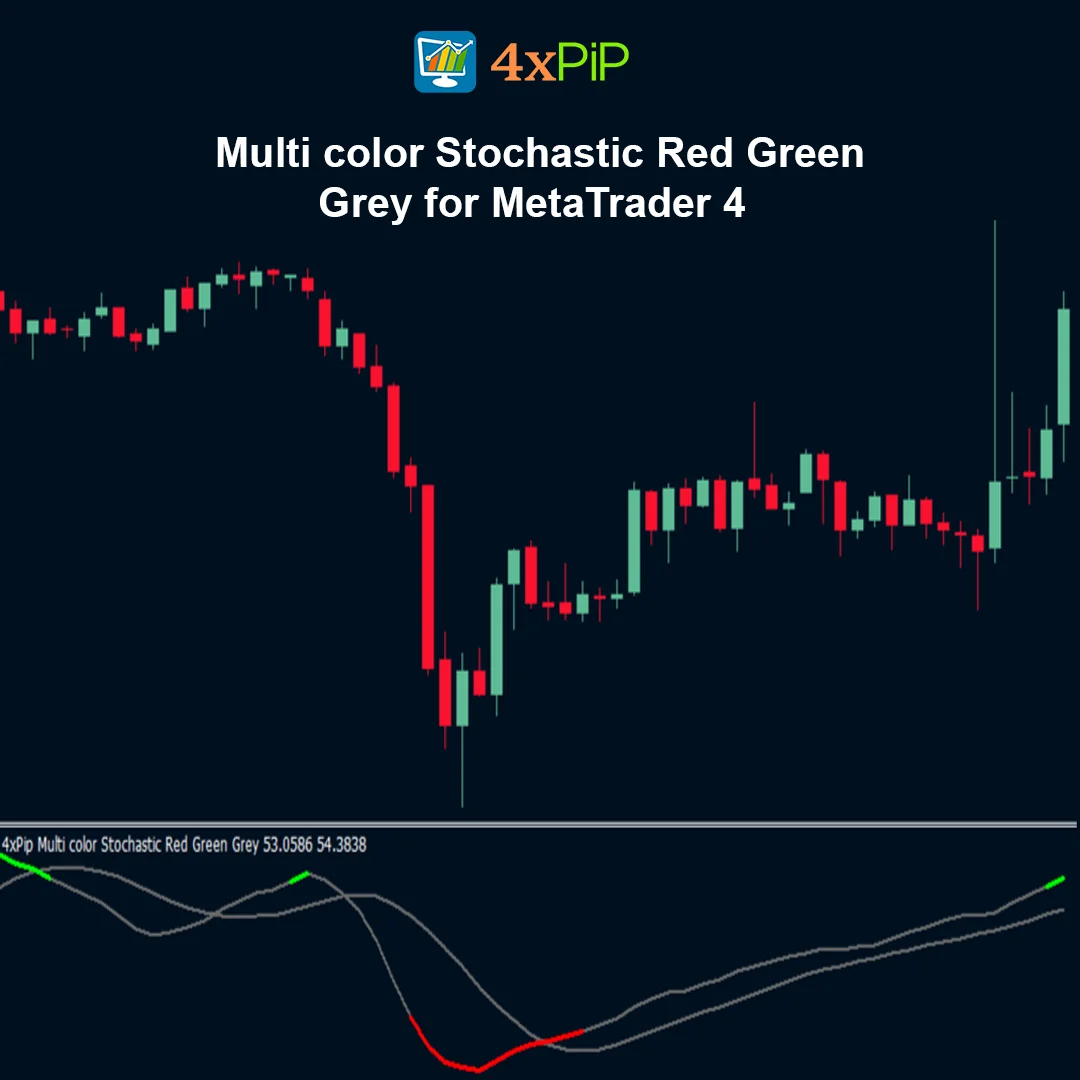
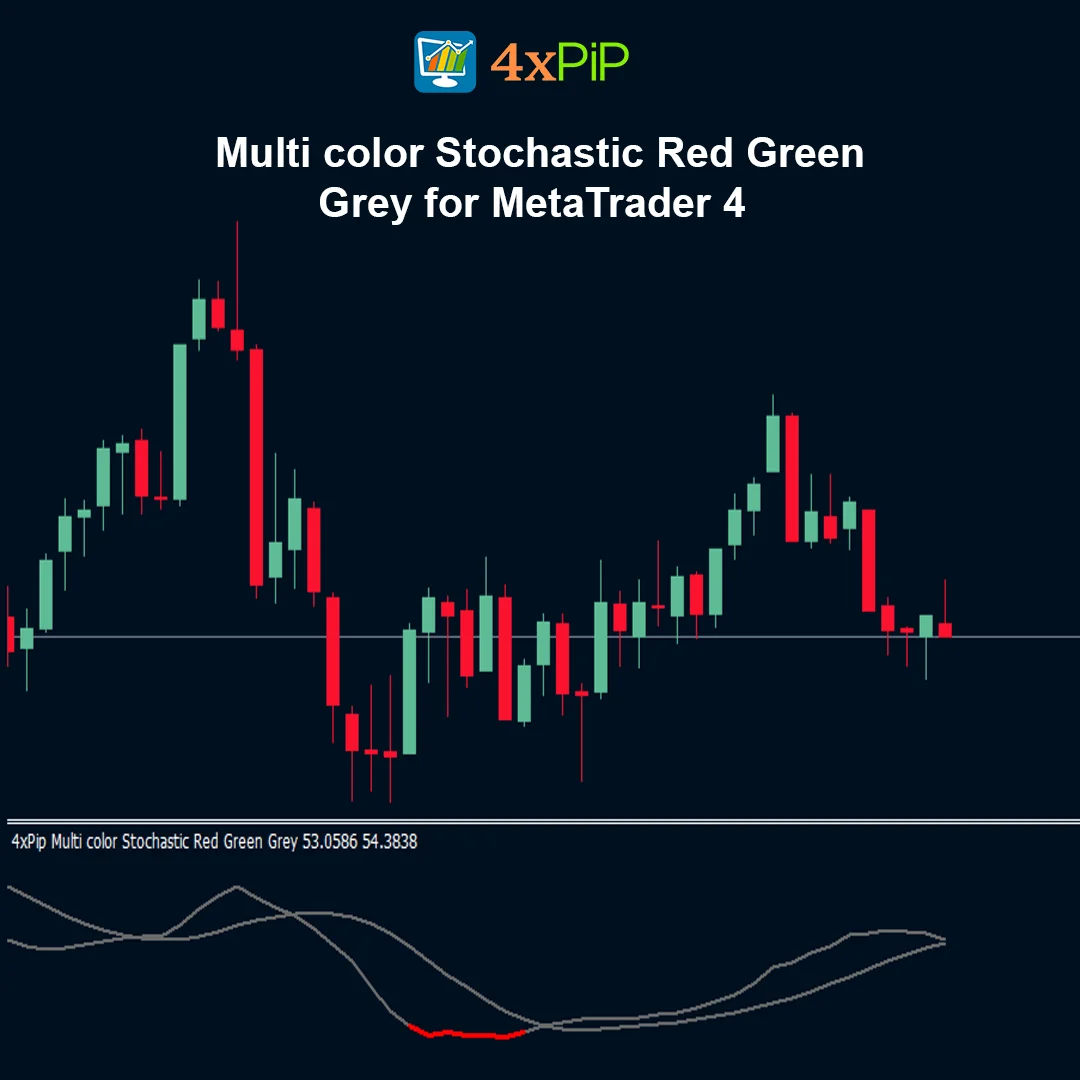
The Multi Color Stochastic Red Green Grey indicator for MetaTrader 4 is a momentum oscillator that visually highlights overbought and oversold market conditions using color changes. Based on the classic Stochastic Oscillator, the indicator changes line colors depending on the market state—green for overbought conditions, red for oversold conditions, and grey for neutral zones. This visual approach helps traders quickly identify trend strength, reversals, and momentum shifts directly on the chart.
Description
What is the Multi Color Stochastic indicator?
The Multi Color Stochastic Red Green Grey indicator is an enhanced version of the traditional stochastic oscillator. Instead of displaying a simple line that traders must interpret manually, this indicator uses color changes to clearly highlight different momentum conditions in the market. When the stochastic reading rises above a specific threshold, the line turns green, indicating strong bullish momentum. When it falls below another threshold, the line turns red, signaling oversold conditions and possible bullish reversal opportunities.
How does the indicator show overbought and oversold zones?
The indicator follows the standard stochastic oscillator logic. When the stochastic value rises above the 80 level, the market is considered overbought and the line turns green. This suggests that the market is in a strong upward trend but may soon face a correction or reversal. When the stochastic value falls below 20, the market is considered oversold and the line turns red, indicating that selling pressure may be exhausted and a potential upward movement could occur.
Why is the color-coded system helpful for traders?
The color-coded design allows traders to quickly identify important momentum conditions without analyzing numerical values. Instead of constantly checking the indicator scale, traders can simply look at the color of the line to understand whether the market is trending upward, downward, or moving sideways. This simplified visualization makes it easier to identify trading opportunities and manage positions efficiently.
How can traders use this indicator for reversal signals?
Traders often use the indicator to anticipate potential market reversals when the stochastic line remains in overbought or oversold zones for an extended period. For example, when the line stays green above the 80 level, the market may still be trending upward, but traders should watch for reversal patterns such as double tops or head-and-shoulders formations. Similarly, when the line remains red below the 20 level, the market may be preparing for a bullish reversal once buying pressure begins to return.
Advantages
- Uses color-coded signals for easier interpretation.
- Helps identify overbought and oversold conditions instantly.
- Simplifies momentum analysis for traders.
- Useful for trend-following and reversal strategies.
- Provides clear visual signals on MT4 charts.
- Works across multiple trading timeframes.
- Suitable for Forex, stocks, and crypto markets.
- Helps detect potential trend reversals.
- Lightweight indicator with fast calculation.
- Fully compatible with MetaTrader 4 platform.
Features
- Color-changing stochastic line (Green, Red, Grey).
- Highlights overbought (>80) and oversold (<20) zones.
- Easy visual identification of trend conditions.
- Based on the classic stochastic oscillator formula.
- Works in a separate indicator window.
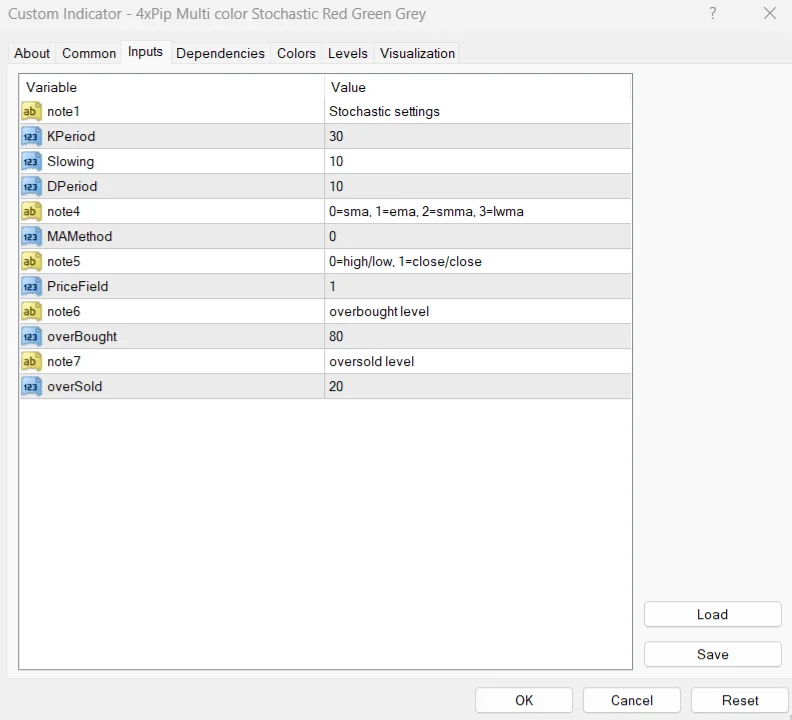
- Customizable indicator parameters.
- Helps identify momentum shifts.
- Supports multi-timeframe trading analysis.
- Compatible with most trading strategies.
- Lightweight and easy to install on MT4.
How to Trade
- Apply the indicator to your chart in MetaTrader 4.
- Watch when the stochastic line turns green, indicating overbought conditions and a strong uptrend.
- Monitor when the line turns red, indicating oversold conditions and possible bullish reversals.
- Grey color usually indicates neutral momentum or ranging market conditions.
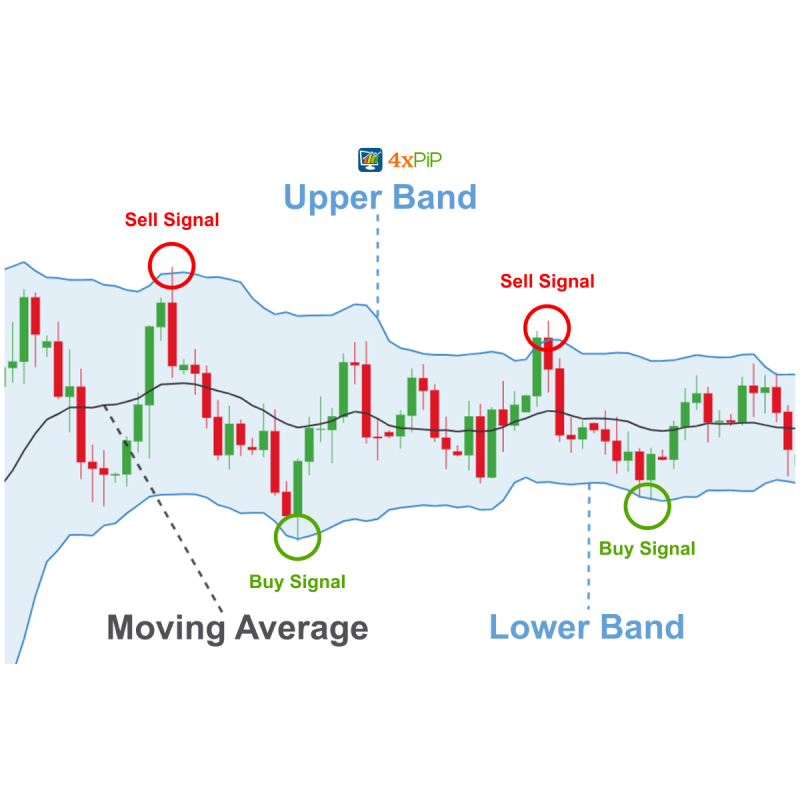
- Combine signals with price action patterns for confirmation.
- Look for reversal patterns such as double tops, failure swings, or head-and-shoulders formations before entering trades.
Formula
The indicator uses the standard stochastic oscillator formula:
%K = (Current Close − Lowest Low) / (Highest High − Lowest Low) × 100**
Where:
Lowest Low = lowest price during the selected period
Highest High = highest price during the selected period
The Multi Color Stochastic indicator simply adds color conditions to the stochastic values:
Above 80 → Green (Overbought)
Below 20 → Red (Oversold)
Between 20–80 → Grey (Neutral zone)
Conclusion
The Multi Color Stochastic Red Green Grey indicator for MetaTrader 4 is a simple yet powerful enhancement of the traditional stochastic oscillator. By introducing color-coded momentum signals, it allows traders to quickly identify overbought and oversold conditions without complex analysis.
This visual approach makes it easier to detect trends, anticipate reversals, and improve decision-making in fast-moving markets such as Forex, stocks, and cryptocurrencies.
DOWNLOAD NOW Reach Us on WhatsApp
 Fly Over to Telegram
 Drop Us an Email
FAQ's
Q & A
Related products
-
 Free
FreeMT4 MomPinboll Indicator
$0.00 Select options -
 Free
FreeMT4 EA Bollinger Band
Original price was: $100.00.$20.00Current price is: $20.00. Select options -
 Free
FreeMT4 Quantum Pro Indicator
$0.00 Select options -
 Premium
FOREX TRADE MANAGER MT4 EA
Original price was: $249.00.$49.00Current price is: $49.00. Select options
Reviews
There are no reviews yet