Double Bollinger Band Indicator for MetaTrader 5
$0.00
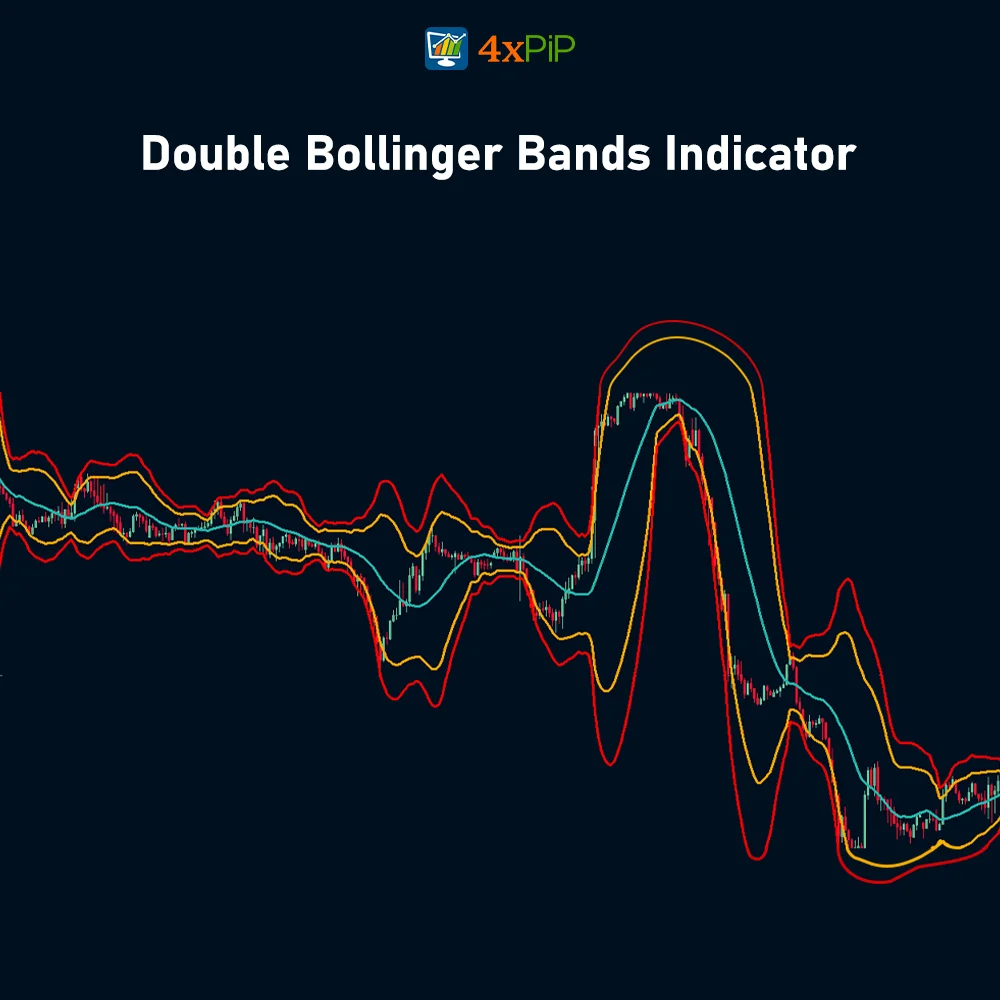
The Double Bollinger Band indicator is a technical analysis indicator built on the foundation of the regular Bollinger Bands indicator. It adds another layer to help in analyzing the volatility and momentum in the market.
Description
What is the Double Bollinger Band Indicator? The Double Bollinger Band is an indicator used in technical analysis to understand how volatile and dynamic the market is. Also, it’s an extension of the regular Bollinger Bands indicator. Instead of just one set of bands, it uses two sets based on different standard deviations (2σ and 3σ). Moreover, this creates three bands on a price chart, giving traders a clear view of market movement.
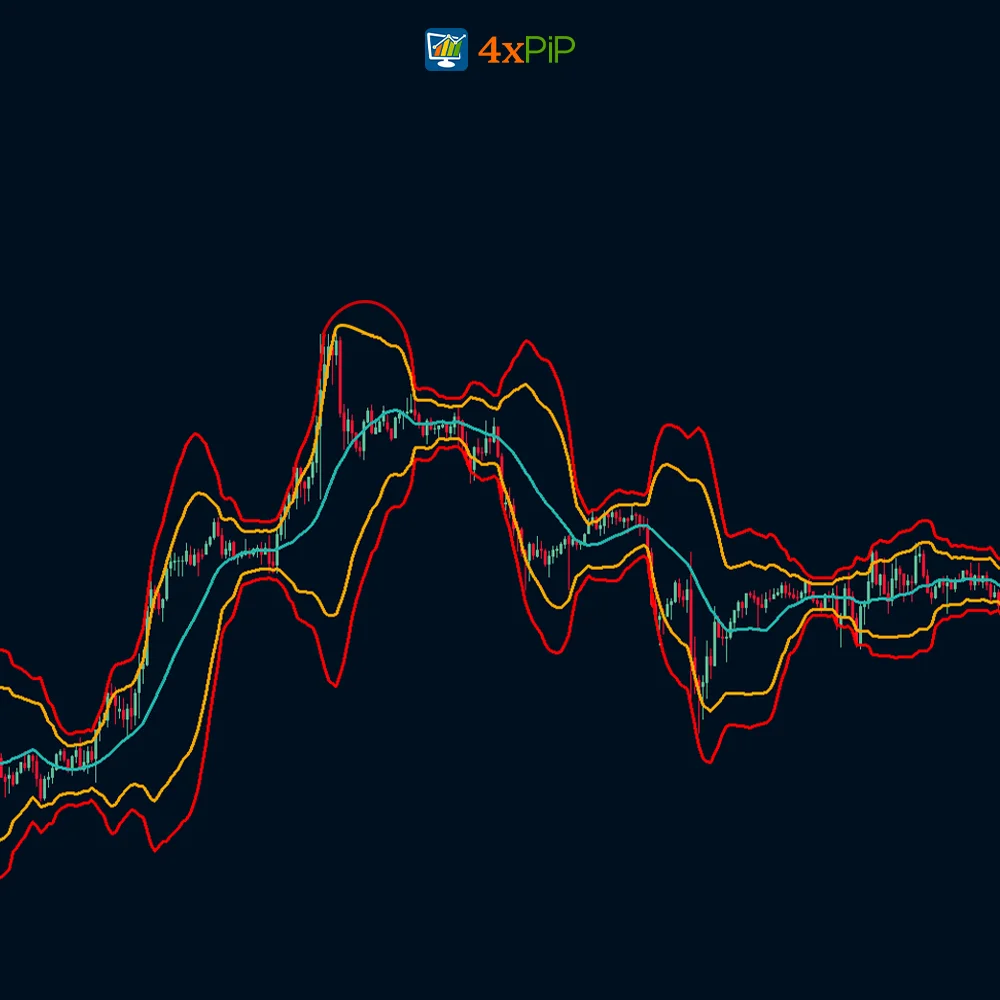
Like the regular Bollinger Bands, the Double Bollinger Bands show changes in volatility. When the bands are close together, it means low volatility, and when they spread out, it means high volatility. Furthermore, traders watch for price to break above or below these bands, which could indicate potential change in the market direction.
The middle band is important because it shows where the market is neutral or consolidating. Also, traders use the Double Bollinger Band to spot trends, figure out how strong they are, and decide when to enter or exit trades.
However, traders usually use it along with other methods to confirm their trades. Different trading platforms might have slightly different versions of the Double Bollinger Band. Some platforms include it by default, while others might need special setups.
Advantages of Double Bollinger Bands:
Double Bollinger Bands offer several advantages over regular Bollinger Bands for traders:
Enhanced Volatility Analysis: Double Bollinger Bands provide a more detailed view of volatility. By having two layers (typically 2σ and 3σ bands), traders can better check the intensity of price movements. Tighter inner bands with wider outer bands signal a potential change in volatility, which can foreshadow breakouts.
Improved Trend Strength Identification: The additional band helps distinguish strong trends from weaker ones. During established trends, price stays closer to one of the outer bands in Double Bollinger Band, indicating strong directional momentum.
Potential for Capturing Smaller Moves: Some Double Bollinger Band strategies use the inner band to capture smaller price movements within a trading range. This can be beneficial for traders seeking to make a profit on short-term fluctuations.
Filter False Signals: The double layer can act as a filter for breakouts or reversals. A price breaching the inner band might be a false signal if it hasn’t reached the outermost band, offering a chance to avoid impulsive trades.
Adaptability: Double Bollinger Bands can be applied to various market conditions, from ranging markets to trending ones. By adjusting parameters like the moving average length and standard deviation multipliers, traders can customize the indicator to suit their trading style and the market they’re analyzing.
Formula:
Upper band = 20-day SMA + (20-day SD x 2)
Also, Middle band = 20-day SMA.
Finally, Lower band = 20-day SMA – (20-day SD x 2)
How to Trade with Double Bollinger Bands?
The Double Bollinger Band Strategy uses two Bollinger Bands to decide when to enter and exit trades in the forex market. Furthermore, when the price touches or crosses the lower band of the Double Bollinger Bands and starts moving upwards, it’s a buying opportunity. On the other hand, if the price touches or crosses the upper band and starts moving downwards, it’s a selling opportunity.
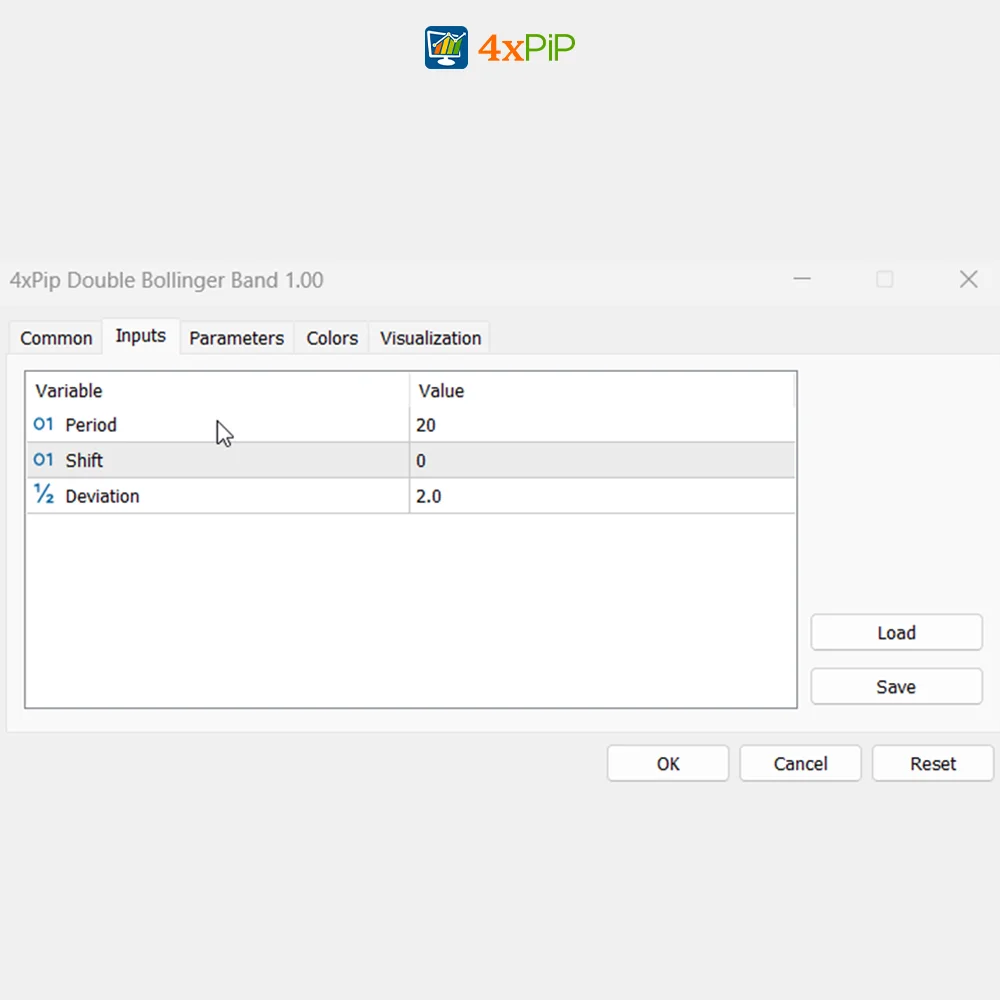
Default Parameters:
- 2 standard deviations Bollinger Bands (20,2): 20 simple moving averages with 2 standard deviations.
- 3 standard deviations Bollinger Bands (20,3): 20 simple moving averages with 3 standard deviations.
Long Entry:
Open a buy order when:
The Ask price goes above the 3σ upper Bollinger Band (BB3UP).
If the above condition is met, check if the current price is between the 2σ upper Bollinger Band (BB2UP) and 2σ lower Bollinger Band (BB2LO).
Sell Entry:
Open a sell order when:
The Bid price goes below the 3σ lower Bollinger Band (BB3LO).
If the above condition is met, check if the current price is between the 2σ lower Bollinger Band (BB2LO) and 2σ upper Bollinger Band (BB2UP).
Features:
Here are some features of Double Bollinger Bands (D Bollinger Bands):
- Dual Bands: Double Bollinger Bands consist of three bands created by two Bollinger Band calculations typically set at two (2σ) and three (3σ) standard deviations away from a moving average.
- Volatility Measure: Similar to Bollinger Bands, Double Bollinger Bands analyze volatility through the expansion and contraction of the bands. Tighter bands indicate lower volatility and wider bands suggest higher volatility.
- Breakout Identification: A price break above the upper band (usually the 3σ band) can signal a potential upside breakout, and vice versa for a downside breakout.
- Squeeze Recognition: When the bands compress (indicating low volatility), it might foreshadow a future breakout in either direction.
- Middle Band: Price action in the middle band suggests a consolidation phase or neutral zone.
- Trend Strength: Double Bollinger Bands helps in identifying trend direction and strength. During established trends, the price stays closer to one of the outer bands, indicating strong directional momentum.
- Potential for Short-Term Plays: Some Double Bollinger Band strategies use the inner band to capture smaller price movements within a trading range.
- Filter for False Signals: The double layer can act as a filter for breakouts or reversals. A price breaching the inner band might be a false signal if it hasn’t reached the outermost band, offering a chance to avoid impulsive trades.
Conclusion
The Double Bollinger Band indicator is an extension of the regular Bollinger Bands and offers traders a detailed view of market volatility and momentum. Moreover, integrating two sets of bands based on different standard deviations, provides enhanced insights into trend strength, potential breakouts, and opportunities to capture smaller price movements, ultimately aiding in more informed trading decisions.
DOWNLOAD NOW Reach Us on WhatsApp
 Fly Over to Telegram
 Drop Us an Email
Settings
- BB Period (value = 20)
21 reviews for Double Bollinger Band Indicator for MetaTrader 5
| 5 star | 52% | |
| 4 star | 47% | |
| 3 star | 0% | |
| 2 star | 0% | |
| 1 star | 0% |
Q & A
The middle band indicates a consolidation phase or neutral zone in price action, providing insights into potential market reversals or continuation patterns.
Yes, some strategies involving the Double Bollinger Bands utilize the inner band to capture smaller price movements within a trading range, which can be beneficial for traders seeking short-term opportunities.
During established trends, price stays closer to one of the outer bands, indicating strong directional momentum, which can be observed using the Double Bollinger Bands.
A breakout above upper band may indicate potential upside breakout, while a breakout below lower band may suggest downside breakout.
The indicator helps in analyzing volatility by observing the width between the bands. Tighter bands indicate lower volatility, while wider bands suggest higher volatility.
Related products
-
 Premium
Forex Scanner: Dashboard Scanner for MT5 | Market Scanner
Original price was: $299.00.$199.00Current price is: $199.00. Select options -
 Free
FreeAuto Risk-Based Lot for MT5 EA
$30.00 Select options -
 Premium
MT5 Trailing Stop EA
Original price was: $99.00.$10.00Current price is: $10.00. Select options -
 Free
FreeMT5 EA Drawdown Limiter
Original price was: $100.00.$10.00Current price is: $10.00. Select options
Martingale EA is effective, but it’s not a foolproof strategy. The 100% winning rate claim is a bit ambitious. Use it cautiously, and it can be a valuable asset in your trading arsenal.
Downloaded Martingale Forex EA, and my trading has never been better. The EA’s ability to identify optimal entry points is remarkable. It’s a must-have for serious traders.
Martingale EA is effective, but the emphasis on a 100% winning rate may mislead some traders. Use it cautiously, and it can be a valuable tool in your trading strategy.
Martingale EA is a valuable addition to my trading toolkit. It does what it says, but caution and discipline are essential. The counter trades have been a game-changer for me.
Martingale Forex EA is a true winner. The 100% winning rate is backed by solid performance. It adapts well to market changes, and the counter trades are a lifesaver. Highly recommended.