Confluence Detector indicator for MetaTrader 5 FREE Download
$0.00
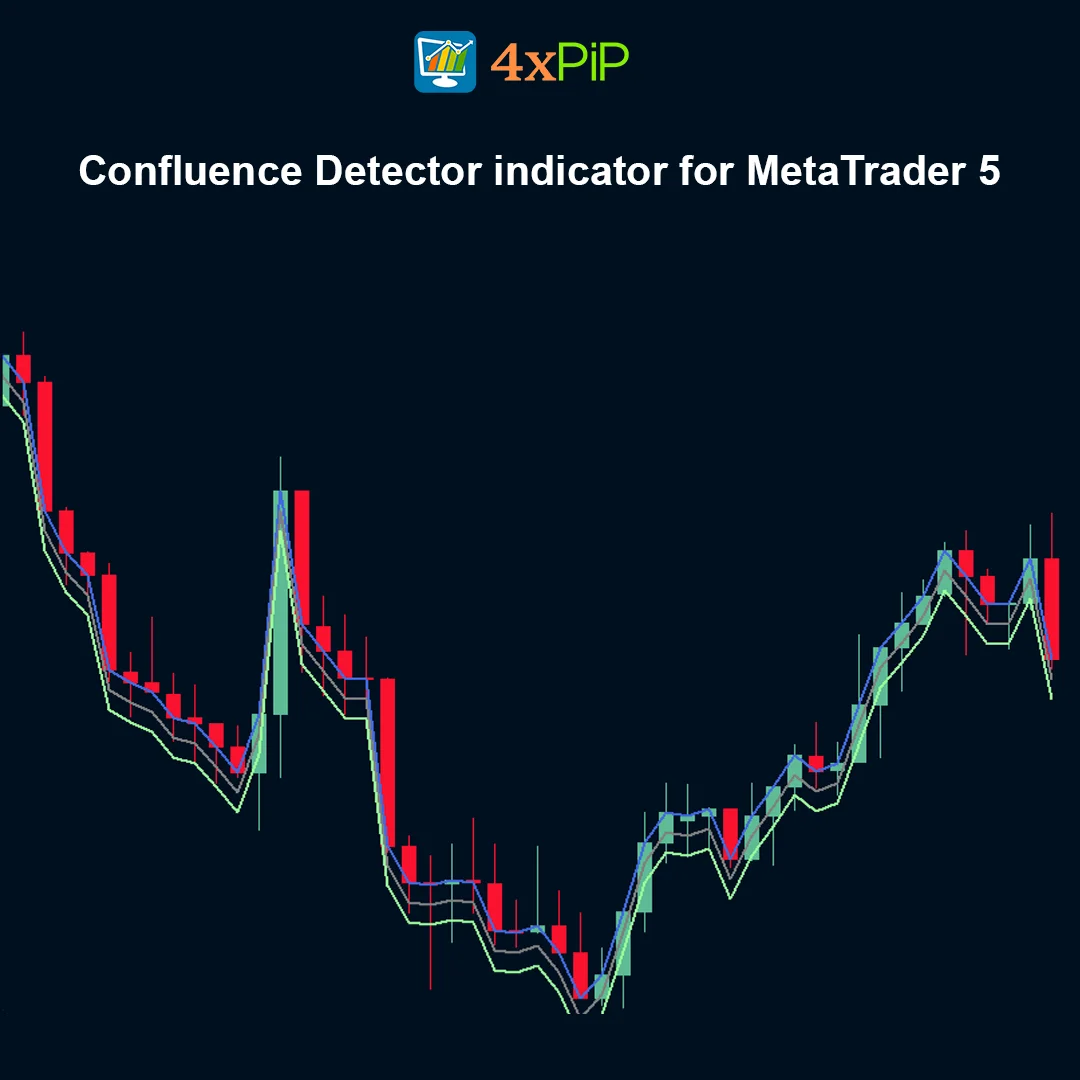
Confluence Detector is a multi-timeframe analysis tool for MetaTrader 5 that visually compares price direction across three timeframes. It draws three line plots to detect whether price closes are moving in harmony (confluence) or divergence. When lines contract, it indicates agreement between timeframes; when they expand, it signals disagreement and potential market noise.
Description
Confluence Detector
Confluence Detector is an experimental yet practical indicator designed to study price agreement across multiple timeframes.
The indicator:
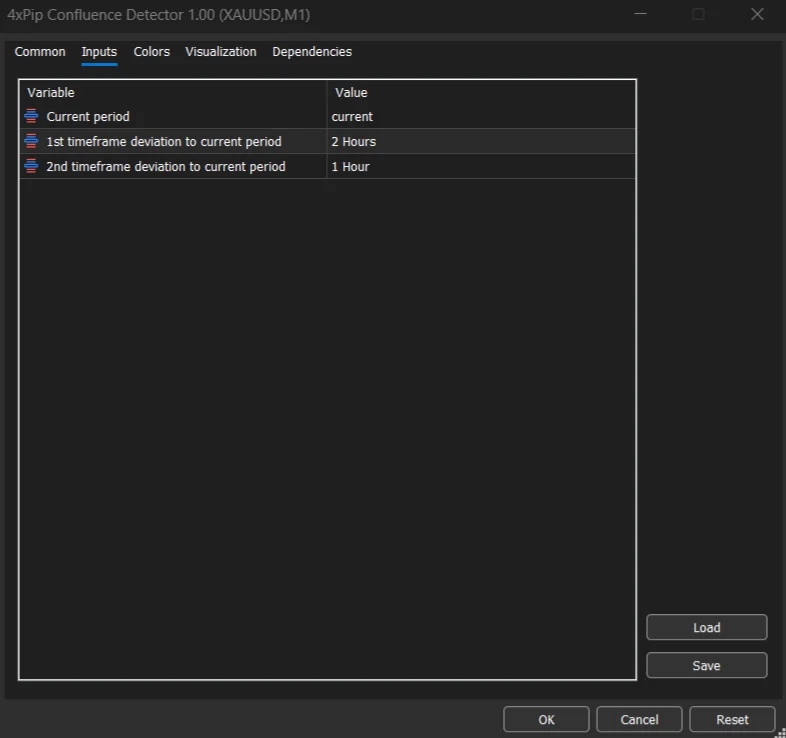
* Uses the current timeframe as the main reference.
* Allows you to select two additional lower timeframes for comparison.
* Draws three line plots on the chart.
How It Works
- First Plot
Displays a line chart of the closing prices of the current timeframe.
- Second Plot
Shows the deviation between the first input timeframe and the current timeframe.
- Third Plot
Shows the deviation between the second input timeframe and the current timeframe.
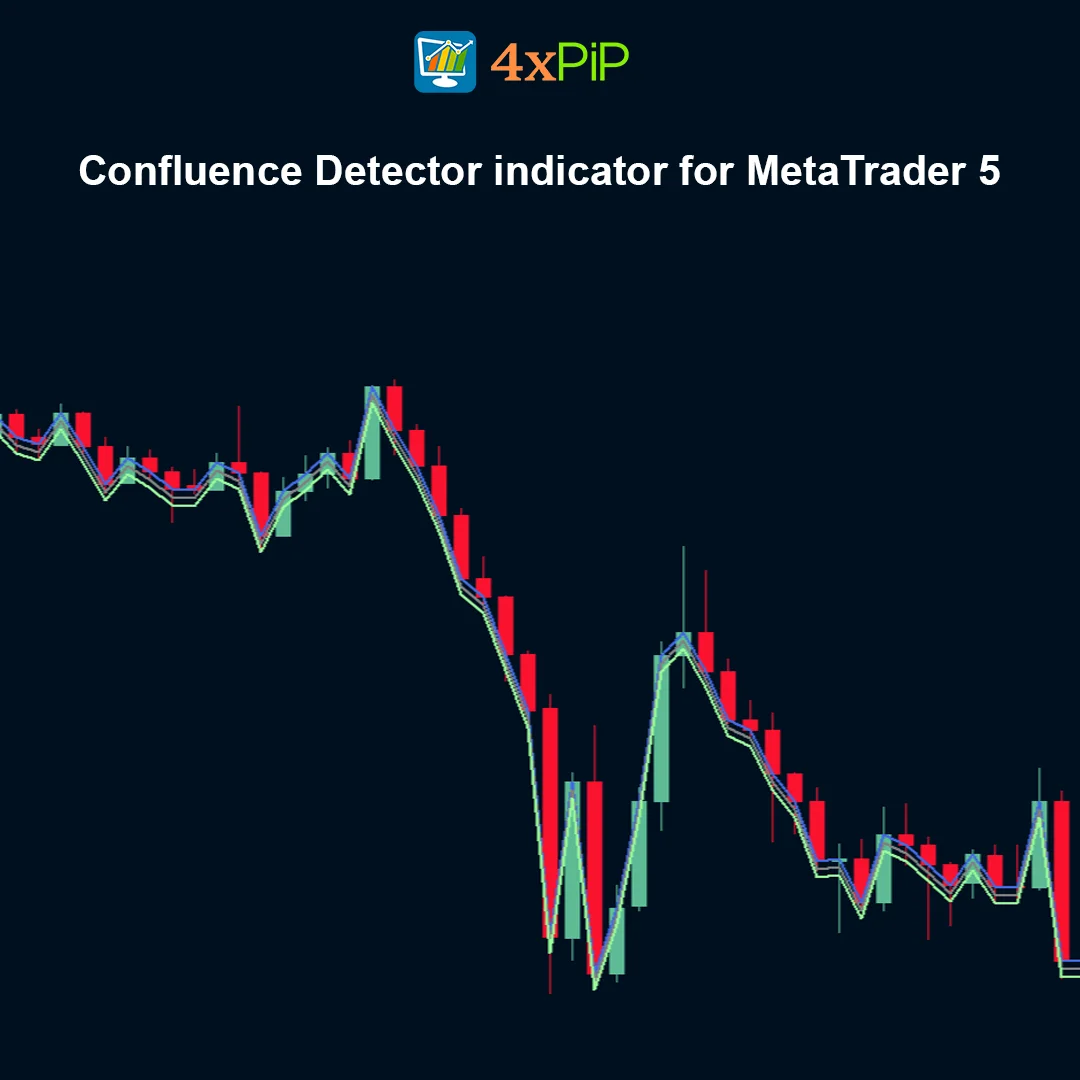
When price action across the selected timeframes moves in the same direction, the lines remain close together — this represents confluence.
When price behavior differs across timeframes, the lines move apart — this indicates lack of confluence and potential market instability.
Key Concept: Confluence
In this indicator, confluence means:
* Closing prices on different timeframes are harmonious.
* Directional agreement exists between timeframes.
* Market structure is aligned.
If bars are consistently the same color (for example, red on all timeframes), this suggests directional alignment.
Example Setup
Recommended Structure:
* TF 1 (Current): M30
* TF 2 (Deviator): M15
* TF 3 (Deviator): M5
In this case:
* Six M5 bars and two M15 bars fall inside one M30 candle.
* Lower timeframe closes update the deviation plots within the higher timeframe block.
* The lines adjust based on how each timeframe’s bars close.
This demonstrates how lower timeframe behavior influences higher timeframe confluence.
Advantages
- Provides clear multi-timeframe visualization.
- Helps avoid low-confluence trading conditions.
- Reduces trading during high noise periods.
- Works on all markets available in MT5.
- Supports structured timeframe analysis.
- Helps confirm trend alignment.
- Simple and minimalistic design.
- Based on real OHLC close data.
- Encourages disciplined trading decisions.
- Suitable for both beginners and advanced traders.
Features
- Three line plots displayed on the chart.
- Current timeframe comparison logic.
- Two customizable lower timeframes.
- Confluence detection through line contraction.
- Deviation visualization through line expansion.
- Based on closing price data (OHLC).
- Works across all MT5-supported instruments.
- Supports multiple timeframe combinations.
- Experimental analytical design.
- Optimized for real-time and historical data.
How to Trade
- Trade When Lines Contract
* When all three lines move closer together, it indicates strong confluence.
* This is generally a safer time to trade in the dominant direction.
- Avoid Trades When Lines Expand
* When lines move apart, timeframes disagree.
* This may indicate volatility, indecision, or market noise.
* Better to wait for alignment.
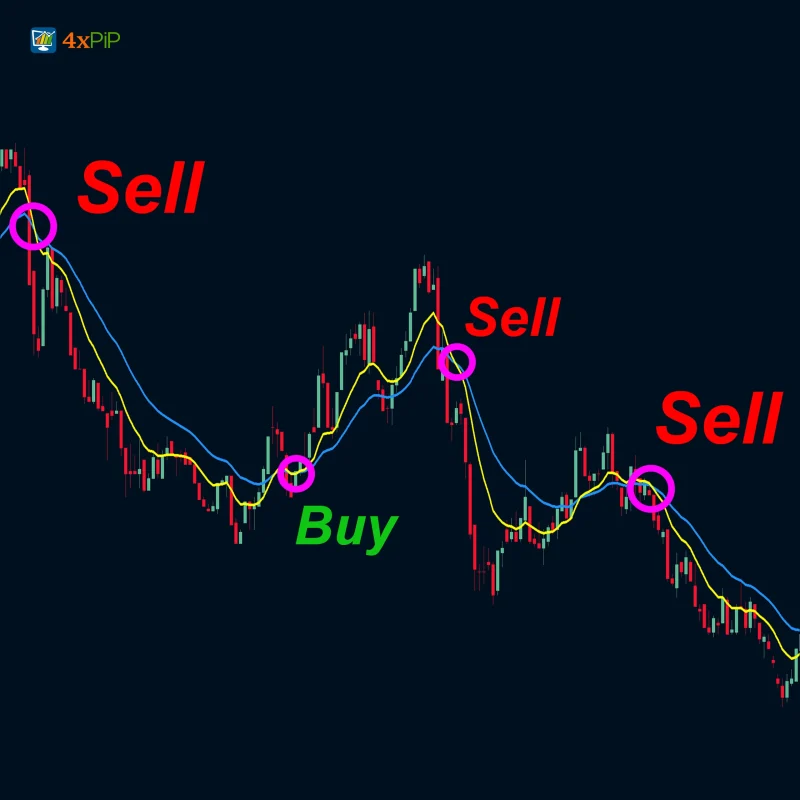
- Trend Confirmation
* Use the indicator to confirm higher timeframe direction.
* Enter trades on lower timeframe pullbacks only when confluence is present.
- Multi-Timeframe Strategy
* Always ensure:
* Current timeframe is higher than the two selected timeframes.
* Example: M30 (current), M15, M5.
This structure ensures logical data flow from lower to higher timeframes.
Formula / Logic
Let:
* C₀ = Close price of current timeframe
* C₁ = Close price of first selected timeframe
* C₂ = Close price of second selected timeframe
Deviation values are calculated as:
* D₁ = C₁ − C₀
* D₂ = C₂ − C₀
The three plots represent:
- Current Close (C₀)
- Deviation 1 (D₁)
- Deviation 2 (D₂)
Line behavior:
* Contraction→ Close prices are similar → Confluence
* Expansion→ Close prices differ → Lack of Confluence
The indicator uses OHLC data and updates based on closed bars, making it structurally reliable for timeframe comparison.
Conclusion
Confluence Detector for MetaTrader 5 is a minimalist yet powerful experimental tool that visually compares price behavior across multiple timeframes. By focusing on closing price alignment, it helps traders identify periods of agreement and avoid low-quality trading conditions.
When lines contract, markets are aligned.
When lines expand, caution is advised.
This makes it an excellent companion for disciplined multi-timeframe trading strategies.
DOWNLOAD NOW Reach Us on WhatsApp
 Fly Over to Telegram
 Drop Us an Email
FAQ's
Q & A
Related products
-
 Premium
Best Martingale Strategy Forex EA MT5 | Grid Trading
$99.00 Select options -
 Premium
MT5 BreakEven EA
Original price was: $99.00.$10.00Current price is: $10.00. Select options -
 Free
FreeMT5 EA Moving Average Crossover
Original price was: $100.00.$20.00Current price is: $20.00. Select options -
 Free
FreeMT5 ZigZag Fibonacci Indicator
$0.00 Select options
Reviews
There are no reviews yet