Candle Strength Indicator for MetaTrader 5 – Free Download
$0.00
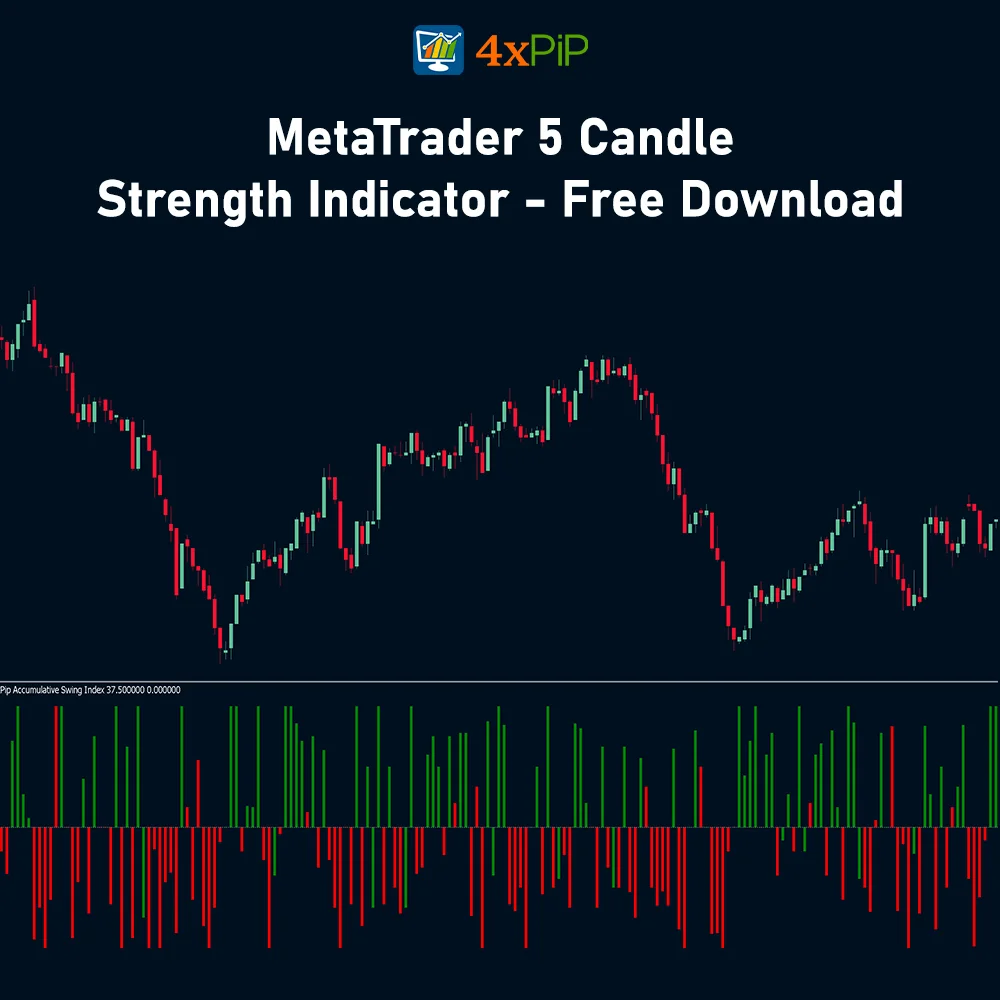
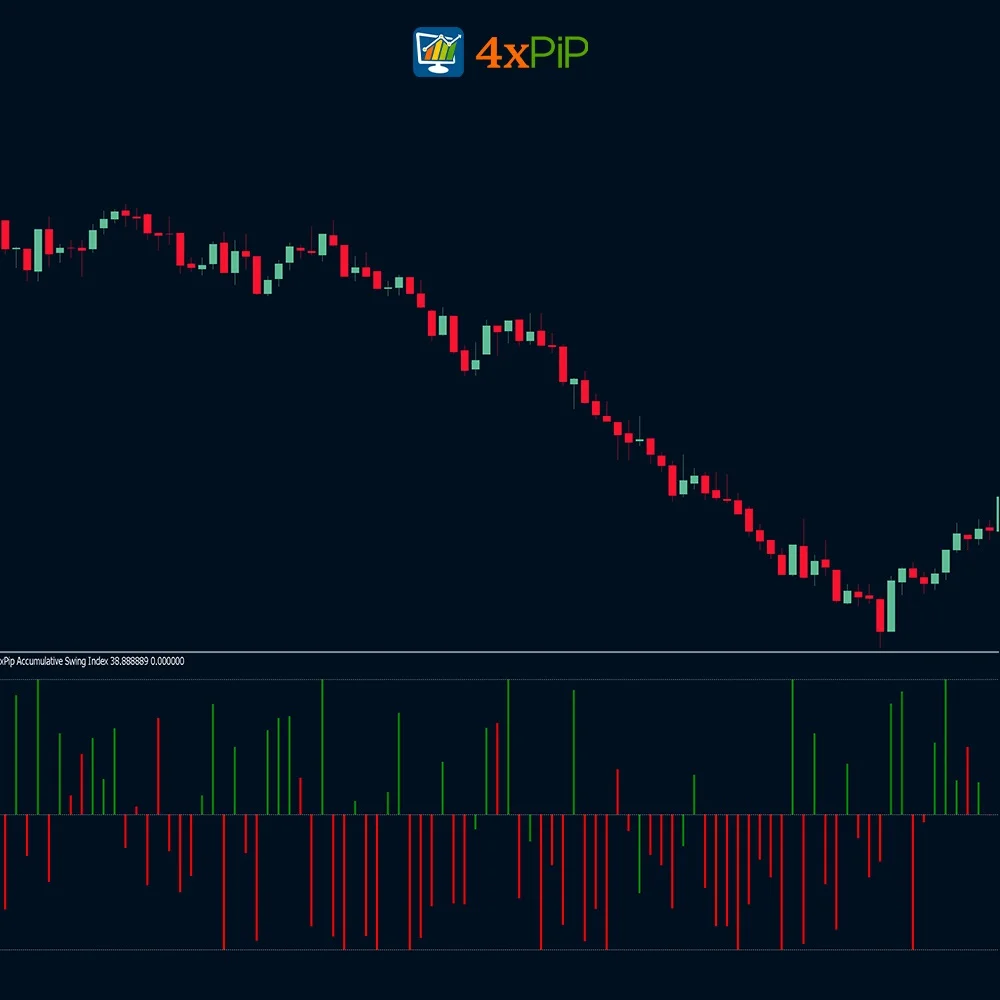
The 4xpip Candle Strength Indicator is an amazing tool for traders as measures the strength of individual candles and the overall market trend by using a clear red and green histogram in a separate window.
Description
What is Candle Strength?
Candle Strength is super important as it helps us figure out how strong a single candle is and what the overall market trend looks like. Traders use this info to decide when to make trades or skip them. If Candle Strength is 50 or more, it’s a good sign for a strong buy trade. On the flip side, if it’s -50 or less, it’s a strong sell trade. Also, you can see Candle Strength on a trading platform as a colored bar chart. Bigger bars mean stronger candles and a better chance for successful trades. Furthermore, the formula for Candle Strength might differ, but a basic one involves comparing closing and opening prices. Lastly, understanding Candle Strength is a must for traders who want to get what’s happening in the market and make smart trading choices.
Insights from the Candle Strength Indicator
The Candle Strength Indicator in MetaTrader 5 is a useful tool for traders. Instead of just looking at individual candles, it examines each one to understand overall market trends. This helps traders make better decisions for their strategies.
Strategic Trading with Candle Strength:
Using the insights from the Candle Strength Indicator can improve a trader’s overall approach. When the indicator shows high candle strength, it signals good trading conditions. But if the strength is low, traders should be careful. For example, a candle strength of 50 or above suggests strong buying opportunities, while -50 or lower indicates potential selling opportunities. Lastly, this approach makes traders’ actions more precise and effective in the financial markets.
Histogram Size and Market Potential:
The size of the histogram in the second window of the Candle Strength Indicator is important. Also, it visually represents the market’s potential for traders. A larger histogram means a more powerful candle, indicating increased market activity. Moreover, this visual helps traders assess candle strength and make well-informed choices. Moreover, a larger histogram suggests a greater potential for successful trades, showing a market with opportunities for strategic decision-making.
Formula:
Candle Strength = 100 * (Candle close price – Low price) / (High price – Low price)
How to Trade with Candle Strength Indicator?
After installation, open the indicator on your MetaTrader 5 chart by accessing the “Navigator” panel. Drag the Candle Strength Indicator from the “Indicators” section onto your desired chart. The indicator will appear as a dynamic histogram with red and green colors. Also, red indicates the downward trend and a good time to place a sell trade. While, Green indicates upward strength and a good time to place a buy trade. Furthermore, use the information from the dynamic histogram for effective trading signals. Lastly, make decisions based on candle strength and trend momentum. Also, a larger histogram suggests stronger candles, indicating potential favorable trading opportunities.
Features:
The features of the Candle Strength Indicator for MetaTrader 5 are designed to provide traders with a complete resource kit for technical analysis.
- Candle Strength Measurement:Understand how strong each candle is. Analyze the market to make better trading choices. Make candle strength a crucial part of your trading plan.
- Trend Strength Analysis: Check how the market is doing overall. Figure out if the trends are strong and which way they’re going. Decide when to buy or sell by looking at a detailed analysis of trend strength.
- Dynamic Histogram Display: See how the market is doing in a simple way. Look at a colorful chart that shows if it’s strong or weak using red and green bars. Understand the changes quickly and adjust your trading strategy.
- Signal Confirmation: Check your trade signals using the indicator’s strong analysis. Boost the trust in your trading choices by using the confirmation feature. Get more confidence in your signals with insights on candle and trend strength.
- User-Friendly Interface: Use the indicator easily in MetaTrader 5. The interface is simple, making your trading experience better. Use the tool smoothly to make decisions quickly and wisely.
- Multi Time Frame Analysis: Assess candle and trend strength across different timeframes simultaneously. It also shows a broader perspective on market trends and potential trade setups.
- Historical Analysis: Access historical data on the accuracy of past signals and indicator performance and evaluate different parameter combinations for better optimization of your trading strategy.
- Fully Customizable: Lastly, customize the Candle Strength Indicator to your preferences. Adjust colors, line styles, and parameters to align with your trading theme.
Conclusion
The Candle Strength Indicator for MetaTrader 5 is a must-have for traders seeking accurate candle strength and trend analysis. Moreover, with its user-friendly interface and comprehensive features, this indicator enhances your technical analysis toolkit. Download it now for free and take your trading success to new heights.
DOWNLOAD NOWQ & A
Yes, the indicator provides real-time updates, allowing traders to stay informed about evolving market dynamics and adjust their strategies accordingly.
Customer Support answered on March 14, 2024The indicator offers enhanced technical analysis capabilities, empowering traders to make informed and strategic trading decisions.
Customer Support answered on March 14, 2024Yes, traders can adjust parameters such as visualization settings and threshold levels to tailor the indicator to their specific trading preferences and strategies.
Customer Support answered on March 14, 2024Yes, the indicator is versatile and can be applied to various trading styles and asset classes, providing valuable insights for both short-term and long-term traders.
Customer Support answered on March 14, 2024Traders can leverage the indicator's insights to identify optimal entry and exit points, validate trading signals, and adjust their strategies based on changing market conditions.
Customer Support answered on March 14, 2024Sorry, no questions were found
Related products
-
 Premium
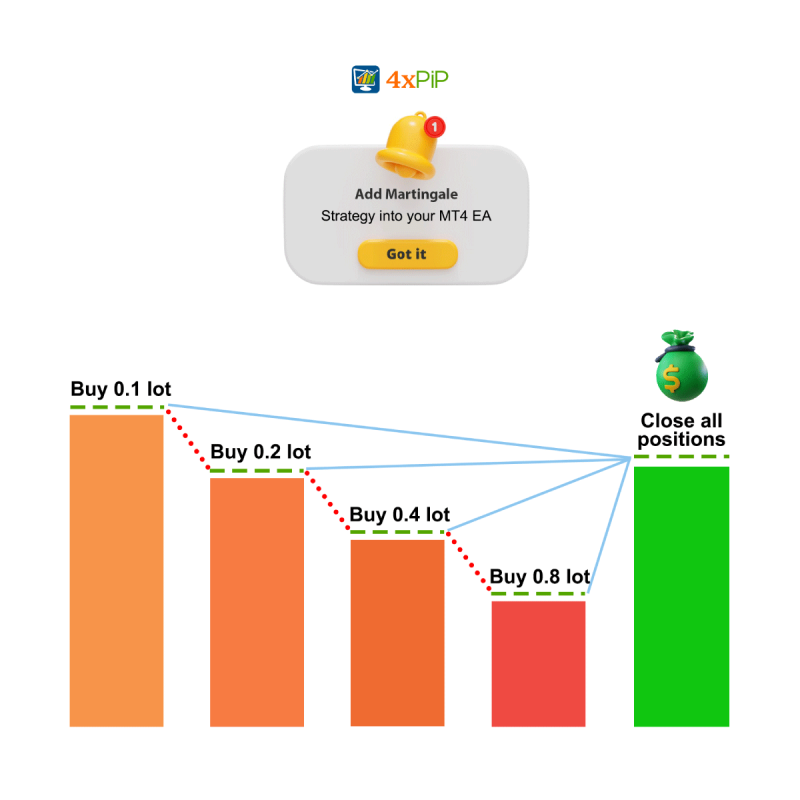
Best Martingale Strategy Forex EA MT5 | Grid Trading
Rated 5.00 out of 5$99.00 Select options -
 Premium
Forex Scanner: Dashboard Scanner for MT5 | Market Scanner
Rated 5.00 out of 5$299.00Original price was: $299.00.$199.00Current price is: $199.00. Select options -
 Premium
MT5 EA to send Signal Alerts to Telegram channel
Rated 4.86 out of 5$199.00Original price was: $199.00.$49.00Current price is: $49.00. Select options -
 Free
FreeAddition of Alerts to your EA indicator MT5
Rated 4.73 out of 5$30.00 Select options

 Reach Us on WhatsApp
 Fly Over to Telegram
 Drop Us an Email
Reviews
There are no reviews yet