In this article, 4xPip has delivered detailed knowledge about the indicator called Moving Average. Furthermore, 4xPip has also discussed its purpose and work in this article. To get in-depth information about the Moving Average (MA), read the whole article. Additionally, 4xPip provides automation of user trading strategies for forex trading through indicators and Expert Advisors (EA). Consequently, you can also visit the website to get more assistance for your trading, i.e., auto trading. Furthermore, you can also view more articles by clicking on this link.
Moving Average:
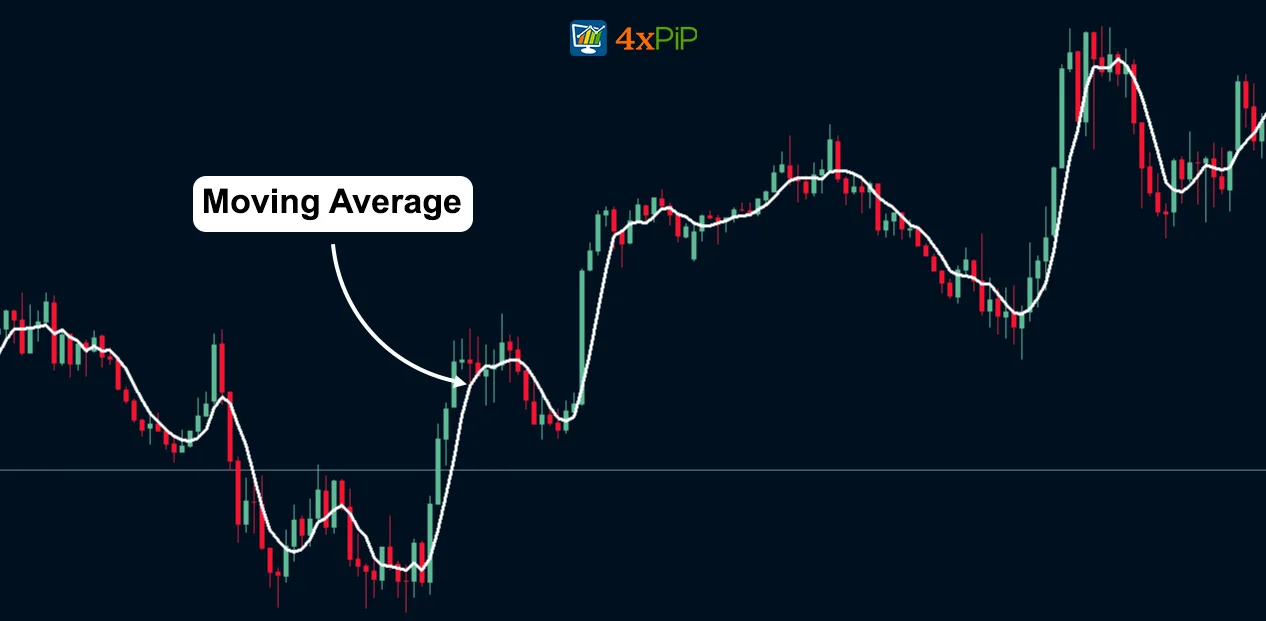
A moving average (MA) is a technical analysis tool that helps smooth out price data by creating a constantly updated average price. This can help to identify trends and patterns in the price of a security.
There are two main types of moving averages: simple moving averages (SMAs) and exponential moving averages (EMAs). SMAs are calculated by taking the average of the closing prices over a specified period. Conversely, EMAs give more weight to recent prices; consequently, they are more responsive to changes in the price of a security.
Moving averages are often used to identify support and resistance levels. Specifically, support is a price level where buyers are likely to step in and prevent the price from falling further. In contrast, resistance is a price level where sellers are likely to step in and prevent the price from rising further.
Furthermore, moving averages can also be employed to identify trend direction. Notably, a rising moving average indicates that the security is in an uptrend, while a falling moving average suggests that the security is in a downtrend.
How to Use Moving Average:
Utilizing moving averages for accurate trade entry can be a valuable strategy in technical analysis. Here are some steps and tips to consider:
-
Select the Right Time-frame: First, determine the timeframe that suits your trading strategy. Are you a short-term trader looking at intraday charts, a swing trader analyzing daily or weekly charts, or a long-term investor examining monthly charts? The choice of timeframe will affect the type of moving average you use (e.g., 10-day, 50-day, 200-day).
-
Choose the Appropriate Moving Average: Then, depending on your trading style and objectives, you can opt for simple moving averages (SMA) or exponential moving averages (EMA). SMAs provide a smoother, slower response, ideal for long-term trends, while EMAs respond quickly to recent price changes, making them suitable for short-term trading.
-
Identify the Trend: Determine whether the market is in an uptrend, downtrend, or ranging. A moving average can help you identify the prevailing trend. A rising moving average suggests an uptrend, while a falling moving average indicates a downtrend.
-
Look for Crossovers: Crossovers occur when a short-term moving average crosses above (bullish) or below (bearish) a longer-term moving average. A popular strategy is to use a 50-day and 200-day SMA crossover for long-term trading. Crossovers can signal a potential entry point.
-
Use Multiple Moving Averages: Furthermore, some traders employ two or more moving averages with different timeframes to confirm signals. For example, you might use a 10-day EMA and a 50-day EMA for short-term trades. In this case, a “golden cross” (short-term EMA crossing above long-term EMA) or “death cross” (short-term EMA crossing below long-term EMA) can be used as entry points.
-
Consider Support and Resistance: Additionally, pay attention to key support and resistance levels. An asset’s price approaching a moving average in conjunction with a strong support or resistance level can offer a solid entry opportunity.
-
Combine with Other Indicators: Moving averages work well when combined with other technical indicators, such as the Relative Strength Index (RSI), MACD, or Stochastic Oscillator. These indicators can provide additional confirmation of potential entry points.
-
Set Stop Loss and Take Profit Levels: Moreover, always use risk management tools like stop-loss orders to limit potential losses and take-profit orders to secure profits. These should be based on your analysis and the characteristics of the asset you’re trading.
-
Backtest and Practice: Most importantly, before implementing any strategy with real money, it’s crucial to backtest it on historical data and practice it in a demo account. This allows you to gain confidence and refine your approach.
-
Stay Informed: Lastly, keep an eye on economic events, news, and market sentiment, as these can influence the success of your trades.
However, it is important to remember that no single indicator is foolproof, and trading involves risk. Therefore, it is essential to have a well-defined trading plan, set realistic expectations, and continuously refine your approach as you gain experience.
Types of Moving Averages:
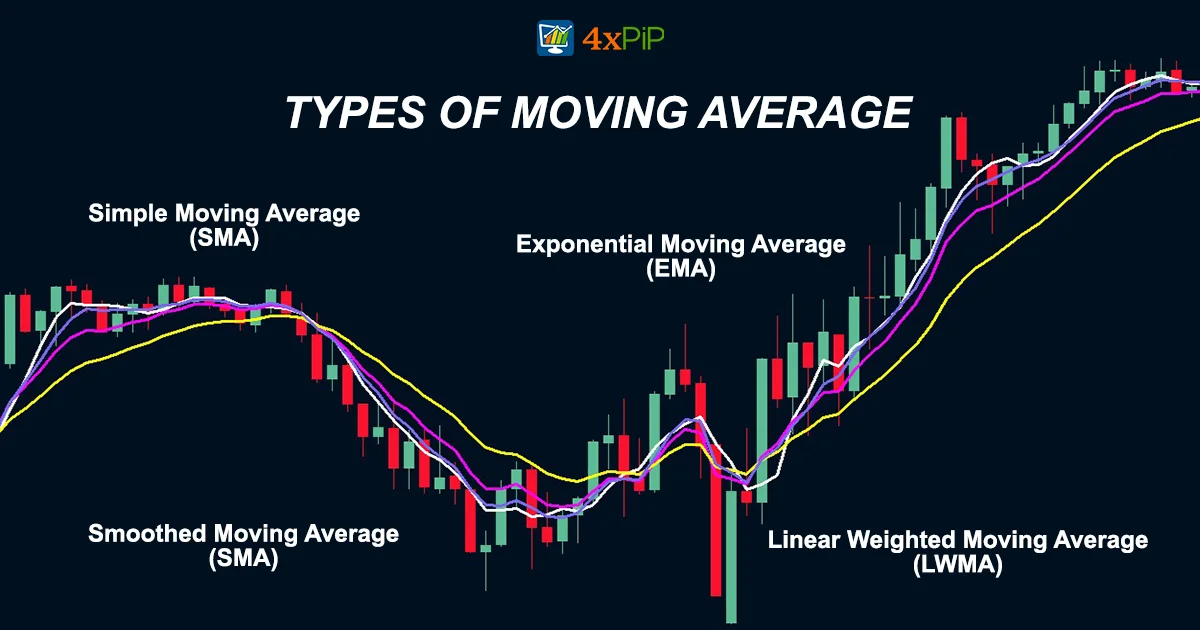
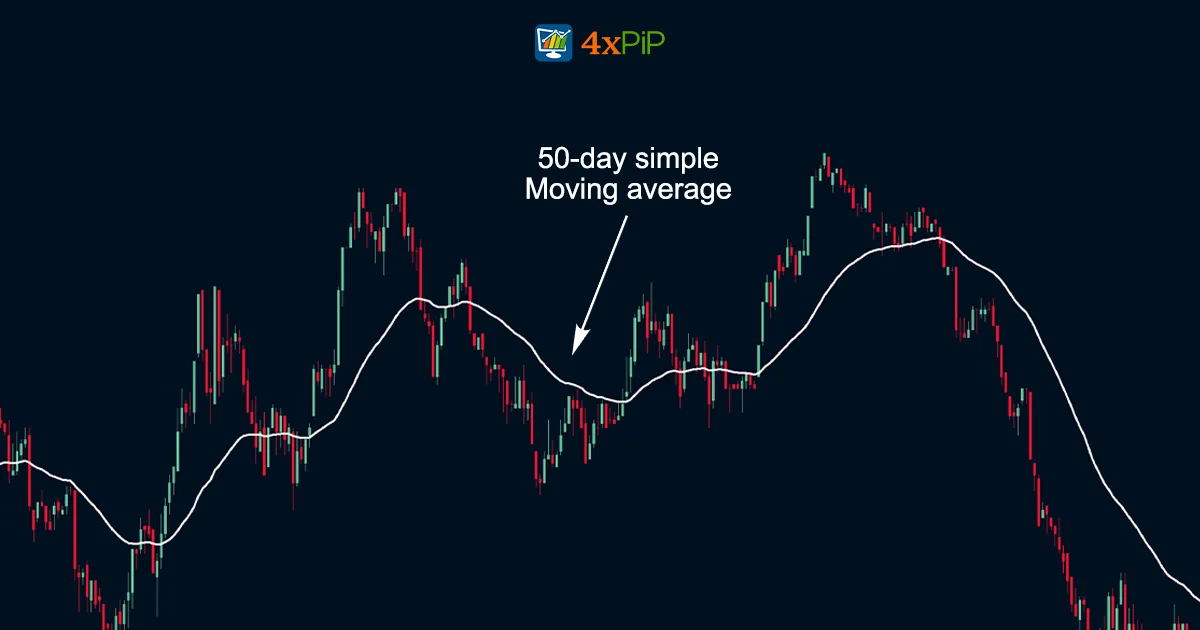
Simple Moving Average (SMA):
A simple moving average (SMA) is a technical analysis tool that helps smooth out price data by creating a constantly updated average price. In other words, the SMA helps to reduce the noise in price data and make it easier to see the underlying trend.
Consequently, this can help to identify trends and patterns in the price of a security. For example, if the SMA is rising, it suggests that the security is in an uptrend. If the SMA is falling, it suggests that the security is in a downtrend.
The SMA is calculated by taking the average of the closing prices over a specified period. For instance, a 50-day SMA would take the average of the closing prices for the past 50 days. The most common periods used for SMAs are 50 days, 100 days, and 200 days.
SMAs are a simple and popular technical indicator that can be used by traders and investors of all levels. However, it is important to note that SMAs are just one technical indicator and should not be used in isolation. Other factors, such as fundamental analysis and technical analysis using other indicators, should also be considered when making trading decisions.
The formula for calculating a simple moving average is as follows:
SMA = (sum of closing prices over n periods) / n
where:
- SMA is the simple moving average.
- n is the number of periods
- closing prices are the closing prices for the past n periods.
For example, to calculate a 50-day SMA, you would add up the closing prices for the past 50 days and then divide by 50.
Exponential Moving Average (EMA):
An exponential moving average (EMA) is a technical analysis tool that helps smooth out price data by giving more weight to recent prices. In other words, the EMA is more responsive to recent price changes than a simple moving average (SMA). This can help to identify trends and patterns in the price of security more quickly.
The EMA is calculated by taking the average of the closing prices over a specified period of time, but it assigns more weight to the most recent prices. This is done by using a weighting factor that decreases exponentially as the data moves further back in time.
As a result, the EMA is more sensitive to recent price changes than the SMA. This makes it a good choice for traders who want to identify short-term trends and trading opportunities. However, it is important to note that the EMA can be more volatile than the SMA, as it is more sensitive to recent price changes. This means that it is important to use other technical indicators and fundamental analysis to confirm trading signals generated by the EMA.
Therefore, the formula for calculating an EMA is as follows:
EMA = (previous EMA * (1 – smoothing factor)) + (current price * smoothing factor);
where:
- EMA is the exponential moving average.
- previous EMA is the previous value of the EMA.
- current price is the current price of the security.
- smoothing factor is a constant that determines how much weight is given to the most recent prices. The typical smoothing factor for an EMA is 2 / (n + 1), where n is the number of periods in the EMA.
For example, to calculate a 20-day EMA, you would use a smoothing factor of 2 / (20 + 1) = 0.0952. In this context, the first value of the EMA would be the simple moving average of the closing prices for the past 20 days. Subsequently, the next value of the EMA would be calculated by multiplying the previous value of the EMA by 0.9048 (1 – the smoothing factor) and adding the current price of the security multiplied by the smoothing factor (0.0952).
Smoothed Moving Average (SMMA)
A smoothed moving average (SMMA) is a technical analysis tool similar to the exponential moving average (EMA), but it is designed to reduce the impact of sharp price fluctuations by emphasizing recent data. Specifically, it is calculated using the average of closing prices over a specific time period, but it places greater emphasis on more recent prices while effectively smoothing out abrupt fluctuations.
The formula for computing an SMMA is as follows:
SMMA = (previous SMMA * (n – 1) + current price) / n
where:
- SMMA denotes the smoothed moving average.
- previous SMMA refers to the previous value of the SMMA.
- current price signifies the current price of the security.
- n represents the number of periods in the SMMA, determining the weight assigned to recent prices.
In contrast to the EMA, the SMMA provides a smoother representation of price movements, reducing the impact of short-term price fluctuations and enabling traders to identify longer-term trends and patterns with greater clarity.
Linear Weighted Moving Average (LWMA)
A linear weighted moving average (LWMA) is a type of technical analysis tool used to smoothen price data by assigning varying weights to the data points. In other words, the LWMA gives more weight to recent prices than to older prices. Similar to other moving averages, the LWMA focuses on recent prices while considering historical data. This makes it a useful tool for identifying trends and support and resistance levels.
Specifically, the LWMA is calculated by multiplying each data point by a certain weight, with the weights linearly decreasing as the data moves further back in time. This means that the most recent price point has the highest weight, and the oldest price point has the lowest weight.
As a result, the LWMA is more responsive to recent price changes than other moving averages, such as the simple moving average (SMA). This makes it a good choice for traders who want to identify short-term trends and trading opportunities.
However, it is important to note that the LWMA can be more volatile than other moving averages, as it is more sensitive to recent price changes. This means that it is important to use other technical indicators and fundamental analysis to confirm trading signals generated by the LWMA.
The formula for calculating an LWMA is:
LWMA = Σ (P[i] * w[i]) / Σ (w[i])
where:
- LWMA represents the linear weighted moving average.
- P[i] denotes the price at a specific point in time.
- w[i] refers to the weight corresponding to the specific point in time.
SMA vs EMA:
The EMA is a more responsive indicator than the SMA, and as a result, it can react more quickly to changes in the price of a security. This characteristic makes it a good tool for identifying short-term trends and patterns.
On the other hand, the SMA is a less responsive indicator than the EMA, implying that it takes longer to react to changes in the price of a security. Consequently, this makes it a useful tool for identifying long-term trends and patterns.
The best way to choose between the SMA and the EMA is to consider your trading style and objectives. Specifically, if you are a short-term trader, you may want to use the EMA because it is more responsive to changes in the price. Conversely, if you are a long-term trader, you may want to use the SMA because it is less sensitive to noise and can identify long-term trends.
Here is a table that summarizes the key differences between the SMA and the EMA:
|
Feature |
Simple Moving Average (SMA) |
Exponential Moving Average (EMA) |
|
Calculation |
Takes the average of the closing prices over a specified period. |
Gives more weight to recent prices. |
|
Responsiveness |
Less responsive to changes in price. |
More responsive to changes in price. |
|
Usefulness |
Good for identifying long-term trends. |
Good for identifying short-term trends. |
SMMA vs LWMA:
The SMMA and LWMA exhibit differing response characteristics, influencing their suitability for various trading approaches. In other words, the SMMA and LWMA react to price changes differently, which makes them better suited for different trading styles. Specifically, the SMMA has a smoother reaction to price shifts. This makes it beneficial for identifying prolonged trends and performing a more stable analysis of long-term market movements.
In contrast, the LWMA uses linear weighting for recent data points. This makes it adept at promptly capturing short-term fluctuations, which is advantageous for traders aiming to capitalize on immediate market dynamics and shorter-term trends. Ultimately, the choice between the SMMA and LWMA depends on the trader’s preferred time horizon and specific trading objectives. Traders inclined towards longer-term strategies may find the SMMA’s stability and reduced sensitivity to market noise advantageous, while those focusing on shorter-term trades may benefit from the LWMA’s ability to swiftly respond to immediate price variations.
|
Feature |
Smoothed Moving Average (SMMA) |
Linear Weighted Moving Average (LWMA) |
|
Calculation |
Takes the average of the closing prices over a specified period. |
Gives more weight to recent prices, with the most recent price having the highest weight. |
|
Responsiveness |
Less responsive to changes in price. |
More responsive to changes in price than the SMA. |
|
Usefulness |
Good for identifying long-term trends. |
Good for identifying medium-term trends. |
Golden Cross: What Is a Golden Cross?
In technical analysis, a golden cross occurs when a short-term moving average crosses above a long-term moving average. Analysts consider this a bullish signal because it suggests a shift in the trend from down to up. Traditionally, traders often use the 50-day moving average and the 200-day moving average for a golden cross. However, they can also employ other moving averages, such as the 10-day and 30-day moving averages.
Specifically, a golden cross is typically interpreted as a sign that the market is beginning a new uptrend. This is because the short-term moving average crossing above the long-term moving average indicates that the market is now trending upwards in the short term as well as the long term.
It is important to note that a golden cross is not a guarantee of future profits. However, it is a popular technical indicator that many traders use to identify potential trading opportunities.
Summary:
The comprehensive blog provided by 4xPip offers an insightful overview of the Moving Average (MA) indicator, elucidating its significance in identifying trends and patterns in security prices. In other words, the blog provides a detailed explanation of how the MA indicator can be used to understand and predict the movement of security prices.
The article details the differences between Simple Moving Averages (SMAs) and Exponential Moving Averages (EMAs), highlighting their respective responsiveness and utility for short-term and long-term trend analysis. Specifically, the article discusses how SMAs and EMAs are calculated, how they differ in terms of responsiveness to price changes, and how they can be used to identify different types of trends.
Additionally, the blog delves into Smoothed Moving Averages (SMMA) and Linear Weighted Moving Averages (LWMA), underscoring their distinct response characteristics and suitability for different trading approaches. Notably, the post emphasizes the importance of selecting the appropriate moving average based on one’s trading style and objectives.
Moreover, the article touches upon the concept of the Golden Cross, elucidating its significance as a bullish signal in technical analysis. Overall, the blog serves as a comprehensive guide for traders seeking to leverage moving averages effectively in their trading strategies.
Furthermore, 4xPip also provides Moving Average products like MT5 EA Moving Average Crossover, MT4 EA Moving Average Crossover, MT5 MACD Explained Indicator, MT4 Optimized MA Indicator, and MT4 Multicolor MA Indicator.


