Traders seek reliable tools to analyze complexities and make informed decisions in the financial market. The Moving Average Convergence Divergence (MACD) indicator is like a guide because it helps us understand what’s happening in the market. In this extensive guide presented by 4xPip, a reliable provider of trading tools, we will explore the Moving Average Convergence Divergence (MACD) indicator, its formula, and its crossover strategy. 4xPip has also shared how traders can automate MACD indicators for effortless 24×7 trading. For additional assistance and insights, feel free to contact the experts at 4xPip via email at [email protected].
What Is The Moving Average Convergence Divergence (MACD) Indicator In Trading?
Technical indicators employed in trading typically belong to one of five categories: trend, mean reversion, relative strength, momentum, and volume indicators. Positioned within the momentum category, the Moving Average Convergence Divergence (MACD) indicator is specifically classified as a trend-following indicator. Illustrating the correlation between two exponential moving averages (EMAs) of a security or price chart, the MACD indicator is derived by computing the difference between the two EMAs such as the 12-period EMA and the 26-period EMA.
The 4xPip MT5 MACD Explained Indicator is an in-depth technical analysis tool designed to offer traders a complete understanding of the Moving Average Convergence Divergence (MACD) indicator, empowering them to make well-informed trading decisions. Download the 4xPip MT5 MACD Explained Indicator at 4xpip.com and elevate your trading experience.
What are the MACD line and MACD signal line?
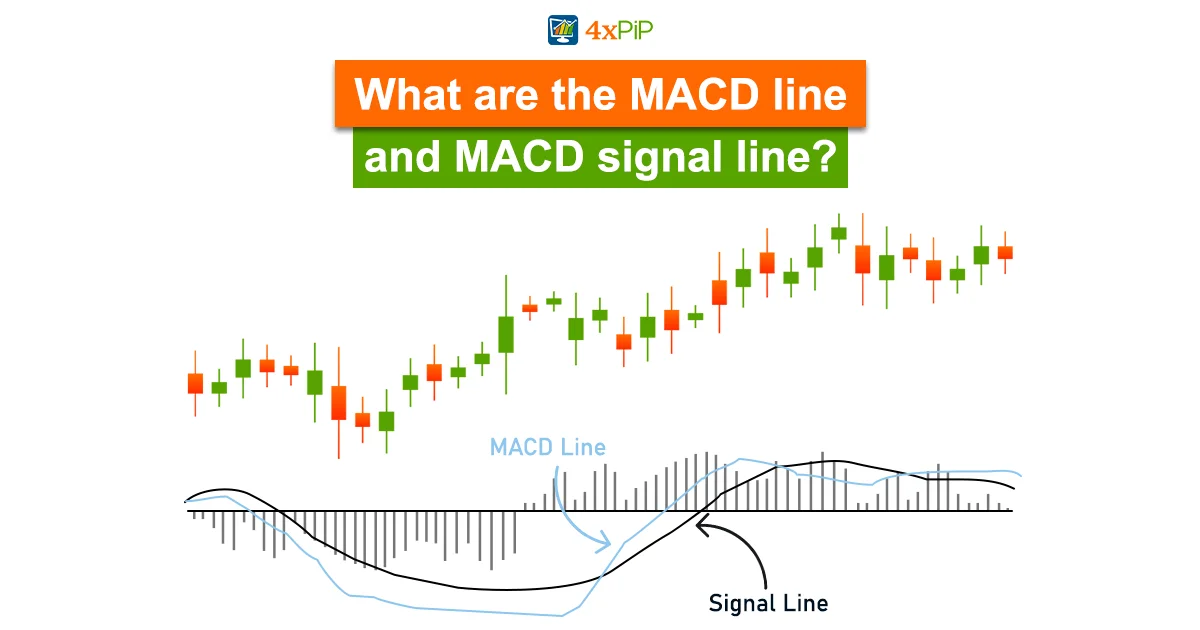
The Moving Average Convergence Divergence MACD line is derived by subtracting the 26-period EMA from the 12-period EMA, resulting in the MACD line.
The signal line, known as a nine-day EMA of the MACD line, is plotted above the MACD line, serving as a potential trigger for buy or sell signals.
Investors or Traders might opt to buy or long the security or currency when the MACD line is above the signal line and, conversely, sell or short the security or currency when the MACD line is below the signal line. While MACD indicators offer various interpretations, the more prevalent methods include crossovers, divergences, and rapid rises or falls of the MACD lines.
Formula of MACD
The MACD calculation involves two main exponential moving averages (EMAs), let’s take an example of 12 EMA and 26 EMA:
MACD Line =12-period EMA − 26-period EMA
The Signal line is derived from a 9-period EMA of the MACD Line, and the Histogram visually represents the difference between the MACD Line and the Signal line, providing a snapshot of momentum shifts.
An Exponential Moving Average (EMA) is a type of moving average (MA) that assigns higher weight and importance to the most recent data points.
What does the Histogram on the MACD tell you?
The MACD is frequently accompanied by a histogram, illustrating the gap between MACD and its signal line. When MACD is positioned above the signal line, the Histogram will be above MACD’s baseline or zero line. Conversely, if MACD is below its signal line, the Histogram will be below the MACD’s baseline. Traders utilize the MACD histogram to discern periods of heightened bullish or bearish momentum and potentially identify overbought/oversold signals.
How Do You Use Divergence In MACD?
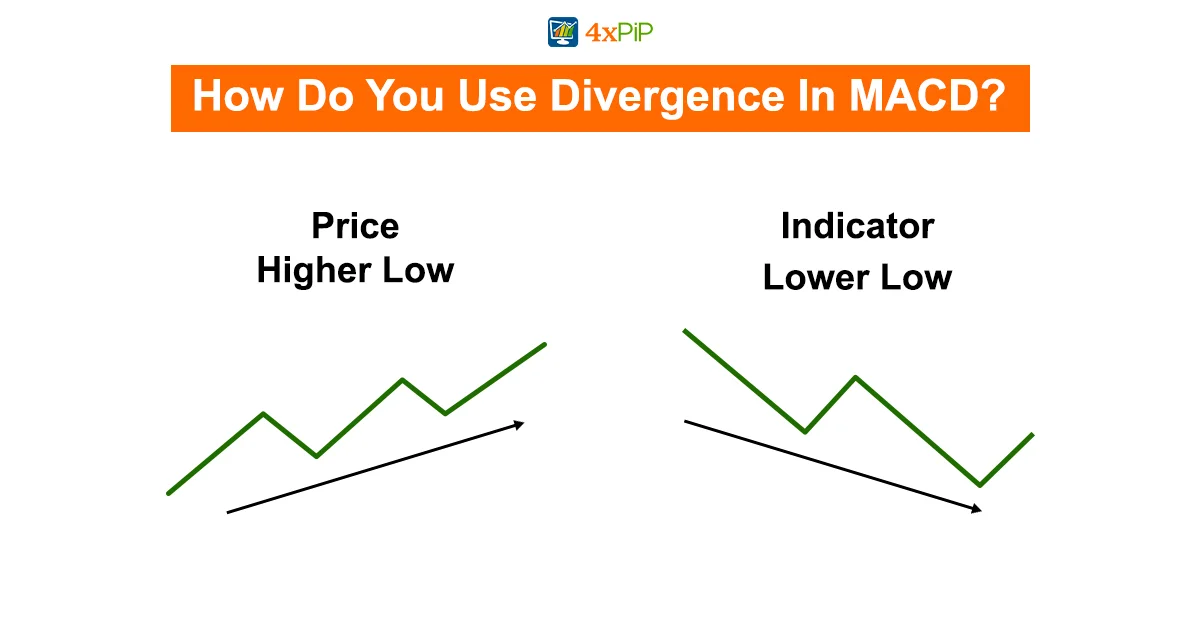
Divergence is a condition where elements move apart or exhibit independence. In the context of MACD, it refers to a scenario where price action and momentum do not align. For instance, divergence may manifest when the price consistently forms lower highs, but the MACD histogram depicts a series of higher lows. In such a case, although the highs are descending, the momentum of the price is slowing down, indicating an impending decline.
By progressively increasing their short positions, the trader eventually reaps substantial profits when the price experiences a sustained reversal following the last point of divergence.
What Is The Moving Average Convergence Divergence (MACD) Crossover Trading Strategy?
Crossovers exhibit more excellent reliability when aligning with the existing trend. For instance, if the MACD crosses above its signal line following a brief downward correction within a broader, upward trend, it signifies a bullish confirmation. It suggests the probable continuation of the prevailing uptrend.
When the MACD is below the signal line, it emits a bearish signal, suggesting a potential selling opportunity. Conversely, when the MACD ascends above the signal line, it generates a bullish signal, indicating a potential upward momentum in the asset’s price. Certain traders prefer waiting for a confirmed cross above the signal line before initiating a position to minimize the risk of false signals and entering a position prematurely.
The 4xPip’s MT4 EA Moving Average Crossover automates trades based on two moving average lines. It initiates Buy or Long positions when EMA 7 crosses above EMA 14 and Sell or Short positions when EMA 7 crosses below EMA 14. It enables traders to customize EMA settings, lot size, stop loss, take profit, and offers features such as Trailing Stop Loss, Break Even, and Risk% lot size to enhance trade management and maximize profits effectively.
Is MACD Bullish or Bearish?
A bullish signal is generated when the MACD crosses above zero, whereas a bearish signal occurs when it crosses below zero. Bullish indication is also observed when the MACD turns up from below zero, while a bearish signal is signaled when it turns down from above zero.
A bullish trend is indicated when the MACD line crosses from below to above the signal line. The strength of the signal intensifies the farther below the zero line it occurs.
A bearish trend is identified when the MACD line crosses from above to below the signal line. The strength of this signal increases the farther above the zero line it takes place.
How to Automate MACD Indicator In Metatrader 4 And Metatrader 5?
MetaTrader4/5 boast automated trading features for daily activities across financial markets, performing versatile platform with toolset for executing trading strategies. 4xPip offers various high-performing MT4 and MT5 auto trading Expert Advisors that aids traders in enhancing their trading outcomes. You can easily convert your MT4 and MT5 MACD indicators into automated EA robots, streamlining trade execution based on indicators and saving you valuable time, effort, and energy. 4xPip bots support traders in conducting risk-free trading, analyzing price charts, avoiding news events, and staying informed about market trends. Contact [email protected] now to get your MT4 and MT5 MACD Expert Advisors and make your life easier.
Limitations of Moving Average Convergence Divergence (MACD) Indicator
MACD has certain limitations that traders should be mindful of. It is short-term indicator, with its extended consideration being 26-day moving-average, making it less suitable for those with longer-term perspective. Additionally, MACD is inherently trend-following indicator, meaning it may not deliver optimal results in sideways where trends are less evident. Moreover, when identifying extreme overbought or oversold conditions, MACD may not be the most effective tool, and alternative indicators like the Relative Strength Index (RSI) could offer more valuable insights.
4xPip MT4 improved RSI Indicator is a powerful tool in technical analysis, crafted for traders to recognize trend reversals. Boasting advanced algorithm and customizable settings, this indicator delivers reliable and accurate signals, catering to traders of varying experience levels. You can download it by visiting 4xpip.com.
Conclusion:
MACD indicator remains a good companion for traders seeking to explain market trends. Its versatility in providing signals through crossovers, zero line crossings, and divergence analysis makes it a reliable indicator. Mastering the MACD indicator is pivotal for traders seeking success in financial markets. With 4xPip as a trusted ally, traders gain access to high-quality, accurate EAs designed with precision. Platform’s VIP customer support further solidifies its commitment to trader success, making 4xPip valuable partner for those analyzing trading landscape.