
PivotPoint Indicator for MetaTrader 5 – FREE Download
$0.00
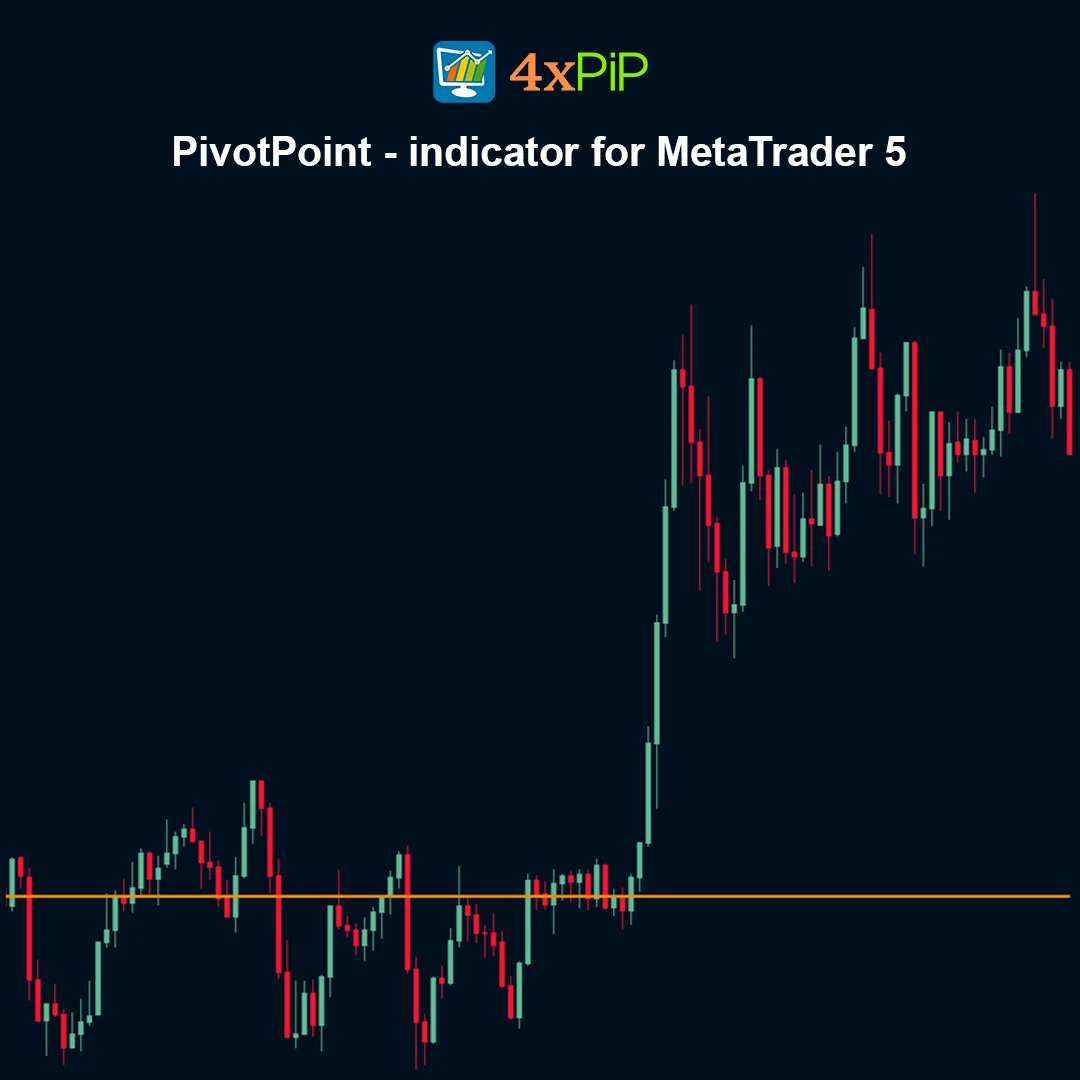
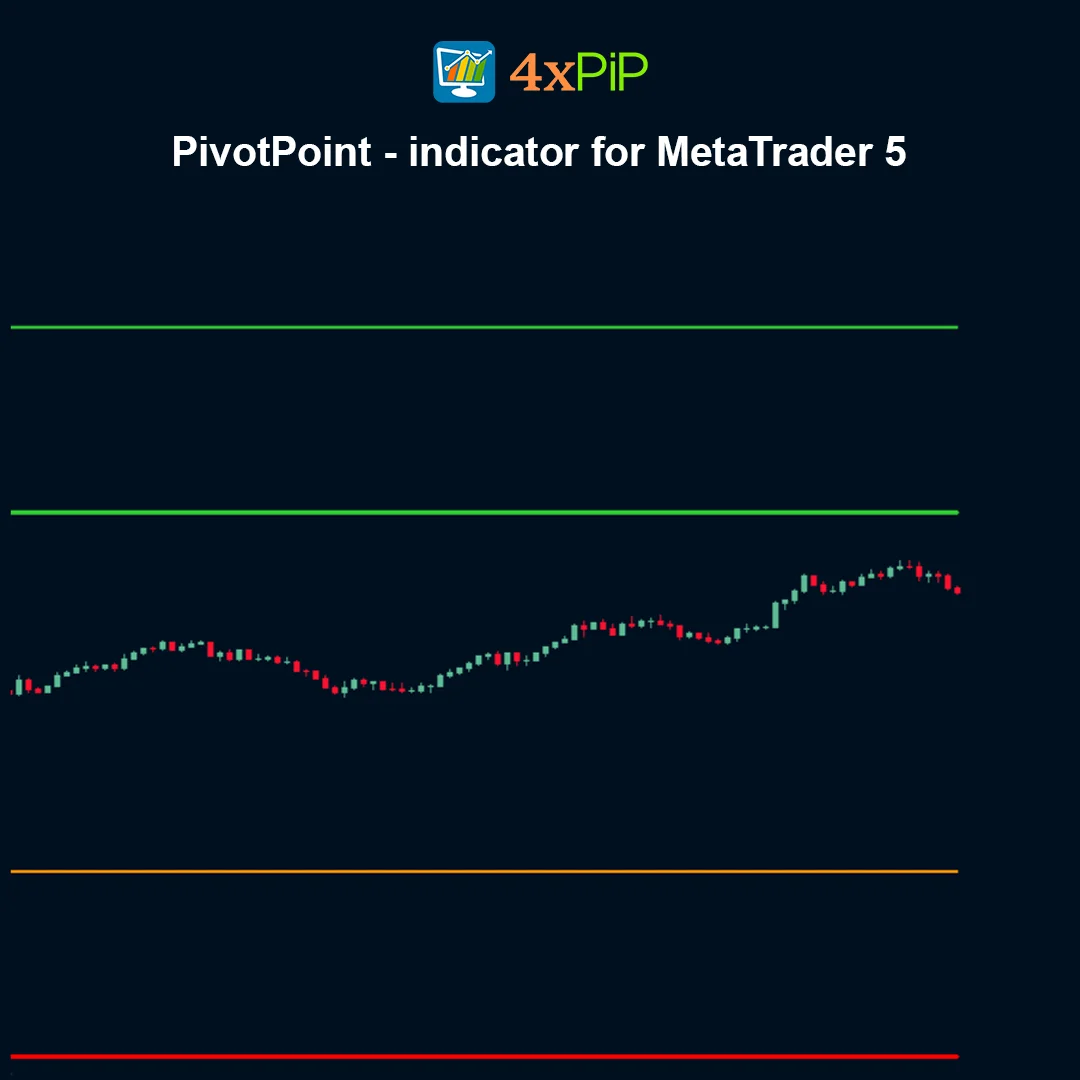
The PivotPoint indicator is a widely used technical analysis tool designed to calculate key support and resistance levels based on the previous trading period’s price data. Available for MetaTrader 5, this indicator helps traders identify potential turning points and important price levels where the market may reverse, pause, or continue its trend.
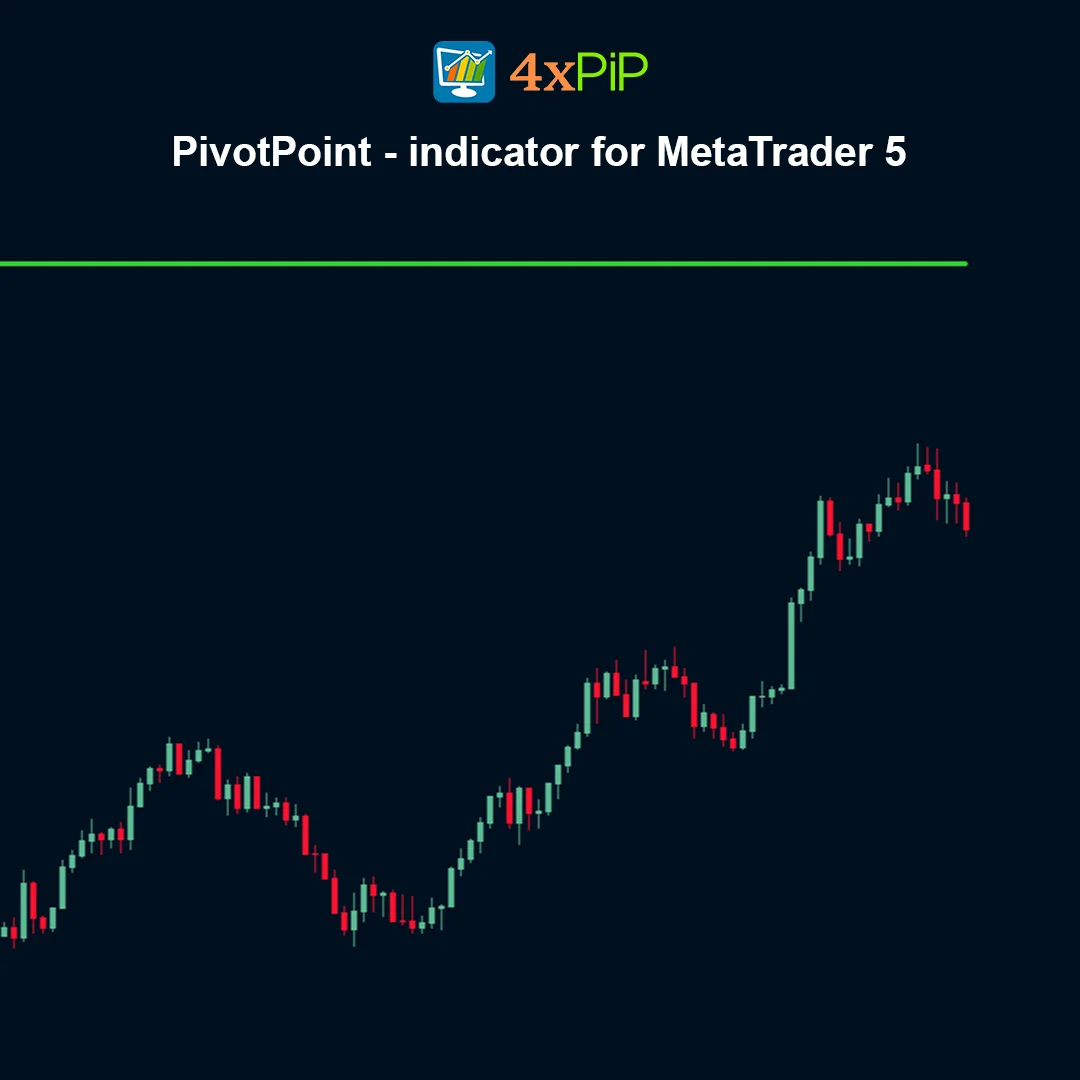
Pivot points are commonly used by day traders and short-term traders to determine intraday market direction. By analyzing the previous period’s High, Low, and Close prices, the indicator automatically plots the main Pivot Point along with multiple support and resistance levels directly on the chart.
These levels act as potential areas of price reaction, helping traders plan entries, exits, and risk management strategies more effectively.
Description
What is the PivotPoint indicator?
The PivotPoint indicator is a technical analysis tool that calculates important price levels known as pivot points along with support and resistance levels. These levels are derived from the previous period’s high, low, and closing prices and are used to anticipate potential price movements in the current trading session.
Why are pivot points important in trading?
Pivot points help traders identify key price levels where the market may change direction or experience strong buying or selling activity. Because many traders watch these levels, they often become areas of significant market reaction.
How does the PivotPoint indicator work?
The indicator calculates the central Pivot Point and multiple support and resistance levels using the high, low, and closing prices from the previous trading period. These levels are automatically plotted on the chart, allowing traders to quickly see potential market turning points.
What levels does the PivotPoint indicator display?
The PivotPoint indicator typically displays the following levels:
- Pivot Point (PP)
- Resistance levels: R1, R2, R3
- Support levels: S1, S2, S3
These levels help traders determine possible price targets and reversal zones.
How do traders use pivot points in their strategies?
Traders use pivot points to determine market bias. If the price is trading above the main pivot point, it often indicates bullish sentiment. If the price is trading below the pivot point, it may indicate bearish sentiment. Support and resistance levels are then used as potential entry or exit points.
Why is the PivotPoint indicator useful?
The PivotPoint indicator simplifies technical analysis by automatically calculating important support and resistance levels. This helps traders make faster decisions and identify potential trade setups more efficiently.
Advantages
- Automatically calculates important support and resistance levels.
- Helps traders identify potential market turning points.
- Widely used by professional traders and institutions.
- Useful for intraday trading strategies.
- Provides clear visual price levels on the chart.
- Works across multiple financial markets.
- Can be combined with other indicators for confirmation.
- Helps improve trade planning and risk management.
- Suitable for both beginner and experienced traders.
- Completely free indicator for MetaTrader 5 users.
Features
- Automatically calculates pivot points using previous price data.
- Displays central Pivot Point along with multiple support and resistance levels.
- Plots levels directly on the chart for easy visualization.
- Supports commonly used levels such as PP, R1, R2, R3 and S1, S2, S3.
- Helps traders quickly identify potential reversal zones.
- Useful for both intraday and short-term trading strategies.
- Compatible with all markets supported by MetaTrader 5.
- Lightweight indicator optimized for smooth performance.
- Works on multiple timeframes and chart types.
- Can be combined with trend indicators and price action analysis.
How to Trade
The PivotPoint indicator helps traders identify potential support and resistance areas for trading decisions. When the price trades above the central Pivot Point, it suggests bullish market sentiment and traders may look for buying opportunities near support levels such as S1 or S2. When the price trades below the Pivot Point, it suggests bearish sentiment and traders may consider selling opportunities near resistance levels such as R1 or R2. Traders also watch for price reactions around these levels because they often act as strong areas where the market may reverse or slow down. Many traders combine pivot points with other tools such as moving averages, candlestick patterns, or momentum indicators to confirm trade signals.
Formula
Pivot points are calculated using the previous trading period’s High, Low, and Close prices.
Pivot Point (PP) = (High + Low + Close) / 3
Resistance 1 (R1) = (2 × PP) − Low
Support 1 (S1) = (2 × PP) − High
Resistance 2 (R2) = PP + (High − Low)
Support 2 (S2) = PP − (High − Low)
Resistance 3 (R3) = High + 2 × (PP − Low)
Support 3 (S3) = Low − 2 × (High − PP)
Where:
- High — Previous period’s highest price
- Low — Previous period’s lowest price
- Close — Previous period’s closing price
- PP — Central Pivot Point level
Conclusion
The PivotPoint indicator is a powerful and widely used tool that helps traders identify key support and resistance levels based on previous price data. By automatically plotting pivot levels on the chart, it simplifies technical analysis and helps traders quickly recognize potential market turning points. When combined with other technical indicators or price action strategies, the PivotPoint indicator becomes an essential tool for effective trading on the MetaTrader 5 platform.
DOWNLOAD NOW Reach Us on WhatsApp
 Fly Over to Telegram
 Drop Us an Email
FAQ's
Q & A
Related products
-
 Premium
MT5 Trailing Stop EA
Original price was: $99.00.$10.00Current price is: $10.00. Select options -
 Premium
MT5 License System for Trading bots EA
Original price was: $199.00.$99.00Current price is: $99.00. Select options -
 Free
FreeMT5 EA Drawdown Limiter
Original price was: $100.00.$10.00Current price is: $10.00. Select options -
 Free
FreeMT5 Super Trend Indicator
$0.00 Select options
Reviews
There are no reviews yet