Stochastic Threads | Rainbow Stochastic Ribbon Multi lines Stochastic indicator for MetaTrader 4 – FREE
$0.00
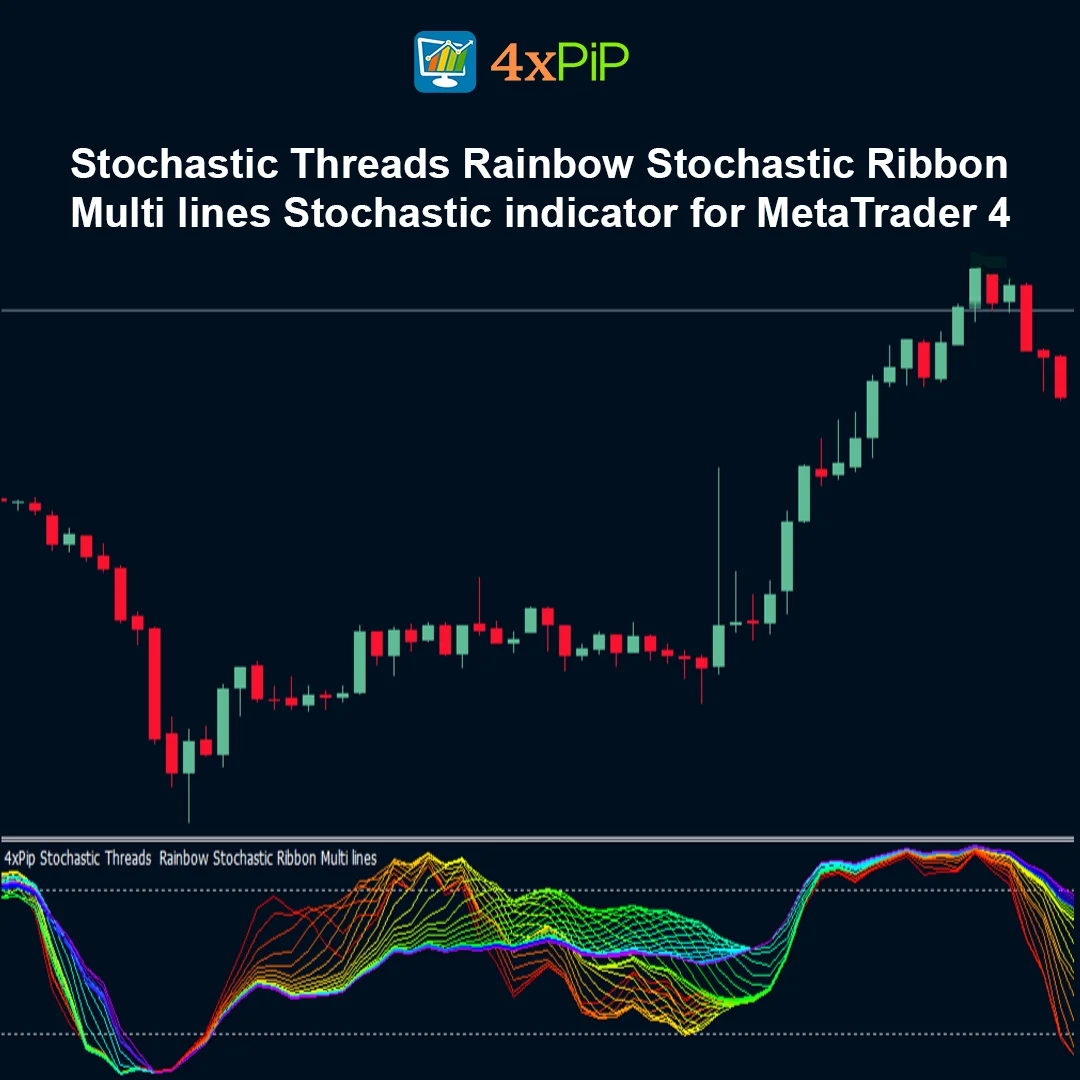
The Stochastic Threads indicator for MetaTrader 4, also known as the Rainbow Stochastic Ribbon, is a multi-line momentum oscillator that plots several stochastic indicators with different speeds in one window. By displaying multiple stochastic “threads,” it helps traders identify trend reversals, consolidation zones, and momentum shifts more effectively than a single stochastic oscillator.
Description
What is the Stochastic Threads indicator for MT4?
The Stochastic Threads indicator is an advanced momentum analysis tool designed to enhance the traditional Stochastic Oscillator. Instead of displaying only two stochastic lines, this indicator plots multiple stochastic oscillators with different period settings. These lines create a colorful ribbon or thread pattern that allows traders to observe momentum changes across different speeds simultaneously. This visual approach helps traders better understand market behavior and detect potential trend reversals earlier.
How does the Rainbow Stochastic Ribbon help identify market conditions?
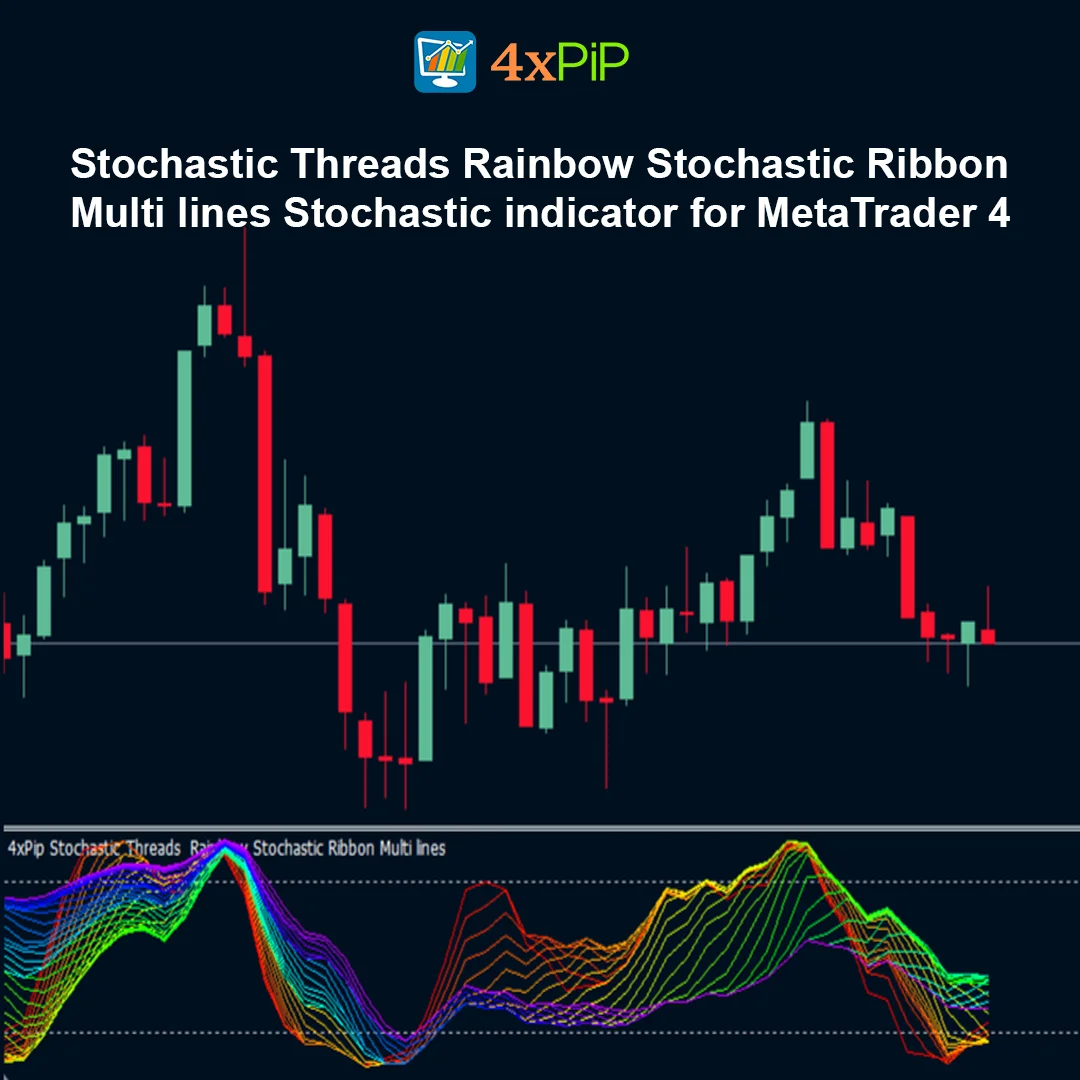
The indicator helps traders recognize whether the market is trending or ranging by analyzing how the stochastic threads behave. When the lines converge and cluster together, it usually indicates a consolidation or sideways market. When the lines begin spreading apart and diverging, it suggests increasing momentum and the possible start of a new trend. This pattern recognition allows traders to anticipate shifts in market direction more effectively.
How does the indicator detect overbought and oversold zones?
Similar to the traditional stochastic oscillator, the Rainbow Stochastic Ribbon uses standard momentum levels to identify potential reversal zones. When the threads move above the 80 level, the market is considered overbought, which may signal a possible downward correction. When the threads drop below the 20 level, the market becomes oversold, suggesting a possible upward reversal. Traders often look for thread convergence in these zones followed by divergence to confirm a trading signal.
Why do traders use multiple stochastic lines instead of one?
Using multiple stochastic lines allows traders to analyze both short-term and long-term momentum simultaneously. Faster stochastic lines react quickly to price changes, while slower lines reflect broader market trends. When all these lines align or diverge together, traders gain a clearer view of market strength and potential reversals. This layered analysis helps filter out market noise and improves trading accuracy, especially in volatile or sideways markets.
Advantages
- Displays multiple stochastic oscillators in one indicator.
- Helps identify trend reversals and momentum shifts.
- Provides clearer visualization compared to a single stochastic oscillator.
- Detects consolidation zones during sideways markets.
- Helps traders identify overbought and oversold conditions.
- Improves momentum analysis across different speeds.
- Supports multi-timeframe trading strategies.
- Helps filter out short-term market noise.
- Useful for both trend-following and reversal trading.
- Fully compatible with MetaTrader 4 platform.
Features
- Plots multiple stochastic oscillators simultaneously.
- Creates a rainbow ribbon or thread visualization.
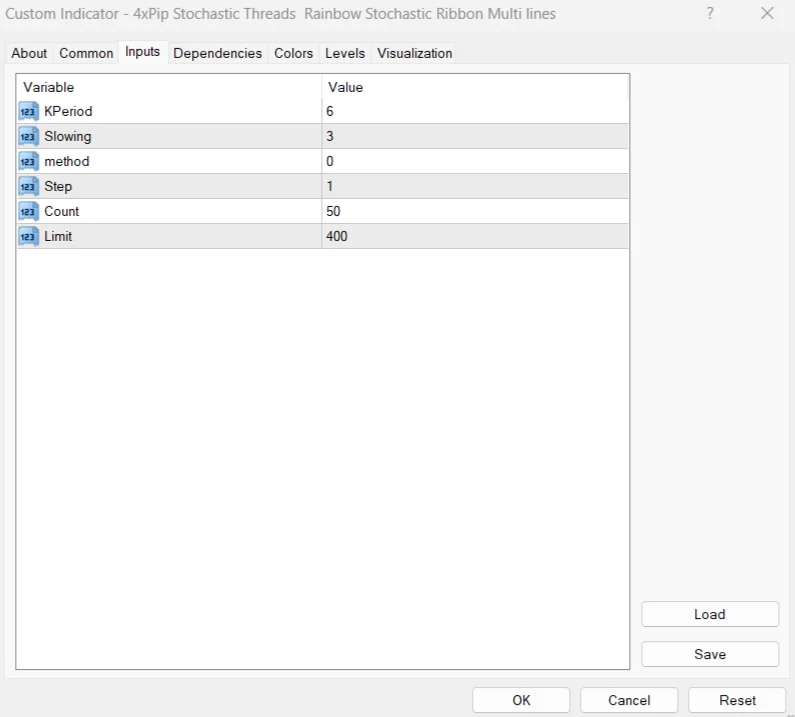
- Uses stochastic settings ranging from 6 to 24 periods.
- Highlights overbought (>80) and oversold (<20) zones.
- Displays momentum changes across different speeds.
- Detects trend start and trend exhaustion patterns.
- Customizable stochastic periods and line colors.
- Works in a separate indicator window.
- Lightweight and efficient calculation.
- Compatible with all markets supported by MT4.
How to Trade
Apply the indicator to your chart in MetaTrader 4.Watch for threads clustering together, indicating consolidation.Look for threads diverging upward for a potential bullish trend.Look for threads diverging downward for a potential bearish trend.Identify signals when threads converge in overbought (>80) or oversold (<20) zones.Enter trades when the threads begin diverging after convergence, confirming momentum direction.
Formula
The indicator is based on the stochastic oscillator calculation:
%K = (Current Close − Lowest Low) / (Highest High − Lowest Low) × 100**
Where:
Lowest Low= lowest price during the selected period
Highest High= highest price during the selected period
The Stochastic Threads indicator calculates this formula using multiple period settings (commonly from 6 to 24 periods), creating several stochastic lines that form the ribbon pattern.
Conclusion
The Stochastic Threads (Rainbow Stochastic Ribbon) indicator for MetaTrader 4 is a powerful momentum analysis tool designed to improve traditional stochastic trading strategies. By plotting multiple stochastic oscillators with varying speeds, it provides deeper insight into market momentum, consolidation phases, and potential trend reversals.
This ribbon-style visualization helps traders identify when the market is transitioning between ranging and trending conditions, making it a valuable tool for traders seeking more reliable momentum signals in Forex, stocks, and cryptocurrency markets.
DOWNLOAD NOW Reach Us on WhatsApp
 Fly Over to Telegram
 Drop Us an Email
FAQ's
Q & A
Related products
-
 Free
FreeMT4 EA Drawdown Limiter
Original price was: $100.00.$10.00Current price is: $10.00. Select options -
 Premium
Forex News (EA) Expert Advisor for MT4 | Economic Calendar
Original price was: $199.00.$99.00Current price is: $99.00. Select options -
 Free
FreeMT4 Heiken Ashi Indicator
$0.00 Select options -
 Free
FreeMT4 Multicolor MA Indicator
$0.00 Select options
Reviews
There are no reviews yet